3 documents found
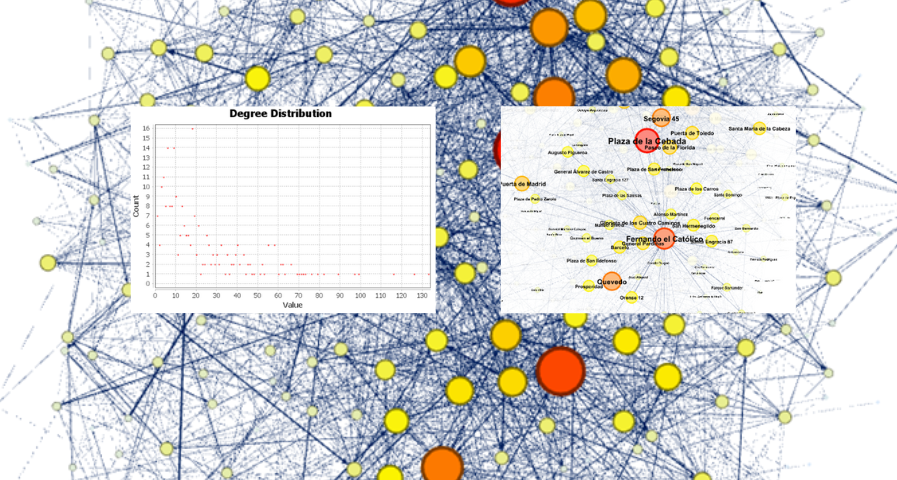
Analysis of travel networks in BICIMAD
1. Introduction
Visualizations are graphical representations of data that allow the information linked to them to be communicated in a simple and effective way. The visualization possibilities are very wide, from basic representations, such as line, bar or sector graphs, to visualizations…
- Data exercises
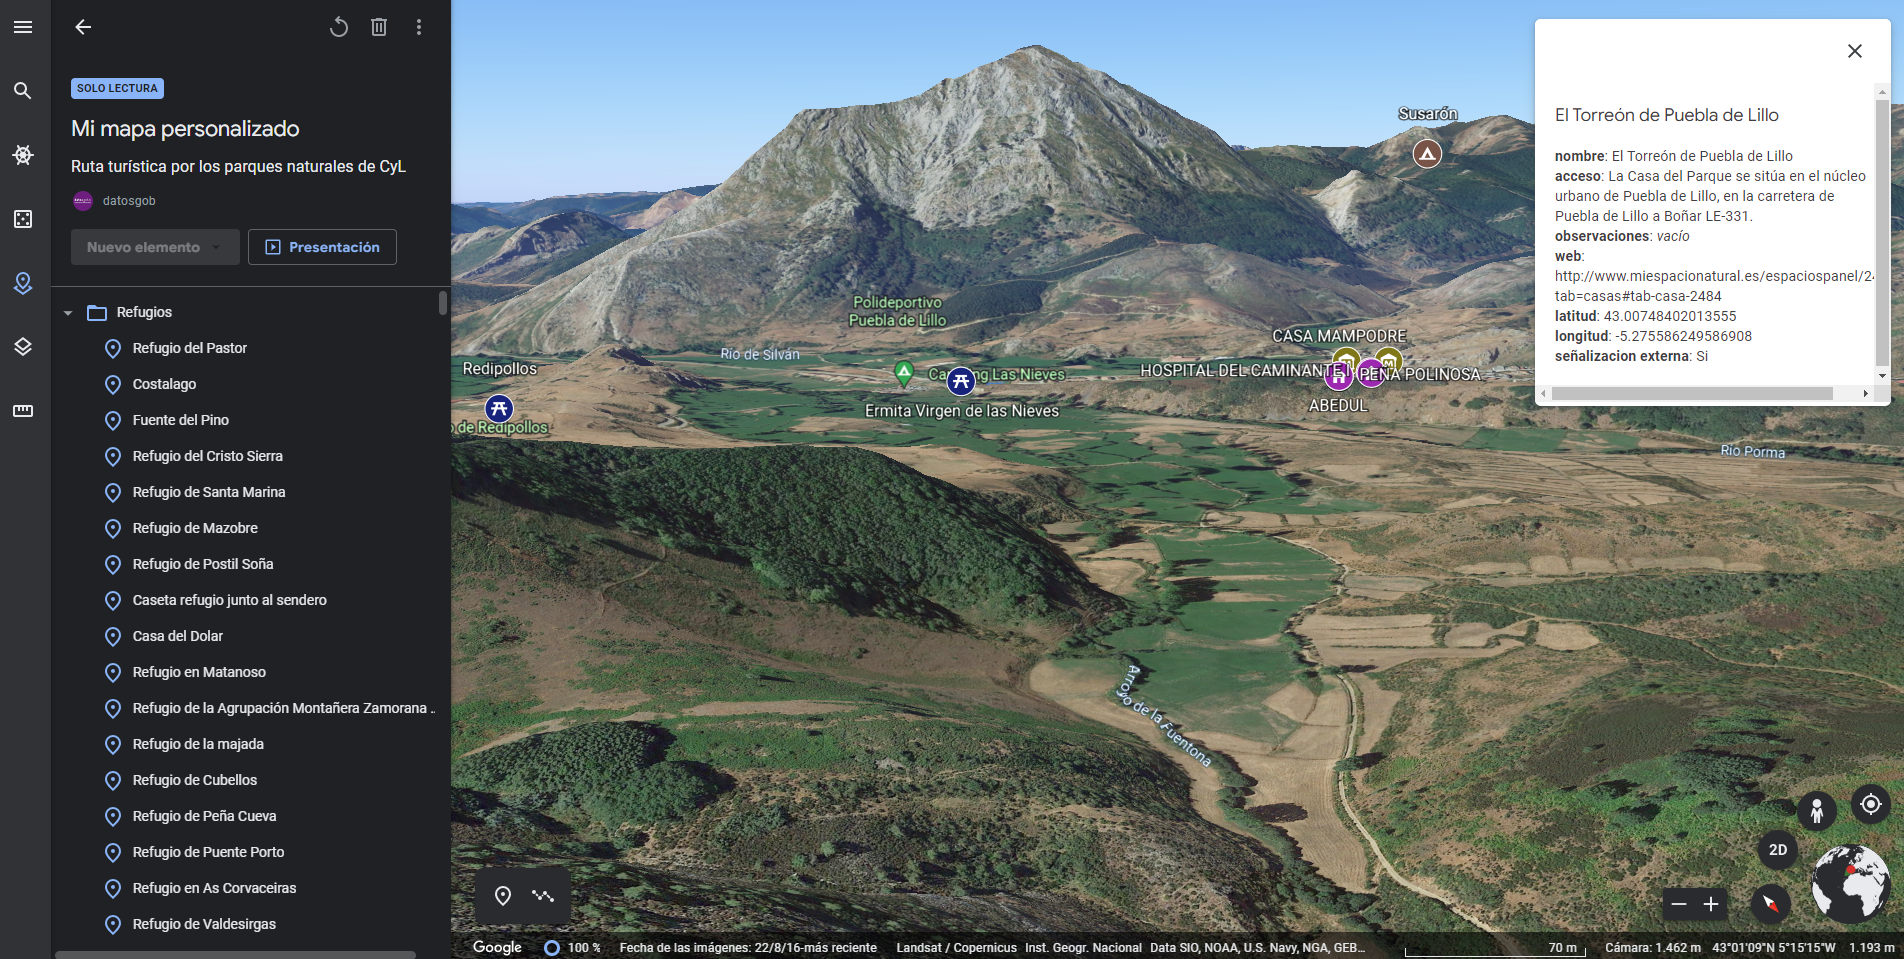
Generating personalized tourist map with "Google My Maps"
1. Introduction
Visualizations are graphical representations of the data allowing to transmit in a simple and effective way related information. The visualization capabilities are extensive, from basic representations, such as a line chart, bars or sectors, to visualizations configured on control…
- Data exercises
New trends and challenges in the data world
The amount of data we generate does not stop growing. 90% of the data created in the history of humanity were produced during the last year and a 40% annual growth is estimated for the next decade. These figures highlight the importance of data in today's economy and society. The data provide us…
- Reports and studies
