visualizacion
-
 Our first digital navigation. Open source alternatives to Google Maps
13-12-2023
In the vast technological landscape, few tools have made as deep a mark as Google Maps. Since its inception, this application has become the standard for finding and navigating points of interest on maps. But what happens when we look for options beyond...
-
 GPT-3 chat: we programmed a data visualisation in R with the trending AI
17-02-2023
Talking about GPT-3 these days is not the most original topic in the world, we know it. The entire technology community is publishing examples, holding events and predicting the end of the world of language and content generation as we know it today. In...
-
 Data storytelling: the importance of telling stories with your data
10-02-2022
Nowadays, no one can deny the value hidden in data: trends, areas for improvement or business opportunities are just some of the knowledge that can be found behind a series of figures. A correct analysis of an organization's internal and external data...
-
 Most popular geospatial visualisation tools
22-06-2021
Maps help us to understand the world in which we live and have therefore been fundamental in the development of humanity. They allow us to know the characteristics of a place and to understand social phenomena, such as the spatial behaviour of a...
-
 The most popular data visualization APIs and libraries
03-06-2021
A couple of weeks ago, we commented in this article the importance of data analysis tools to generate representations that allow a better understanding of the information and make better decisions. In this article we divide these tools into 2 categories...
-
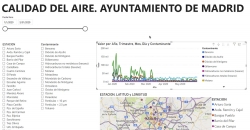 What is an interactive display? Here is an example
30-06-2020
The visual representation of data helps our brain to digest large amounts of information quickly and easily. Interactive visualizations make it easier for non-experts to analyze complex situations represented as data. As we introduced in our last post...
-
 The importance of graphical visualization of data
22-05-2018
"The simple graph has brought more information to the data analyst’s mind than any other device.” — John Tukey The graphic visualization of data constitutes a discipline within data science universe. This practice has become important milestones...


