


reutilización
-
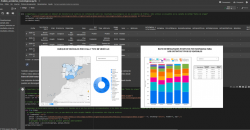
 Predictive analisys of electric consuption in the city of Barcelona
08-11-2023
Predictive analisys of electric consuption in the city of Barcelona
08-11-2023
1. Introduction Visualizations are graphical representations of data that allow you to communicate, in a simple and effective way, the information linked to it. The visualization possibilities are very extensive, from basic representations such as...
-
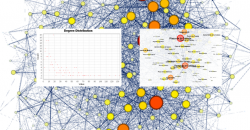 Analysis of travel networks in BICIMAD
11-09-2023
Analysis of travel networks in BICIMAD
11-09-2023
1. Introduction Visualizations are graphical representations of data that allow the information linked to them to be communicated in a simple and effective way. The visualization possibilities are very wide, from basic representations, such as line,...
-
 Study on nutrition in spanish homes
20-06-2023
Study on nutrition in spanish homes
20-06-2023
1. Introduction Visualizations are graphical representations of data that allow the information linked to them to be communicated in a simple and effective way. The visualization possibilities are very wide, from basic representations, such as line,...
-
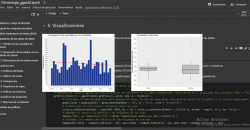 Analysis of meteorological data using the "ggplot2" library
12-04-2023
Analysis of meteorological data using the "ggplot2" library
12-04-2023
1. Introduction Visualizations are graphical representations of data that allow the information linked to them to be communicated in a simple and effective way. The visualization possibilities are very wide, from basic representations, such as a line...
-
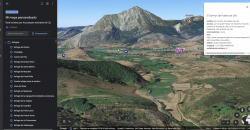 Generating personalized tourist map with "Google My Maps"
09-03-2023
Generating personalized tourist map with "Google My Maps"
09-03-2023
1. Introduction 2. Objective 3. Resources 3.1. Datasets 3.2. Tools 4. Data processing and preparation 5. Data enrichment 6. Map visualization 6.1. Map generation with "Google My Maps" 6.2. Personalization of the information to be...
-
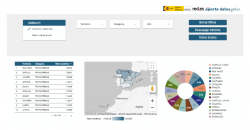
 Analysis of toxicological findings in road traffic accidents
18-01-2023
Analysis of toxicological findings in road traffic accidents
18-01-2023
1. Introduction 2. Objetive 3. Resources 3.1. Datasets 3.2. Tools 4. Data processing or preparation 5. Generating visualizations 5.1. Fleet of vehicles registered by Autonomous Communities and by type of vehicle 5.2. Ratio of...
-
 Analysis of the state and evolution of the national water reservoirs
21-07-2022
Analysis of the state and evolution of the national water reservoirs
21-07-2022
1. Introduction 2. Objetives 3. Resources 3.1. Datasets 3.2. Tools 4. Data enrichment 5. Data pre-processing 6. Data visualization 6.1. Geographic location and main information on each reservoir 6.2. Water reserve between the years...
-
 Principles and recommendations to make data.europa.eu data more reusable
13-06-2022
Principles and recommendations to make data.europa.eu data more reusable
13-06-2022
This report published by the European Data Portal (EDP) aims to advance the debate on the medium and long-term sustainability of open data portal infrastructures. It provides recommendations to open data publishers and data publishers on how to...
-
 Characteristics of the Spanish University students and most demanded degrees
05-04-2022
Characteristics of the Spanish University students and most demanded degrees
05-04-2022
1. Introduction 2. Objetives 3. Resources 3.1. Datasets 3.2. Tools 4. Data pre-processing 5. Visualizations 6. Conclusions 1. Introduction Visualizations are graphical representations of data that allow to transmit in a...
-
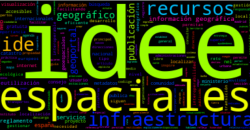 Creating word clouds from the text data with NLP techniques
14-12-2021
Creating word clouds from the text data with NLP techniques
14-12-2021
1. Introduction 2. Objetives 3. Resources 3.1. Tools 3.2. Datasets 4. Data processing 5. Creation of the world cloud 6. Conclusions 1. Introduction Visualizations are a graphic representation that allow us to comprehend in...


