


Documentation
Type
Audience
Document date
Tag
-

Los portales de datos abiertos son una fuente invaluable de información pública. Sin embargo, extraer insights significativos de estos datos puede resultar desafiante para usuarios sin conocimientos técnicos avanzados. En este ejercicio práctico,...
-
Word Embeddings - Practical Exercise on Tag Processing

Open data portals play a fundamental role in accessing and reusing public information. A key aspect in these environments is the tagging of datasets, which facilitates their organization and retrieval. Word embeddings represent a transformative...
-
A practical introductory guide to exploratory data analysis in Python

The following presents a new guide to Exploratory Data Analysis (EDA) implemented in Python, which evolves and complements the version published in R in 2021. This update responds to the needs of an increasingly diverse community in the field of data...
-

1. Introducción Las visualizaciones son representaciones gráficas de datos que permiten comunicar, de manera sencilla y efectiva, la información ligada a los mismos. Las posibilidades de visualización son muy amplias, desde representaciones básicas...
-
How to Create an Expert Assistant with Open Data: Building GPT to Answer the Critical Minerals Challenge
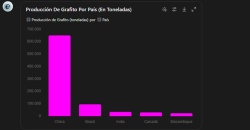
1. Introduction In the information age, artificial intelligence has proven to be an invaluable tool for a variety of applications. One of the most incredible manifestations of this technology is GPT (Generative Pre-trained Transformer),...
-
Road to electrification: Deciphering electric vehicle growth in Spain through data analytics
1. Introduction Visualisations are graphical representations of data that allow to communicate, in a simple and effective way, the information linked to the data. The visualisation possibilities are very wide ranging, from basic representations such...
-
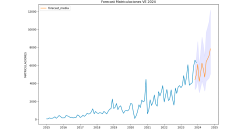
Predictive analisys of electric consuption in the city of Barcelona
1. Introduction Visualizations are graphical representations of data that allow you to communicate, in a simple and effective way, the information linked to it. The visualization possibilities are very extensive, from basic representations such as...
-
Analysis of travel networks in BICIMAD
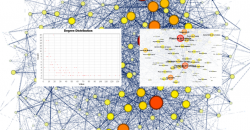
1. Introduction Visualizations are graphical representations of data that allow the information linked to them to be communicated in a simple and effective way. The visualization possibilities are very wide, from basic representations, such as line,...
-
Study on nutrition in spanish homes
1. Introduction Visualizations are graphical representations of data that allow the information linked to them to be communicated in a simple and effective way. The visualization possibilities are very wide, from basic representations, such as line,...
-
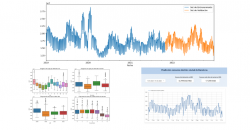
Analysis of meteorological data using the "ggplot2" library
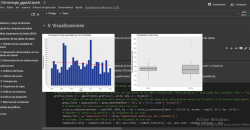
1. Introduction Visualizations are graphical representations of data that allow the information linked to them to be communicated in a simple and effective way. The visualization possibilities are very wide, from basic representations, such as a line...


