
Description
Every item of data counts. And even more so where well-identified and structured data is concerned. A single gap such as gender in datasets can mean a great deal. The Data Journalism Conferences, which have been held in MediaLab Prado thanks to Data Lab, this year reached their 5th edition with the slogan "every item of data counts". From May 3 - 6, journalists and others interested in communication, journalism and data attended the various workshops, talks and round tables.
How to request data from the administration? How to find data on the website of the National Institute of Statistics? What options does the New York Times API offer? What about the National Statistics Institute? Can one automate statistical queries? What possibilities for analyzing tweets does the open tool TCAT have? Why do they call it visualization when they mean map? What can be done and how with Bootstrap? These were some of the topics and sessions of the 2017 Fifth Data Journalism Conference: data visualization, cartography, new editing and analysis tools, and coding.
The first session was conducted by Esperanza Zambrano, deputy director for claims of the Council of Transparency and Good Governance, who explained the procedure for the public in general and journalists in particular to carry out requests for data management. She detailed some of the most common problems: the data does not exist at the time of making the request, the request is denied for commercial interests or data protection, etc. "The Transparency Law provides the legal framework for citizens to request data, and when it comes to making a request for information it is important to be clear about exactly what we want and which administration possesses it, even though the Council portal itself processes requests for data and redirects them". In Spain, requests for information require identification - electronic or paper - but not motivation. Information is public.
The use of APIs was addressed in two practical workshops: the use of the NYT API with the R programming language and how to access the API of the National Statistics Institute (INE) website. Inés Huertas, of Datatons and Data Science Madrid, and Leticia Martín-Fuertes, of R-Ladies, demonstrated this programming language that allows data scientists to manage large volumes of statistical data, is open source and offers a variety of libraries and graphic display capability. Laura Guerrero, INE, stressed: "We are giving visibility to the API and the interesting thing is that the user can automate statistical queries". Data series, data tables or metadata.
"Capturing Twitter data is a challenge". Alberto Abellán and Saya Saulière showed the open source TCAT tool focused on social analysis and research. An open tool that allows two things: on the one hand capture of tweets and on the other hand twitter analysis data: "let the data do the talking."
Open data and services in the world of cartography. The new data policy of the National Centre for Geographic Information - CNIG - was presented as part of this conference by Antonio F. Rodríguez, who detailed data and open services in cartography (municipalities, population bodies, maps, roads, etc.) and how bureaucratic and technical barriers to data availability and use have been eliminated. Recently, we gave an account on our open data portal of CNIG's latest developments regarding open data.
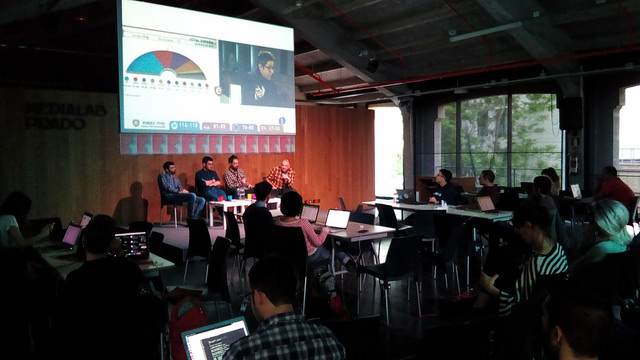
Installation and editing tools utilities such as Bootstrap, useful tools for working with data, such as the Cygwin console or the Emacs editor, or Screple, a data visualization tool, also had their space and time in this conference, which also offered the round table: "New forms of visualization and electoral analysis", with the participation of Juan Enrique Cotillas, Deputy Director of Infographics and Graphic Design for RTVE, and Kiko Llaneras, El País. The digital and paper integration of Diari Ara was another of the presentations, in which the person responsible, Auri García, reminded the audience that stories involving narrative are more valued and read than pure data.
The 2017 5th Data Journalism Conference was inaugurated on May 3 - World Press Freedom Day - and also coincided with the second session of the production workshop of data journalism that is taking place over three alternate weekends in April, May and June.