
Images
Information
Description
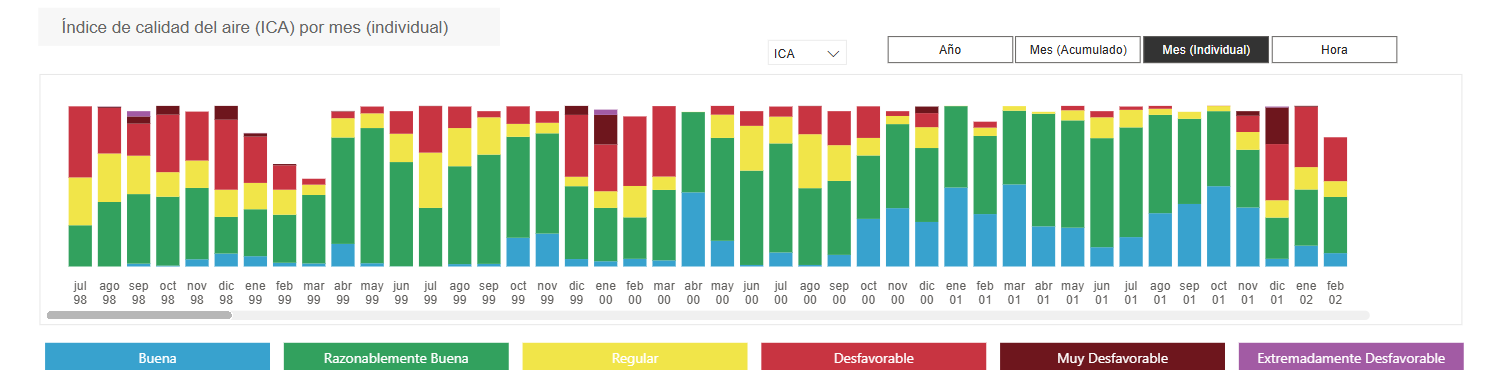
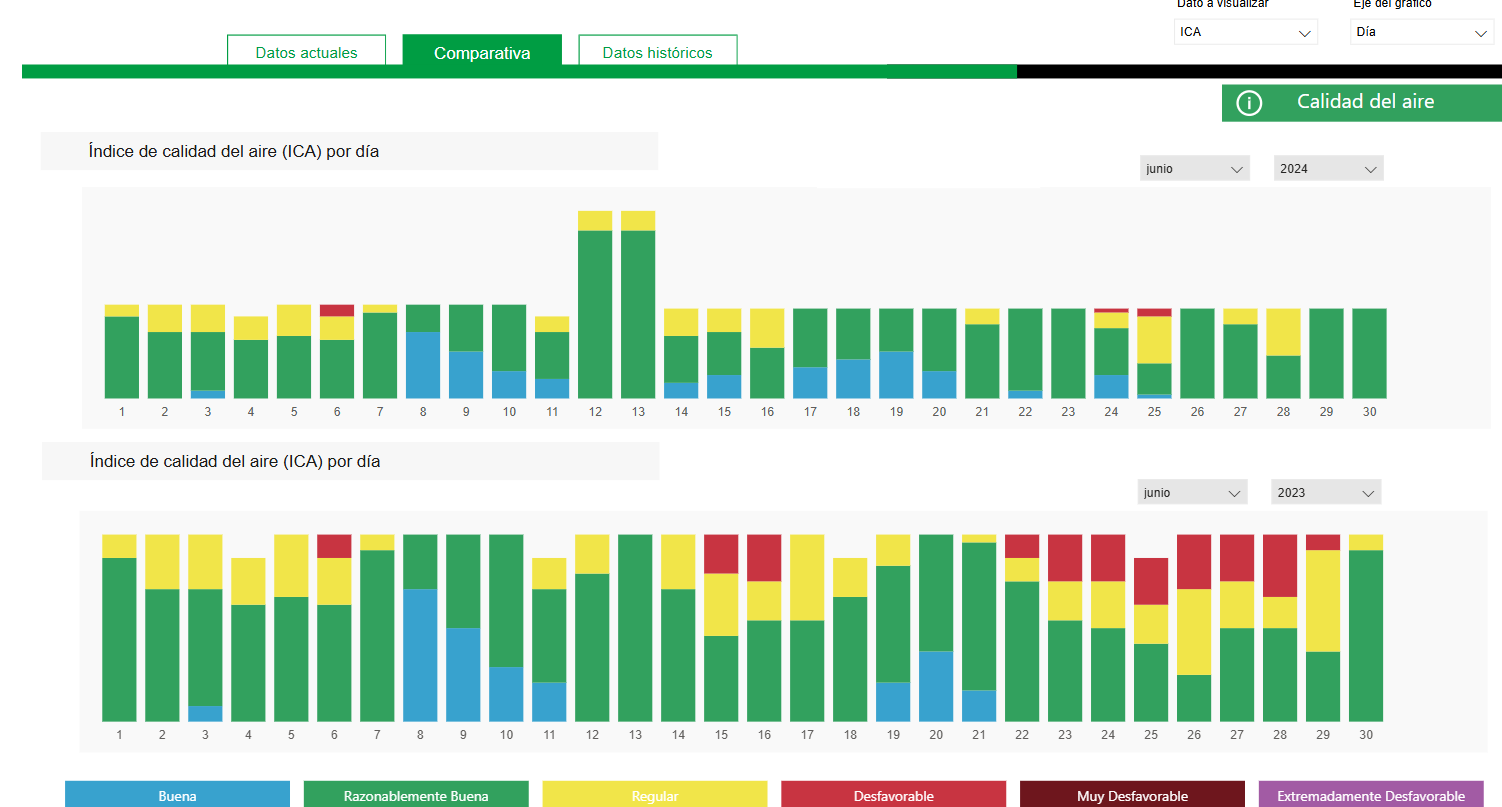
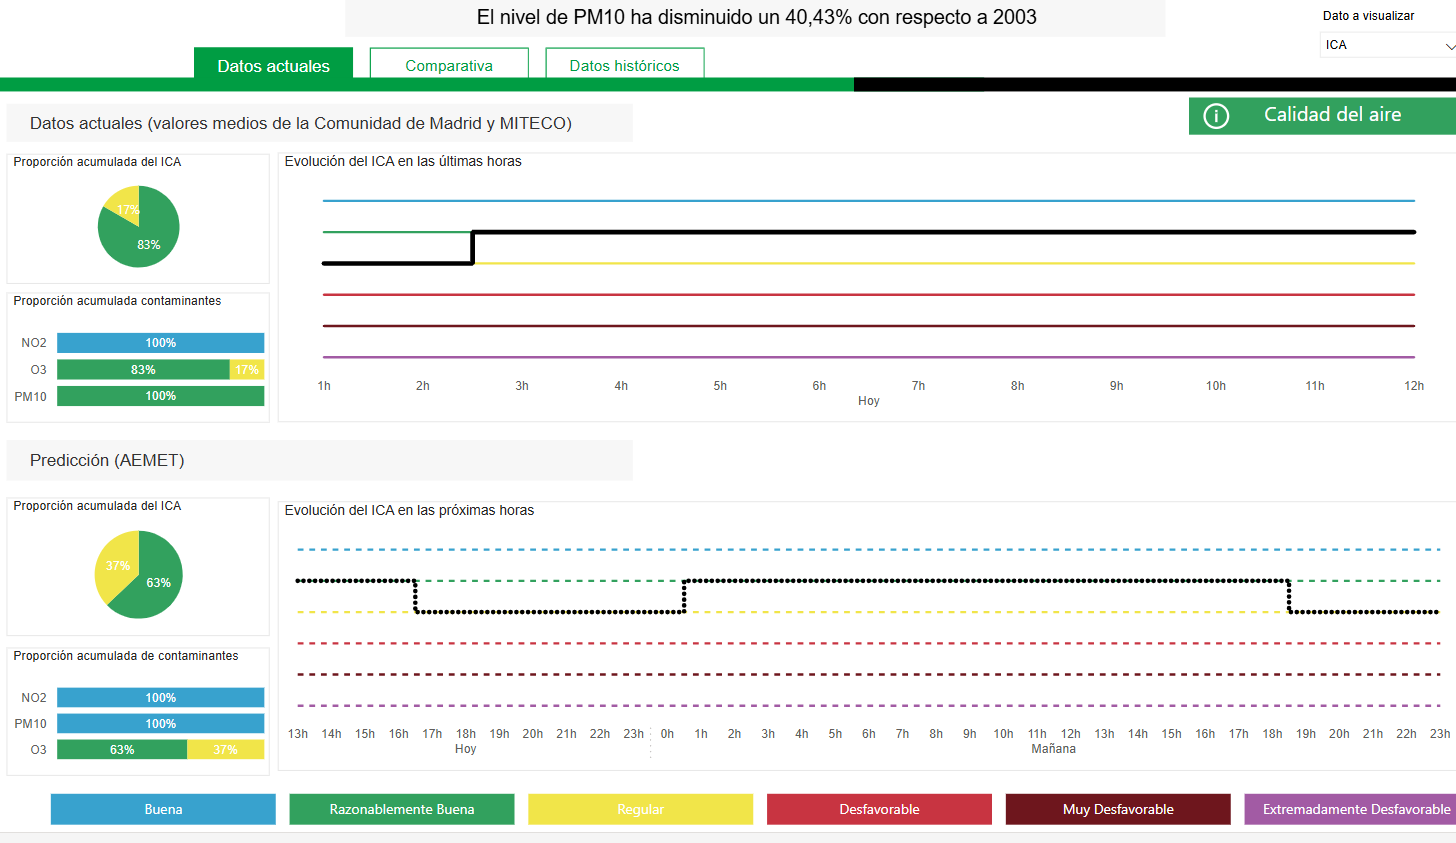
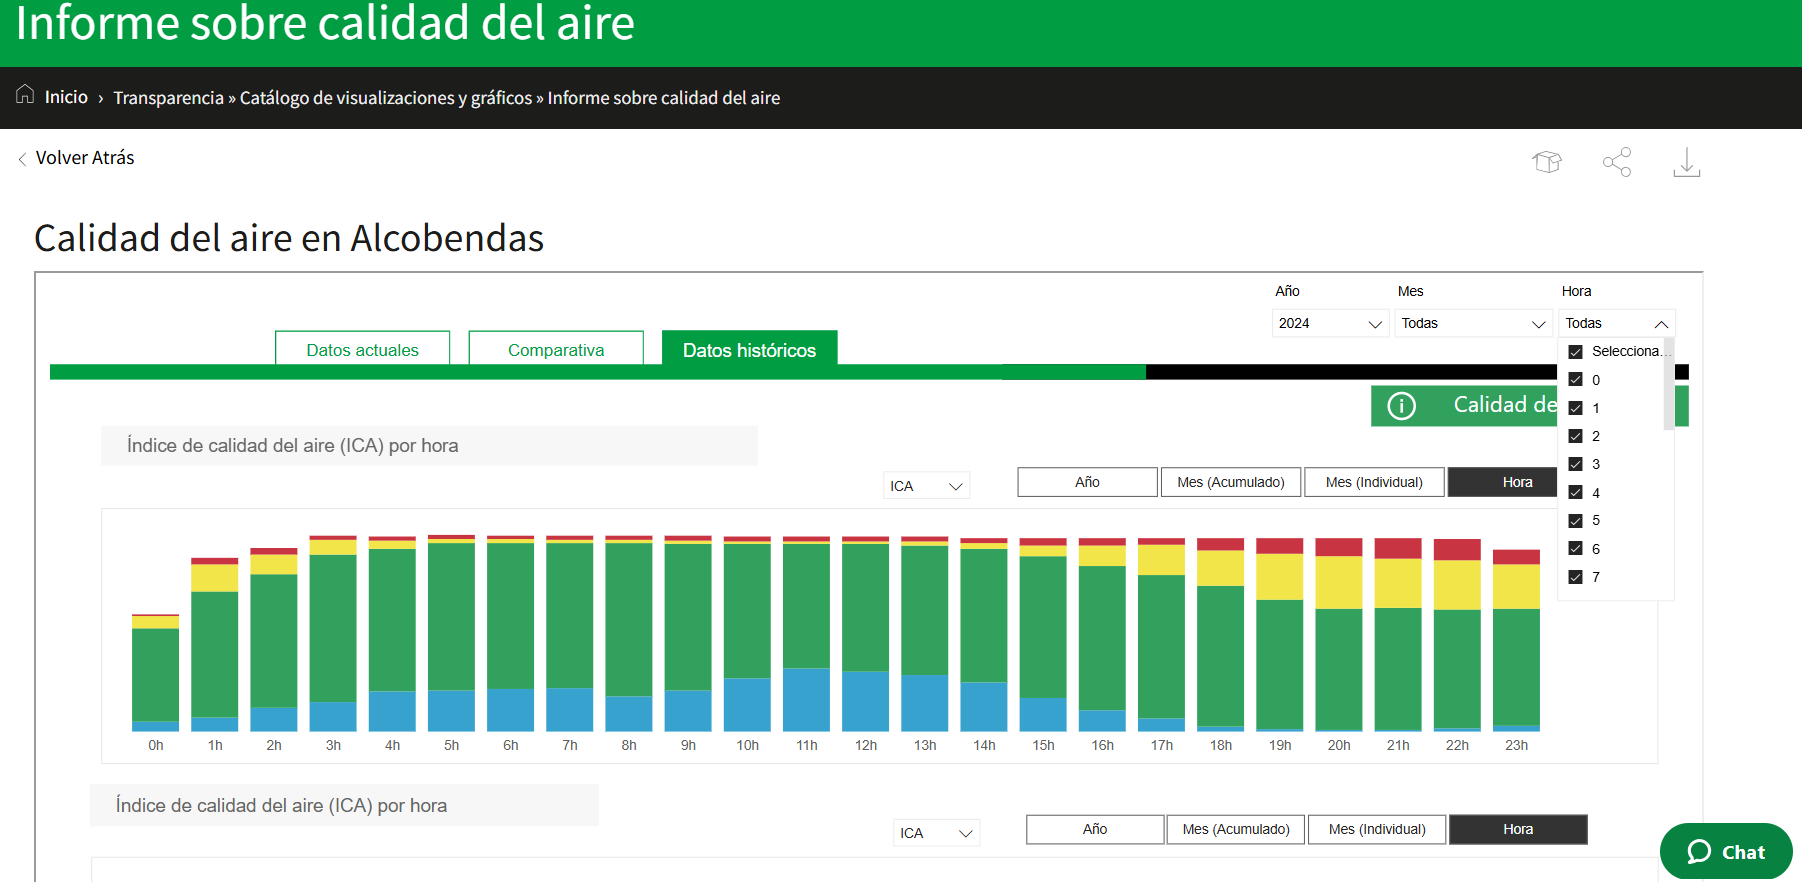
This Power BI dashboard provides historical data on air quality in the municipality of Alcobendas by day and hour, taking into account the Air Quality Index (AQI) marked by the Ministry of Ecological Transition, ie:
- Good
- Reasonably good
- Regular
- Unfavorable
- Very unfavorable
- Extremely unfavorable
It is also possible to view the information by year and cumulative month, as well as to make comparisons.