5 documents found
A practical introductory guide to exploratory data analysis in Python
The following presents a new guide to Exploratory Data Analysis (EDA) implemented in Python, which evolves and complements the version published in R in 2021. This update responds to the needs of an increasingly diverse community in the field of data science.
Exploratory Data Analysis (EDA)…
- Guides

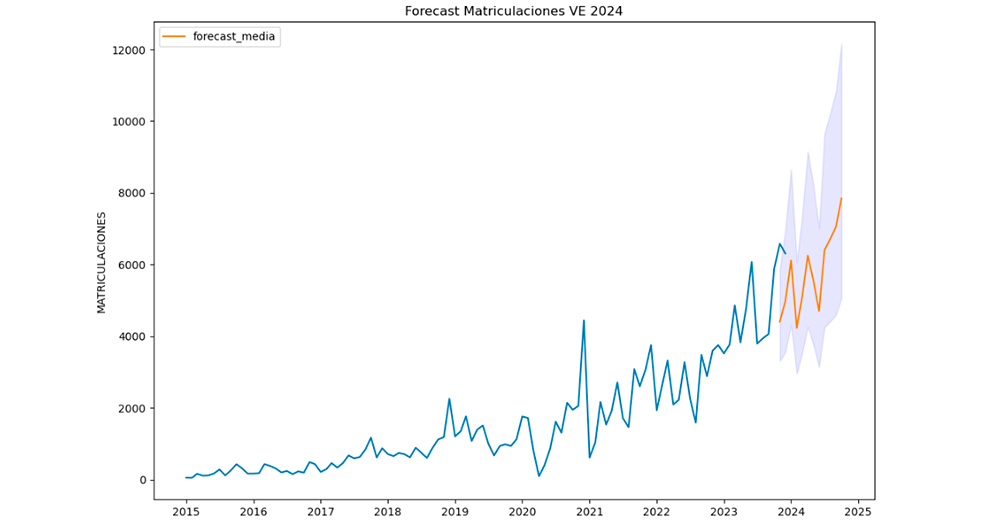
Road to electrification: Deciphering electric vehicle growth in Spain through data analytics
1. Introduction
Visualisations are graphical representations of data that allow to communicate, in a simple and effective way, the information linked to the data. The visualisation possibilities are very wide ranging, from basic representations such as line graphs, bar charts or relevant metrics,…
- Data exercises
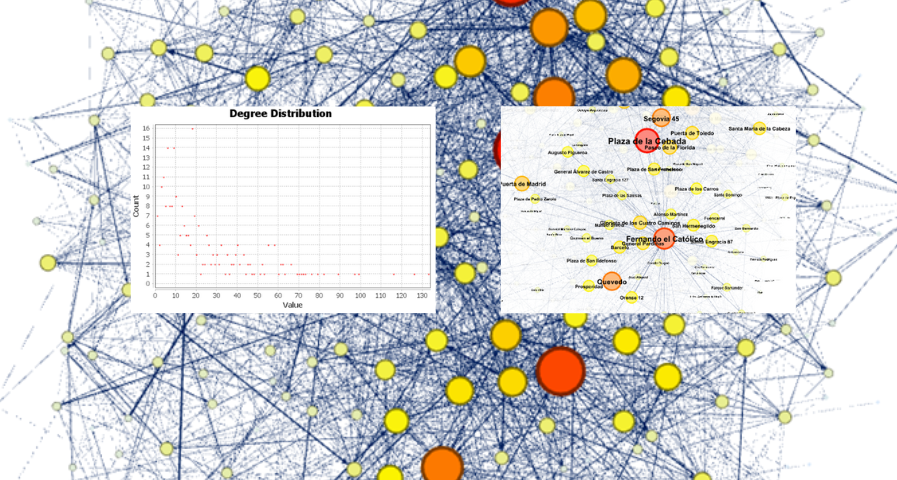
Analysis of travel networks in BICIMAD
1. Introduction
Visualizations are graphical representations of data that allow the information linked to them to be communicated in a simple and effective way. The visualization possibilities are very wide, from basic representations, such as line, bar or sector graphs, to visualizations…
- Data exercises
Analysis of toxicological findings in road traffic accidents
1. Introduction
Visualizations are graphical representations of data that allows comunication in a simple and effective way the information linked to it. The visualization possibilities are very wide, from basic representations, such as a graph of lines, bars or sectors, to visualizations…
- Data exercises

A practical introductory guide to exploratory data analysis
Before performing data analysis, for statistical or predictive purposes, for example through machine learning techniques, it is necessary to understand the raw material with which we are going to work. It is necessary to understand and evaluate the quality of the data in order to, among other…
- Guides