Documentación
The Sustainable Development Goals (SDGs) are a set of targets adopted by the international community aimed at addressing the most pressing challenges of our time. These goals were born simultaneously with the Global Partnership for Sustainable Development Data and the International Open Data Charter, which provided a coalition of experts willing to harness the benefits of open data for the new development agenda.
In this regard, open data plays a very relevant role within the development agenda as indicators of progress towards the SDGs, as they allow measuring and evaluating their progress, as well as improving accountability through sharing that data with the rest of the community, providing great value in multiple ways:
- Facilitating decision-making when designing policies and strategies to help meet the objectives;
- Identifying inequalities and specific challenges among different regions or population groups;
- Improving efficiency in policy and program implementation;
- As an engine of innovation through research and development.
Today, there are large global databases, both generalist and thematic, that we can use for these purposes, in addition to all the national data sources available in our own country. However, there is still a long way to go in this regard: the proportion of SDG indicators that are conceptually clear and have good national coverage is still 66%, according to the latest SDG progress report published in 2023. This leads us to continue facing data gaps in vital areas such as poverty, hunger, education, equality, sustainability, climate, seas, and justice, among others. Additionally, there is also a fairly general and significant lack of data disaggregated by age and/or sex, making it very difficult to properly monitor the potential progress of the objectives regarding the most vulnerable population groups.
This report takes a journey through the dual role that open data plays in supporting national and global progress in achieving the SDGs. The first part of the report focuses on the better-known role of open data as mere indicators when measuring progress towards the objectives, while the second part addresses its role as a key tool and fundamental raw material for the development of society in general and for the achievement of the objectives themselves in particular. To this end, it explores which datasets could have the greatest potential in each case, showing some practical examples, both national and at the European level, in various specific development objectives.
If you want to learn more about the content of this report, you can watch the interview with its author.
Documentación
This report published by the European Data Portal explores the so-called Citizen Generated Data (CGD). This category of data refers to those generated by citizens. There is a lack of this type of data within European open data portals, mainly due to the lack of publication and management of CGDs by public administrations.
The document analyzes various open data portals, whose main objective is to provide a vision of the CGDs that can be part of these portals and how to include them by public administrations. It should be noted that during the analysis, a framework is established for the description, reference, and characterization of the CGDs.
Finally, based on the conclusions of the previous analysis, the document offers a series of recommendations and guidelines for data publishers. The objective is to increase and improve the presence of CGDs in the publication of open data, involving citizens in the design of policy, processes and governance.
This report is available at the following link: "Data.europa.eu and citizen-generated data"
Documentación
Data are fundamental to solving the social and economic challenges we face today. It allows us to understand the causes behind a given situation and the factors that influence it, to estimate how it is evolving and to make informed decisions for change.
The problem is that solving such challenges often requires a combination of data from different sources:
- Data provided by the public sector
- Data from multiple private sector companies
- Citizen-generated data
But how can such collaboration be achieved? This is the question posed in the report "How to facilitate data collaboration to solve societal problems", written by Jose Luis Marín in the framework of the Aporta Initiative.
The report begins with a brief introduction outlining the current state of data openness in the public and private sectors, as well as in the citizenry. Then, it discusses the main barriers to data sharing by companies and citizens, the individual and collective benefits that can motivate these practices in the public interest, and the policies that can be put in place by public administrations to compensate and encourage collaboration.
Once the context is clear, it is time to look at some of the existing mechanisms for collaboration in data collection, sharing or processing to address a societal challenge. Although there are no systematised analyses of ideal forms of governance, four formulas have been identified for this report:
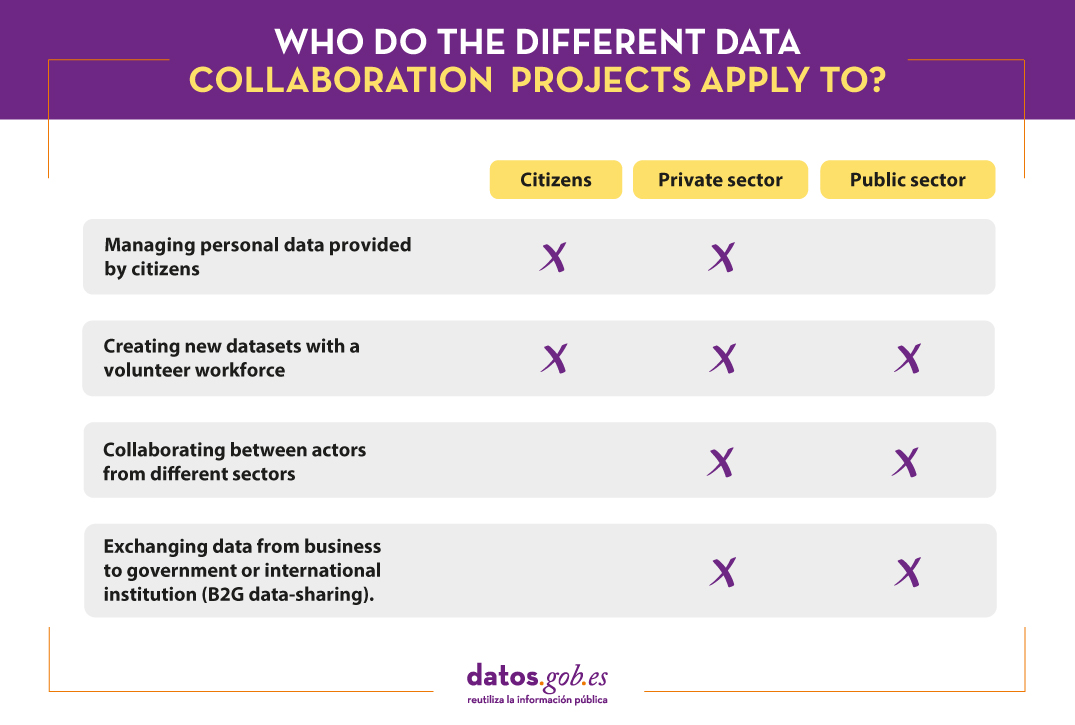
In order to illustrate and better understand each formula, the report includes multiple examples of international success stories, such as the Accelerating Medicines Partnership (AMP), which focuses on transforming the current model of developing new diagnostics and treatments, or the Open Apparel Registry (OAR), which aims to contribute to improving human rights and environmental conditions around factories.
The report concludes with a series of resources to help organisations collaborate successfully and reduce barriers, including collaboration networks, collaboration frameworks, courses and trainings.
Below, you can download the report, as well as access the complementary materials (executive summary, video-interview and summary presentation). The report is translated into English, but additional materials are available in Spanish version only.
Entrevista
Data journalism is one of the disciplines that has grown the most in the media in recent years, both within and outside our borders. This form of journalism consists of collecting accurate data, analysing it and making it available to the public through articles and/or graphic and interactive resources, facilitating the understanding of complex issues.
In datos.gob.es we have interviewed Adolfo Antón, designer, journalist, trainer and passionate about Free Software and open knowledge. Adolfo has been president of Open Knowledge Foundation Spain, coordinator of School of Data Spain, head of the Datalab at Medialab Prado, coordinator of the Data Journalism working group, of the Data Journalism Conference and curator of the Data Journalism (2014-2019) and Visualizar (2015-2018) workshops. He is currently coordinator of the Master's Degree in Journalism and Data Visualisation at the University of Alcalá and Professor of the Master's Degree in Digital and Data Journalism at the Nebrija University.
Full interview:
1. What does a data journalist do?
Thank you, first of all, for your interest in journalism and data visualisation and for what I can contribute to these fields. I appreciate and welcome the existence of datos.gob.es, an essential project that will soon be ten years old and which, paradoxically, I think is not sufficiently known, used and recognised in these fields.
To answer your first question, I am going to focus on what you have defined as data journalism, which begins with the collection of accurate data. There are currently many projects in the field of news verification and I see this, in my opinion, as a reaction to an exaggerated proliferation of false, manipulated news, hoaxes, lies and other faunas and floras of bad practices, not only journalistic but also communicative. The data we work with must be verified, certified, accredited and/or curated, providing context, source and methodology. Otherwise, we will develop flawed analysis and distorted stories.
There is a journalistic saying that goes "don't let a bad piece of information spoil a good headline", and in this temptation it is very important a strong journalistic ethics in journalists, editors and the media itself.
We need to verify, certify, accredit and/or curate the data we work with, providing context, source and methodology. Otherwise, we will develop flawed analyses and falsified stories.
Data journalism is essentially the use of computer applications to work with data, whether it is few, many or very many. Statistics, infographics and data visualisation are also important in data journalism.
With these IT tools, what Paul Bradshaw called the inverted pyramid of data journalism is realised:
- Compile (gather, collect).
- Cleaning (scrubbing, digging, investigating, interrogating)
- Contextualise (data and story context, methodology), and
- Combine (data, visualisations, infographics, maps, texts, interactives...).
It is therefore necessary to use IT tools and computer languages that cover one, several or all of the tasks in the work process. It is not mandatory, but it is advisable not to be cloistered in proprietary software, as this will determine the use we make of it. Third-party services can also be of great help, but it is preferable to use your own services that you have full control over
2. Why is data journalism important, and can you point us to any success stories or investigations where it has been key?
Data journalism is journalism that investigates with data and, therefore, is as important, necessary and primordial as journalism, if by this we mean critical and independent journalism, a fourth power in today's society. Not knowing how to work with data using IT tools limits us from doing good journalism, be it economic, political or sports journalism. Increasingly, data journalism is no longer the exceptional success story of generalist journalism, but the methodology of journalism in general.
The first cases of success in Spain can be circumscribed around Civio, an organisation that carries out data journalism in projects such as España en llamas, among others. Then, the projects that emerged around the conjunction of three elements that made data journalism grow in Spain are relevant:
- The Data Journalism group at Medialab-Prado, which awakens public interest in this discipline and enables the creation of an incipient community;
- The Unidad Editorial/URJC Master's Degree in Investigative Journalism, Data and Visualisation, which trains a first generation of data journalists;
- The media that are committed to it to a greater or lesser extent, such as El Español, El Mundo, El Confidencial, RTVE, El Diario de Navarra, eldiario.es or Ara.cat.
A high point in international data journalism, and also in Spain, was undoubtedly the investigation into the Panama Papers by the International Consortium of Investigative Journalists (ICIJ) in 2016, in which 109 media from 76 countries took part. In Spain, LaSexta and El Confidencial were the participating media and achieved a wide repercussion and the resignation of the Minister of Industry, Energy and Tourism.
Unfortunately, the Medialab-Prado Data Lab (the continuation of the data journalism group between 2016 and 2019) no longer exists, nor have all of these media maintained or strengthened their teams. But, in general, the discipline has spread in terms of community, universities and practices. This process has accelerated so much with the COVID crisis19, so that the current period is already considered the second golden age of data visualisation.
3. What challenges does data journalism face today?
It is a difficult question to answer because I believe that in addition to the traditional challenges of journalism, there are also those produced, as I said at the beginning, by the abundance of false, manipulated, biased news disseminated by social networks where issues such as ethics, privacy, authorship, anonymity or the automatic and mass-replicated production of content generates a deafening noise. In addition, intensive polarisation is used to collect data on people in order to create consumer profiles. This bombards the rational, reflective, discursive and greyscale process that good journalism can foster.
If I focus on data journalism as a methodology, the main challenge I see is to train journalists in the use of computer applications to work with data and thereby, little by little, improve journalistic output so that good data journalism products are valued by the general public.
The main challenge I see is to train journalists in the use of computer applications to work with data and thereby gradually improve journalistic output so that the general public appreciates good journalistic data products.
4. Is there a firm commitment by the traditional media to data journalism?
The Panama Papers were a hopeful moment for data journalism and also for the fact that a generalist television station was committed to this discipline. This has not happened in general terms, but it is true that the coronavirus crisis has produced an increase in work where some analysis and visualisation of data is produced, which can be seen on the front pages of media websites, for example. Without an in-depth analysis, I would say that most of them are more showcases with easy products than complete data journalism works in the sense that not all the stages of the journalistic project are carried out, but fragments that cover the demand.
It is worth highlighting the work in data analysis and visualisation being done by El País, RTVE.es and eldiario.es. At the same time, media specialised in news verification such as Newtral and Maldita are constantly producing news with innovative formats that also include data analysis and visualisation.
On the other hand, there are people who do not work in the media but who have come together since the beginning of the pandemic to work on COVID19 data in a commendable effort that combines data collection, analysis and visualisation and leaves the work practically ready for the media to take it and finish it off, but that magical connection has not yet been made.
From the experience of Medialab-Prado's data journalism workshops, I would say that working with data takes time, requires professionals, equipment, ideas, etc., but these are not investments that can be far from any newsroom, regardless of the size of the media outlet. The fact that such a firm commitment has not been made also leaves the field open for other proposals to position themselves better, as has happened with news verification.
5. Open data is essential for data journalists to have accurate information from official sources. What types of data are most in demand by data journalists for their research?
My impression is journalists do not normally take advantage of the open data that are available, either because it is very complex, because it requires extensive knowledge in data processing, because it requires a lot of work, because it is unknown or, finally, because it is not "attractive", it is not fashionable.
In other words, having an open data portal and an open data publication policy does not ensure that the data will be used, which does not mean that this, the publication of quality open data, should not be the default policy of any self-respecting public administration and source of information.
There are many different cases and to cite them all would take a more precise exercise of collecting them. Let us take two examples. INE data, in addition to their complexity, microdata, come in different formats. There are search engines with which to create your own set whose interfaces are very old and not very usable. Another case is the Zaragoza city council data portal. One of the best, but it requires registration to work with the API and the data can be extracted in JSON... I put an ellipsis because although it is one of the most used and manageable data formats, not everyone, as with microdata, knows how to use it. Ultimately, not all the problems in data journalism come from the absence of data but also from the formats and the skills to handle them.
Open data is often not exploited, either because it is too complex, because it requires extensive data processing skills, because it requires a lot of work, because it is unknown or, finally, because it is not "attractive", it is not fashionable.
In this sense, that of skills management, I remember that lately I have seen more than one media outlet embedding visualisations made by third parties. It could be one more example of those niches that data journalism is producing so that there are news agencies specialised in data. This should not be a negative thing, but it seems to me that third party tools are being used in limited formats. At the other extreme is the BBC, which makes a style guide on how to make graphics with R and creates a library so that the style of their graphics is different. That's betting on data too.
In the data journalism or visualisation workshops we always found that we lacked the magic dataset to work with, we had to create it. But we also encountered surprises and I think we certainly don't use most of the available data because we don't know it exists. So, in addition to demanding data, I would push in parallel for learning how to use existing data or create it.
6. How important are visualisations in data reporting? What technologies and tools do you use?
If I go by the usual story, visualisations are used in two main phases:
- On the one hand, at the data analysis stage. Data is visualised more easily with all kinds of graphical tools or charts that help us to find outliers, patterns, averages, etc.
- On the other hand, in the final part of the project, the journalistic product. The visualisation(s) can be just another part or the main piece of the journalistic story.
Lately I have been trying to explain what data visualisation is in computer terms. In paper format, visualisation is done with manual tools, manual or digital printing. But on the screen, on the Web, you can do any visualisation you want! With characters, text, images, video, audio, interaction, etc. If we understand the language and languages of this medium, we will be able to produce in a more integrated way data journalism works where any element has a place.
For this we do not need hardware other than what we already have, desktop or laptop computers, but we do need a compendium of free or open source software tools.
It goes without saying that there is a very wide spectrum of possibilities in the field of proprietary and/or proprietary software, but the use of free or open source software is essential to make a leap in the use of technologies in journalism and data visualisation.
If we understand the language and languages of this medium, we will be able to produce in a more integrated way data journalism works where any element has a place.
7. You are currently involved in 2 masters on data journalism, why should journalists have knowledge of data analysis and visualisation?
In addition to the Medialab-Prado experience, I have received or given courses in media and universities. I have been part of the Master in Data Journalism at Centro Universitario Villanueva in its three editions; I made the teaching guide for two modules of the Master in Data Journalism at UNIR and started teaching, although at that time I was not convinced by online training, possibly due to the use and abuse of proprietary software; I have taught a data module in the Master in Agency Journalism at Agencia EFE-UC3M. Now I am teaching in the Data Journalism and Visualisation module of the Master's in Digital and Data Journalism at Nebrija University where I try to transmit this basic knowledge about journalism and data visualisation.
I never stop learning and practising every day. I have created this Master's Degree in Journalism and Data Visualisation at the University of Alcalá because I understand that there is no training programme that addresses these issues in a comprehensive way, from free or open source software, and because since I started to relate to this world I have seen that data analysis and visualisation are essential for data journalism, but they have not been addressed in this way in the different university programmes.
It is true that, from the beginning, I have also heard or read that data journalism is collaboration and that there are many profiles in the newsroom and one person can't have them all, and the virtue is cooperation. That is true, but in order to cooperate you have to know how to cooperate on the one hand and know what you want to cooperate about on the other. In classical journalism, cooperation is commonplace - let's hope it is not lost - so all that is missing is the skills. The training that is done, almost always, tends to cater for different profiles, so that you also need to have an overview, to know what others do, what things might interest me, what strengths I should develop or compensate for. And then, having a good base and with practice, to use one or other skills in one or other roles.
Evento
On Friday, April 21, a workshop dedicated to data science in the social and health sector will take place in Media-Lab Prado, Madrid. A meeting designed for professionals and researchers specialized in the data analysis for social purposes and belonging to the health science.
The event will start with a specific session on the analysis of urban mobility through big data, followed by two talks related to the healthcare sector under the titles "Big4Cast: prediction of crisis in bipolar disorder" and "machine learning in EGG predictive analysis ".
As a clousure of the day, the attendees will be able to learn about the work of other experts in the field through the poster exhibition that will take place during the workshop. Those professionals who have sent their pieces of work to vlopezlo@ucm.es will obtain the corresponding certificate. Afterwards, a round table will be held where five representatives of public and private entities will discuss on the following topics:
-
Social development with maps (ESRI España).
-
Healthcare research (Fujitsu).
-
Madrid Salud (WAP).
-
Innovation in the cloud (AWS).
-
Open Data (City of Madrid).
To attend at the workshop, participants need to register before through the Eventbrite webpage.