Blog
The European Commission estimates that the data economy -the one whose business model is based on the exploitation of data to generate products and services-will reach a value of 550,000 million euros in the EU27 in 2025. This figure means that it will go from occupying 2.8% of GDP to 4%. Only in our country, it is aimed what will generate more than 50,000 million euros and 750,000 jobs.
In the same report, the Commission also indicates that, to achieve a high growth scenario, it is necessary to reduce the concentration of data in the hands of a few and to bet on data sharing policies that promote innovation and the advancement of the society. For this reason, among other actions, the Commission launched the Support Center for Data Sharing (SCDS), focused on researching and reporting on data sharing practices and those elements that influence their success.
Data sharing drives collaboration among researchers, developers, and creators of products and services, which can lead to important new discoveries, as well as impact the positive reputation of data-sharing companies. Companies are beginning to be aware of this situation, which is leading us to see more and more examples of private exchange initiatives and data sharing. This affects organizations of all kinds, including large companies that run, manage or have access to large volumes of data. Let's look at some examples of sharing:
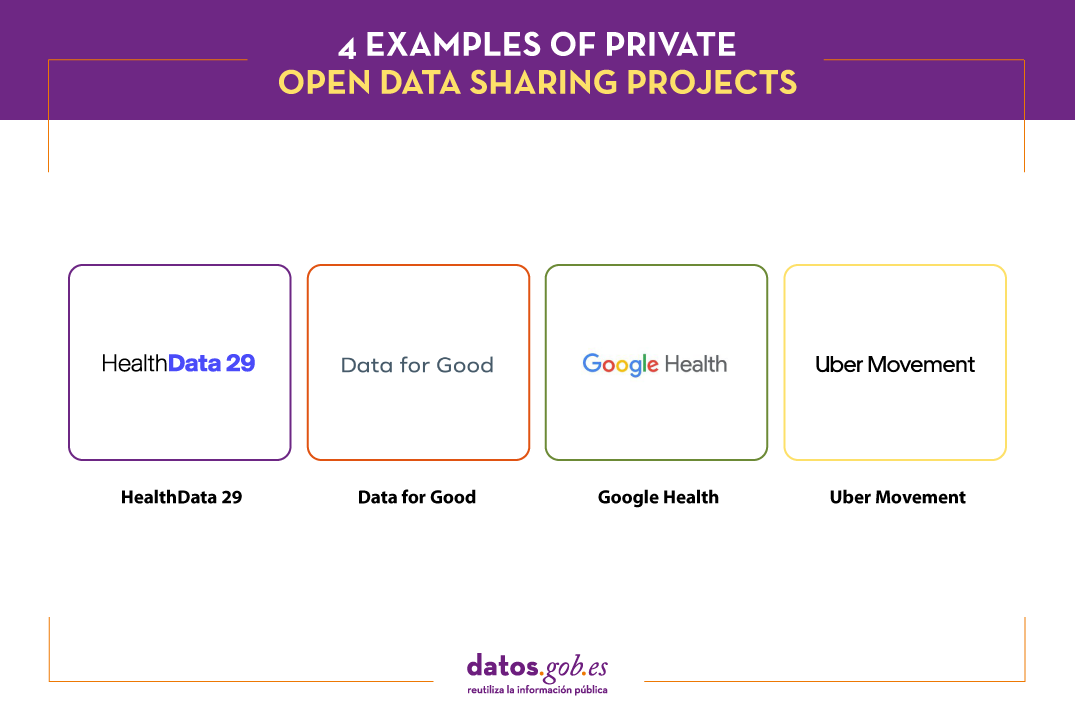
HealthData 29
The 29 Foundation, together with Microsoft, has launched Health29, a platform for sharing open data sets for research purposes. Garrigues and the Chair of Privacy and Digital Transformation of the University of Valencia have also participated in the project.
Organizations that wish to can register as publishers and start sharing anonymized data, ensuring privacy and security. There are currently 3 publishing organizations. All of them share data related to COVID-19:
- HM Hospitals shares clinical data related to the treatment of COVID-19, including diagnoses, treatments, admissions, ICU visits, diagnostic imaging tests, laboratory results, discharge or death, among others.
- The league provides data related to PCR and antigen tests performed on the players and staff of LaLiga Santander and LaLiga SmartBank clubs.
- Sanitas, as part of your project Data4good, provides researchers with demographic datas and clinical information (medications, vital signs, laboratory information and diagnosis) of patients with COVID-19 who have been admitted to their medical centers.
These data can be used to better understand the behavior of this disease and its treatment, but also to carry out predictive models of the evolution of the disease or epidemiological models. Researchers who want to access this data need to fill out an application, which must be approved by the publisher.
In the context of the project, a guide with the technical and legal framework to create a public repository of data from health systems.
It should be noted that Microsoft includes this action in its initiative to promote data sharing, Open Data Campaign, as Belén Gancedo, Director of Education at Microsoft Ibérica explained to us, in this interview.
Data for Good
Data for Good it is the name of the data sharing initiative of Meta, Mark Zuckerberg's company, formerly called Facebook, just like the social network -which does maintain the name-. Facebook has three billion users. Data for Good intends to use anonymized information about this community to "help organizations provide better services."
The web offers various data and tools, including maps. It also has a section for impact with examples of data usage. While some products require the signing of a data exchange agreement, others are public and open source, such as:
- High Resolution Settlement Layer: It is a population density map that uses census data, satellite images, and machine learning algorithms to detect structures. It has been used, for example, to analyze access to health centers in Spain.
- Movement Range Maps: consists of a map with daily updated mobility data (here is an article about the methodology). They have been used by governments and agencies around the world to measure the effects of mobility restrictions during the COVID-19 pandemic or the level of economic activity.
- Social Connectedness Index: map that measures the levels of friendship on Facebook between countries and regions in the world. This index helps predict economic, migration or health patterns, among others. It has been used by New York University, for example, to predict trade exchanges between geographic units in Europe.
- Commuting Zones: maps the areas where citizens live and work, based on transfers, and using machine learning algorithms. This information is only accessible, at the moment, for academic institutions, think-tanks or NGOs.
In addition, they also offer survey results on the economic impact on SMEs around the world, the climate change, the equality at home waves trends and impact of COVID-19 .
These tools are also available through the Humanitarian Data Exchange Portal of the United Nations Organization.
Google Health
Google Health has the goal organize the world's health information and make it universally accessible and useful. Within the project, both services are offered for all users, as well as specific ones for doctors.
In the general services part, we can find:
- COVID-19 Open Data Repository. Aggregate data from more than 20,000 sources to help better understand the behavior of the virus. Users can download the raw data sets or visualize them through maps and tables.
- Google Health Studies. Users can join studies and answer surveys to help institutions and researchers better understand the specific health problems and needs of a community. The particular data is encrypted for further aggregation and analysis in such a way that neither Google nor the researchers receive any private data.
Google also develops technology solutions aimed at improving healthcare. One of the fields where they are most focused is on jobs with Artificial Intelligence with different purposes such as helping diagnose cancer or prevent blindness.
Uber Movement
The mobility company Uber also provides data and tools, in this case, to understand how and why citizens move. Through the Web Uber Movement you can view, filter and download free, aggregated and anonymized data of trips made through your app. The service is only available and moment for some cities, among which are Madrid and Barcelona.
Specifically, it has 3 data services:
- Travel times. Provides the average travel time between two "zones" in a city for a specified time and date.
- Speed. Provides data on average speed derived from vehicle readings provided by Uber services, aggregated by street segment and with hourly granularity.
- Mobility HeatMap. This is a heat map showing the density of traffic in different areas of each city.
Thanks to this data, travel times can be compared and the impact of various events on the city can be understood. They are very useful for making decisions related to the challenges of urban transport, from reducing traffic jams and emissions to improving road safety.
All data is available through an interactive visualization, although it can also be downloaded in CSV format. This data is licensed Creative Commons, Attribution Non-Commercial.
In short, we are facing 4 different examples of data sharing, but with a common goal: to promote advances in society through the improvement of knowledge. All this data is essential to drive new research, improve decision making and even generate new products and services.
Content elaborated by datos.gob.es team
Blog
The "Support center for data exchange”(Support Center for Data Sharing or SCDS in English) was born in 2019 as part of the European strategy to promote a common data ecosystem. It is a space to investigate and report on the practices of so-called data sharing, which they themselves define as “transactions of any type of information in digital form, between different types of organizations”.
The SCDS provides practical support to public or private organizations that seek to share their data - regardless of the model chosen for it. Among other things, it disseminates good practices and success stories with the aim of inspiring others in the exchange of data. The examples, which are not limited to the geographical scope of Europe, cover different sectors, from agriculture to health to mobility.
In the report Data Sharing Practice Examples we found some of them. This report focuses primarily on third-party platforms and initiatives that can support governance and compliance in data sharing practices.
Practical examples and data sharing initiatives
One of the main challenges faced by organizations that begin to develop data exchange actions is the lack of trust that the sharing of their information can generate in the industry and the public. The use of third-party standards and technological solutions help to alleviate this challenge, also increasing efficiency by not having to dedicate time and resources to self-development.
The report divides the examples it shows into 3 categories, based on their main function:
- Data space catalysts: its objective is to create spaces for the sharing of data, addressing a specific sector or territory.
- Political / legal facilitatorsThey focus on the legal challenges of data exchange, either from a support position or offering their insight from experience.
- Technological facilitators: they are dedicated to developing technology - or advising on it - for the exchange of data in a general way, without focusing on a specific sector.
The report includes examples related to each of these categories as we will see below.
Data space catalysts: MaaS Madrid
We start with an example related to our country and the mobility sector. In Madrid there are about 70 mobility operators that offer bus, train, tram, car, bicycle and motorcycle services. Of them, 41 are public.
MaaS Madrid is a data aggregator that allows users to access real-time information from the aforementioned operators on a single integrated platform. It incorporates the information available on public transport and the adhered shared mobility services, redirecting to the applications of each of them to complete the reservation.
This is a great advantage for users, who will have all the centralized information to choose the route and the service that best meets their needs, while promoting the use of public or shared transport (with the consequent benefit for the environment).
This model also has advantages for operators, which increase their visibility and become better known among their public. In addition, it allows the collection of anonymous aggregated data in real time, very useful for decision-making and planning of mobility policies by public entities.
Political / Legal Facilitators: Technology Industries Finland
Technology Industries of Finland (TIF)is the organization in defense of electronics, electrotechnical, mechanical and metallurgical companies, engineering consulting and information technology in the Nordic country, with more than 1,600 members. After analyzing the use of data in these fields and observing the lack of established practices regarding data use rights, TIF has developed a model of conditions for the exchange of information, which they are promoting within and outside the country.
This model includes a series of standard clauses compatible with the legislation on competition and protection of personal data of the European Union. TIF recommends including these clauses as appendices to the pre-existing agreements between the parties involved in the data exchange.
Model terms are available in the webstore of Teknova.
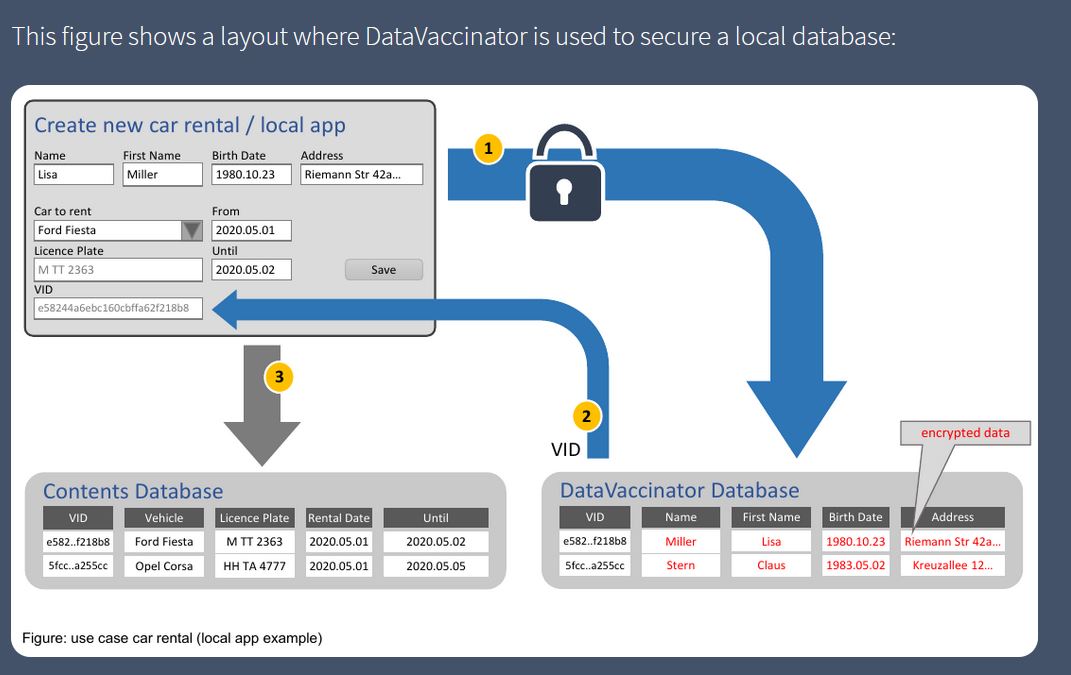
Technology Enablers: DataVaccinators
DataVaccinators focuses on the exchange of personal data in a secure way. It offers an open source software solution for the storage and protection of personal data through the use of pseudonymisation techniques applied at the time of data generation, which are separated into different databases and encrypted.
Developers can integrate other components into the database. The source code can be viewed and downloaded at GitHub (AGPL licensed), like the implementation in JavaScipt (licensed by MIT).
This solution is aimed at any type of organization, although it is especially useful for hospitals, universities, banks, insurers or manufacturers, who can take advantage of anonymized customer data to extract trends and make decisions.
Access more examples
These are just 3 examples, but the report includes many more. In addition, on the SCDS website you can find more success stories. As indicated by the SCDS itself, no model has yet emerged that has imposed itself on others, so it is important to document and be aware of the initiatives that are emerging in this area, in order to choose the one that best suits our needs. needs, although this situation has the risk of creating silos, based on the solution chosen by each operator.
The exchange of data between private organizations and with public bodies in all its forms can generate multiple benefits, mainly by providing more information to make better decisions that affect both the economic and social spheres. But to take advantage of all its advantages, it is necessary to carry out this exchange in a safe, legal and respectful way with the privacy rights of citizens.
Content prepared by the datos.gob.es team.