Entrevista
In this new episode of our podcast, we'll focus on statistical open data. One of the categories of datasets considered to be of high value by the European Union. Today we are going to talk about how this type of data produced by public administrations can become a key tool to better understand reality, make decisions and create new services. We have two guests for this.
- María Santana Álvarez, deputy director general of dissemination and communication en ofthe National Institute of Statistics (INE).
- Alberto González Yanes, deputy director of eStatisticsand DataaAnalysis dat the Canary Islands Institute of Statistics (ISTAC).
Listen to the full podcast (only available in Spanish)
Summary / Transcript of the interview
1. Why is statistical data considered high-value data? What is its potential?
María Santana Álvarez: In this society in which we live, where data surrounds us and information flows so quickly, it is important that official statistics are known and recognized as high-quality and reliable data, and this is achieved by making them accessible to all of society in an open way. This information is useful for informed decision-making and, therefore, statistical data already has a lot of value, but its reuse increases that value and has a great impact on society.
In relation to the data produced by the INE, the statistical operations for which we are responsible cover topics as varied as demography, the economy, the labour market, the environment, the service sector, science and technology, and living conditions, among many other topics. I'm going to give you some Specific examples of statistical operations: Turnover Index, Statistics on R+D activities, Monthly Birth Estimate or the Time Use Survey, in addition to those commonly known as the Consumer Price Index, the Labour Force Survey or the Quarterly accounting. As you can see, official statistical data is of great value and its reuse is essential.
The definition of high-value datasets has reinforced this. These are data that have a great potential for the benefits for society, the environment, the economy and, in fact, one of the categories established in the Regulationsr. It is statistics, which includes sets related to national accounts, demography or inequality - as you can see, the topics I have mentioned above - and in this category most of the datasets are produced by the INE.
Alberto González Yanes: In this century – or this beginning of the new century in which we are living – so saturated with information and data, it is important to take into account the importance of statistics in itself within a democratic society and advanced democratic states. Statistics, as objective and transparent data, are important to be present in open formats, not only for the economy - so that new services can be built - but also to reinforce and continue to strengthen data-based decision-making by not only public administrations, but also by companies and citizens.
One important thing must be taken into account: that the official data, whether published by the INE or by regional institutes such as ISTAC, generates rights and duties. I always give the example of how official data such as the CPI, or the official population figures themselves, generate rights and duties for municipalities, local entities, councils, governments, etc. ,
This level of magnitude, of the importance of statistical data as a fundamental pillar of democratic states - and this is recognised by the United Nations - gives rise to the need for not only the catalogue of the open data set defined by the European Commission's Implementing Regulation to be of high value, but also for all the data produced by official statistics to be considered of high value. Because it is fundamental for democratic states.
2. Can you explain a little more about the role of ISTAC and the INE in the statistical open data ecosystem? What services based on open data do you offer to citizens?
Alberto González Yanes: The regional and state statistical systems are two legs that are coordinated. We have the great Coordination within the system, within the CITE (Interterritorial Statistics Committee). What the autonomous communities do is either reuse the INE's own information, or expand the information that it is not developed at the national level and that it is necessary for regional purposes. We, for example, are one of the major international benchmarks in the production of tourism statistics, in such a way that we even appear within the systems of World Tourism Organization Best Practices. We offer information at the municipal level on tourism that some states do not even have at the national level. The information we have is reused by all the tourist information systems of all public administrations, but also by hotel employers' associations. That includes the Statistics of a tourist accommodation, Survey on Tourism Expenditure, Statistics on Tourist Movements at Canary Islands Borders -which we also developed collaboratively with the National Institute of Statistics, expanding the sample for the case of the Canary Islands- and the Tourist Housing Occupancy Survey. These are the great stars of information in an autonomous community that has a GDP of almost 35% linked to tourism.
María Santana Álvarez: In the case of the INE, all our production is offered openly through the website, which is the main meeting point with our users. Proof of this is that last year, in 2025, it received more than 42 million visits. All the data we produce is disseminated according to the publication schedule of statistical operations, free of charge and under an open license.
I like to talk about this topic in such a pedagogical way, taking Tim Berners-Lee's five stars as a reference and making an analogy between the INE's dissemination system and how we are climbing the ladder in that system. The current INE dissemination system is the result of many years of evolution and in this evolution we have opted for the development of tools that make reuse effective.
Starting with Tim Berners-Lee's stars, one star is that you produce the data and disseminate it openly under a license that allows reuse, but that is not enough for reusers to be able to effectively and easily make use of it. Two stars would be to offer the aggregated data we produce in proprietary formats such as excel and pc-axis. The three stars would be csv, in flat formats. And we come to the fourth star, which is to make information accessible through URI. The URLs are URIs and in the case of the INE we have a JSON API for all the aggregated data we produce.
In relation to this, I do want to comment on the advantages of having a JSON API. In our case, access is provided to the metadata and aggregated data that we produce. This involves an automatic and direct exploitation of all the information we produce. The data is updated according to the calendar; Regardless of when a user accesses that web service, they will find the latest data that is available. Users who use this system can customize their queries and filter through the metadata that defines tables and series.
Nor have we forgotten the great R User Community in data science. That's why we've produced a package called INEapir, which incorporates all the functionalities of the JSON API and makes it easier for these reusers to work with our data in an environment that they already know, in systems and data structures to which they are accustomed.
In addition, soon, all the documentation related to the API, will not only be in the current format that we have on the website, but also in OpenAPI with Swagger. This will allow access to our API information in a more interactive and intuitive way for all those users who are used to using general APIs.
Alberto González Yanes: It is important to note, first of all, that all statistical data is public by nature, because state statistical regulations – Law 12/1989 – or regional regulations require it to do so. In our case, we have different initiatives that allow reuse. From an ecosystem of about 10 or 15 APIs supported by international standards such as SDMX (Statistical Data and Metadata Exchange), which allows you to take all the information we produce, including the entire open data catalog: management APIs, all the cartography... We have everything in that API ecosystem to which we obviously incorporate connectors, be it Python, or R, with different libraries or specific connectors for some market solutions, to facilitate reuse by third parties in dashboards.
For us it is also important, apart from opening the data, open the entire part of Semantic Assets. We manage concepts, classifications, registration designs... For us, the Reuse of the entire part of classifications and concepts, apart from all statistical data. One of the main reusers of this entire system is the Government of the Canary Islands itself, incorporating, from the base, from the electronic forms of the electronic administration - and this is sometimes little known - all the standardised classifications that we have. They are doing this through the API of services that we have.
Therefore, we have different proposals, not only for access to data, but also for data processing and normalization.
3. How do you work to ensure interoperability between your statistical systems, and also with international organizations, such as Eurostat?
María Santana Álvarez: Before, I have been using Tim Berners-Lee's system to tell our level of openness in the INE's dissemination system. I stayed at the fourth star, but in that system there are five stars. And precisely That fifth star guarantees interoperability. From the point of view of dissemination, data that are subject to a National or international classification, such as the National Classification of Economic Activities, from Education, or Occupations u other standards that have been approved by the INE, such as the codes of the Autonomous Communities, provinces and municipalities, will always be accompanied by this metadata. Therefore, The data produced by other actors in this national statistical system that use these same classifications, codes, etc., will be interoperable with each other. That is from the point of view of dissemination, but also from the point of view of production, because in this national statistical system of which the INE is part, we all have to transmit to Eurostat what data we collect and disseminate, aggregated data. This way of establishing interoperability begins long before dissemination, that is, when new statistical operations are established or grouped together, directives and regulations are developed in which methodologies and concepts are established that all Member States have to use. This ensures that when we transmit the microdata or the aggregated results to Eurostat, it is already known that we have taken those same concepts, those same standards as a basis.
As for the transmission we do, to make it even more standard, SDMX and DSD are used based on data structures and lists of standard codes to ensure comparability and consistency in official European statistics.
Alberto González Yanes: As María has said, interoperability is a key and fundamental issue within public statistics. He spoke of the standardization of SDMX, which is fundamental and has been a reference even for the W3C, to draw up interoperability standards and ontologies. He spoke of the creation of codes and classifications that are not only usable among us, but also usable by the rest of the public sector. And there I link it a lot with the competence that public statistics has in terms of semantic standardization, according to the National Interoperability Scheme in article 10.3.
In this sense, as we take them seriously, the Interterritorial Statistics Committee proposed the creation of a statistical interoperability node at the national level, which would facilitate not only the exchange of information between the different statistical bodies of the Spanish State, but also the transmission of administrative data for statistical purposes from the public administrations to the statistical system. It is a benchmark project at European level. It was funded by the European Commission and we hope that throughout 2026 we will begin to deploy the different actions for the development of the node as a reference element at European level.
4. What are the main current challenges in opening statistical data?
María Santana Álvarez: I have previously commented that all our production of aggregate data from statistical operations, and also certain Anonymized microdata, are published openly. However, the INE has much more information to offer, but given its nature it cannot be done openly. I am referring to the Sensitive microdata.
Let's see a little bit of legal basis in this matter because it is a very sensitive issue. In 2022 there was an amendment to the Public Statistical Function Law, through which statistical services can grant research entities access to confidential data. These data do not allow the direct identification of the units and can only be used to carry out scientific studies of public interest, in addition to the fact that certain requirements must be met to be able to access them. In fact, the statistical services evaluate whether it is possible to provide this information, that is, we are very rigorous in giving access to this data. To give you an idea, the INE managed more than 80 requests for this type of access to confidential microdata last year and a high percentage of these were considered viable.
In addition, the INE is the coordinator of a project called It is _DataLlab, arising from a agreement signed by the Tax Agency, Social Security, the Bank of Spain and the Public Employment Service. All these organizations are large producers of official statistics, but also holders of a large volume of administrative records. Es_DataLlAB offers researchers the access to sensitive microdata sets resulting from the combination of different databases of at least two of the agencies that we have signed this agreement, but this cannot be offered openly for reasons of confidentiality and statistical secrecy.
What challenge is on the horizon to be able to provide this type of data, that is, microdata at the level of the reporting unit in an open way, without posing a problem of confidentiality, of statistical secrecy? The solution would be synthetic populations. In fact, at the INE we are working on the construction of these synthetic populations: populations that reproduce the statistical characteristics of the real population, but the records do not correspond to a real reporting unit. It is something fictitious, but that, when statistical analyses are done, have the same characteristics as real populations. This would be a way to openly publish microdata at this level of detail, without having to go through the evaluation committees that we have right now and the restrictions that must be complied with by current legislation.
5. Finally, how do you see the evolution of open data in the coming years? What technological or methodological innovations do you think will transform public statistics?
Alberto González Yanes: I think that, in addition, - and we take out that reflection in the National Open Data Meeting when it was held here in Lanzarote – another challenge that we have ahead of us in public statistics is the issue of facilitate the reuse of protected private data by data owners. The Portability concept, which is restricted within public statistics. There is no such concept. While the right of access to confidential data for scientific purposes is included and strengthened by the European regulation, the right of portability is not included. It is true that this is a look beyond the concept of open data, which is assimilated with public data, with certain criteria to facilitate its reuse, but what better reuse than what a company can do, for example, of the data we have in the public statistics itself? That data we have could be put in their information systems. We must bear in mind that, many times, we have more data from companies than they do, especially in a business structure based on SMEs, such as in the Canary Islands, where companies do not have those gigantic analytical capabilities, or simply to link it with the concept of data economy and put that data on the market. and that profit can be generated from data that we have deposited in our databases. That would require, possibly, a longer-sighted action in ten or fifteen years.
Alberto González Yanes: We can't end this podcast without talking about artificial intelligence, which seems to be the buzzword in recent years and it's like that for a reason. I think there is a technological disruption in this regard. We have the great challenge of incorporating data and statistical information into generative AI systems, especially to avoid the hallucinations or bias that is occurring in many of them. In addition, as generative AI does not hesitate, but affirms, in some cases data is raised that is not true and can lead to reputational problems, because they say "INE source" or "ISTAC source" and it is not true. So we have the great challenge of accompanying or improving generative artificial intelligence systems to avoid this bias.
Another great challenge is also to teach citizens in the literacy of the use of these systems. Not only for data access, but also code and transformations are generated based on datasets that we provide and sometimes the calculations are also poorly done.
María Santana Álvarez: This same reflection is shared internationally and for this reason working groups have begun to be created for the construction of guides that read, interpret and respond appropriately with respect to the questions asked from official statistical data. This requires the use of internationally common metadata and the construction of technology that interprets it properly. Told in a summarized way, it seems little, but the challenge is important and the implementation is not trivial. Of course, it will be worth seeing how it develops and the impact it will have on society.
Meanwhile, at the INE we are committed to improving the description of web pages, the metadata of our time series, tables, etc., and creating components so that search engines can find our information in a more efficient and accurate way.
Interview clips
1. What open data services does the INE offer to the public?
2. What is ISTAC’s role in the open statistical data ecosystem? What is its relationship with the INE?
Noticia
At the end of 2023, as reported by datos.gob.es, the ISTAC made public more than 500 semantic assets, including 404 classifications or 100 concept schemes.
All these resources are available in the Open Data Catalog of the Canary Islands, an environment in which there is room for both semantic and statistical resources and which, therefore, may involve an extra difficulty for a user looking only for semantic assets.
To facilitate the reuse of these datasets with information so relevant to society, the Canary Islands Statistics Institute, with the collaboration of the Directorate General for the Digital Transformation of Public Services of the Canary Islands Government, published the Bank of Semantic Assets.
In this portal, the user can perform searches more easily by providing a keyword, identifier, name of the dataset or institution that prepares and maintains it.

The Bank of semantic assets of the Canary Islands Statistics Institute is an application that serves to explore the structural resources used by the ISTAC. In this way it is possible to reuse the semantic assets with which the ISTAC works, since it makes direct use of the eDatos APIs, the infrastructure that supports the Canary Islands statistics institute.
The number of resources to be consulted increases enormously with respect to the data available in the Catalog, since, on the one hand, it includes the DSD (Data Structures Definitions), with which the final data tables are built; and, on the other hand, because it includes not only the schemes and classifications, but also each of the codes, concepts and elements that compose them.
This tool is the equivalent of the aforementioned Fusion Metadata Registry used by SDMX, Eurostat or the United Nations; but with a much more practical and accessible approach without losing advanced functionalities. SDMX is the data and metadata sharing standard on which the aforementioned organizations are based. The use of this standard in applications such as ISTAC's makes it possible to homogenize in a simple way all the resources associated with the statistical data to be published.
The publication of data under the SDMX standard is a more laborious process, as it requires the generation of not only the data but also the publication keys, but in the long run it allows the creation of templates or statistical operations that can be compared with data from another country or region.
The application recently launched by the ISTAC allows you to navigate through all the structural resources of the ISTAC, including families of classifications or concepts, in an interconnected way, so it operates as a network.
Functionalities of the Semantic Asset Bank
The main advantage of this new tool over the aforementioned registries is its ease of use. Which, in this case, is directly measured by how easy it is to find a specific resource.

Thanks to the advanced search, specific resources can be filtered by ID, name, description and maintainer; to which is added the option of including only the results of interest, discriminating both by version and by whether they are recommended by the ISTAC or not.
In addition, it is designed to be a large interconnected bank, so that, entering a concept, classifications are recommended, or that in a DSD all the representations of the dimensions and attributes are linked.

These features not only differentiate the Semantic Asset Bank from other similar tools, but also represent a step forward in terms of interoperability and transparency by not only offering semantic resources but also their relationships with each other.
The new ISTAC resource complies with the provisions both at national level with the National Interoperability Scheme (Article 10, semantic assets), and at European level with the European Interoperability Framework (Article 3.4, semantic interoperability). Both documents defend the need and value of using common resources for the exchange of information, a maxim that is being implemented transversally in the Government of the Canary Islands.
Training Pill
To disseminate this new search engine for semantic assets, the ISTAC has published a short video explaining the Bank and its features, as well as providing the necessary information about SDMX. In this video it is possible to know, in a simple way and in just a few minutes how to use and get the most out of the new Semantic Assets Bank of the ISTAC through simple and complex searches and how to organize the data to respond to a previous analysis.
In summary, with the Semantic Asset Bank, the Canary Islands Statistics Institute has taken a significant step towards facilitating the reuse of its semantic assets. This tool, which brings together tens of thousands of structural resources, allows easy access to an interconnected network that complies with national and European interoperability standards.
Noticia
The Canary Islands Statistics Institute (ISTAC) has taken a significant step forward in the volume of geographic data thanks to the publication of a total of 4,002 new datasets (3,859 thematic maps and 143 statistical cubes) in datos.gob.es, following its federation in Canarias Datos Abiertos.
This type of initiative is aligned with the European Union's Data Strategy, which establishes the guidelines to achieve a single data market that benefits companies, researchers and public administrations. The automation of publication processes through common standards is key to ensure interoperability and adequate access to open data sets of public administrations.
The generation of these datasets is the culmination of an automation work that has allowed the expansion of the number of published cubes, as now combinations of granularity and year since 2004 are presented. In early October, the ISTAC added to its catalog more than 500 semantic assets and more than 2100 statistical cubes, as we told in this post on datos.gob.es.
In addition, the sets published to date have undergone a renewal process to become the aforementioned 143 statistical cubes. The increase of these datasets not only improves the directory of datos.canarias.es and datos.gob.es in quantitative terms, but also broadens the uses it offers thanks to the type of information added.
The indicators of these cubes are represented on the cartography through choropleth maps and in multiple formats. This automation will, in turn, not only allow other datasets to be published more easily in the future, but also more frequently.
Another of the advances of this work is that the services are generated on the fly from the Geoserver map server, and not through an upload to CKAN, as was done until now, which reduces their storage and speeds up their updating.
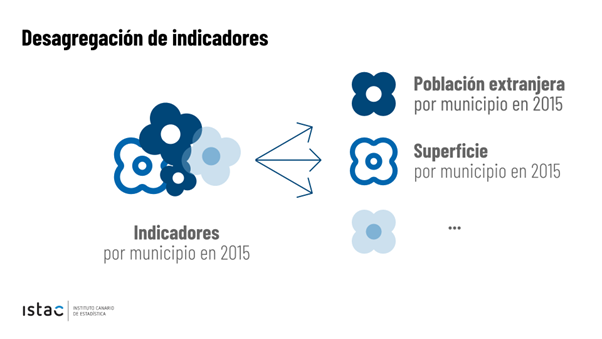
How to bring demographic indicators closer to the population
Demographic indicators are dense data cubes that offer a large amount of detailed geographic information, including total population, disaggregated by sex, residence, age and other indices up to a total of 27 different variables.
As so much information is contained in each cube, it can be difficult to represent specific indicators on the cartography, especially if the user is not used to working with certain GIS (Geographical Information System) software.
To bring this content to all types of users, the ISTAC has generated 3,859 new maps, representing on a choropleth map each of the indicators contained in the 143 statistical cubes. The publication of these new cartographic data is thus presented as a more efficient and simplified way of obtaining the information already represented, allowing users to easily access the specific data they need.
We could compare this transformation to flowers. Previously, only whole bouquets were published, with 27 flowers per bouquet, which had to be managed and handled to represent the flowers that were of interest. Now, in addition to continuing to publish the bouquets, new processes have been generated to be able to publish each flower separately, automating the generation of each of these sets, which will also be updated more frequently.
This new option facilitates the use of these choropleth maps (like the one shown in the image) by people without technical GIS knowledge, since they are presented in easily downloadable formats as images (.jpg and .png) for professional, educational or personal use.
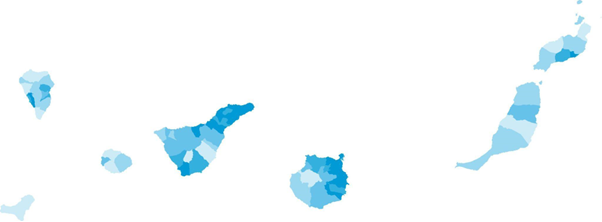

Mapa de población de 65 o más años (% sobre total) por municipios. Año 2022
For more advanced users, ISTAC has also expanded the range of formats in which the original indicator cubes are served. The "bouquets", which previously only showed data in CSV format, now have a wide variety of distributions: KML, GML, GeoPackage, GeoJSON, WFS, WMS. Taking advantage of the benefits provided by the use of styles in the WMS format, all the styles associated with the indicators have been generated, so that, using them, it is possible to represent the same map that is downloaded in image format. These styles are calculated for each indicator-granularity-year combination, according to the method of calculating quantiles for five intervals.
This new approach with both simple and complex geographic data enriches the catalog and allows users without specific knowledge to access and reuse them. In addition, it should be noted that this opens the door to other massive publications of data based on other statistical operations.
In short, this is an important step in the process of opening up data. A process that improves the use and sharing of data, both for the user on the ground and for professionals in the sector. Given the growing need to share, process and compare data, it is essential to implement processes that facilitate interoperability and appropriate access to open data. In this sense, the Canary Islands Institute of Statistics is concentrating its efforts to ensure that its open data sets are accessible and in the appropriate formats for sharing. All this in order to obtain value from them.
Noticia
Local statistical data helps us better understand our environment and identify variations between regions. This is essential to be able to formulate local policies tailored to the specific needs of the local population, something that has even been highlighted by the UN in one of its reports. In this sense, in the datos.gob.es catalog you can find statistical information on different localities and regions, such as the population and housing census, administrative records or even economic indicators.
One of the latest additions to our catalog is the Canary Islands Statistics Institute (Istac), as part of the datos.canarias.es initiative. The institute is the new Canary Islands Open Data Portal that is positioned as the only point of access to open data on the island in collaboration with the rest of the regional public administrations.
At the end of January, datos.canarias.es federated with datos.gob.es, incorporating 7,460 new datasets from the Istac and other organizations on the Island.
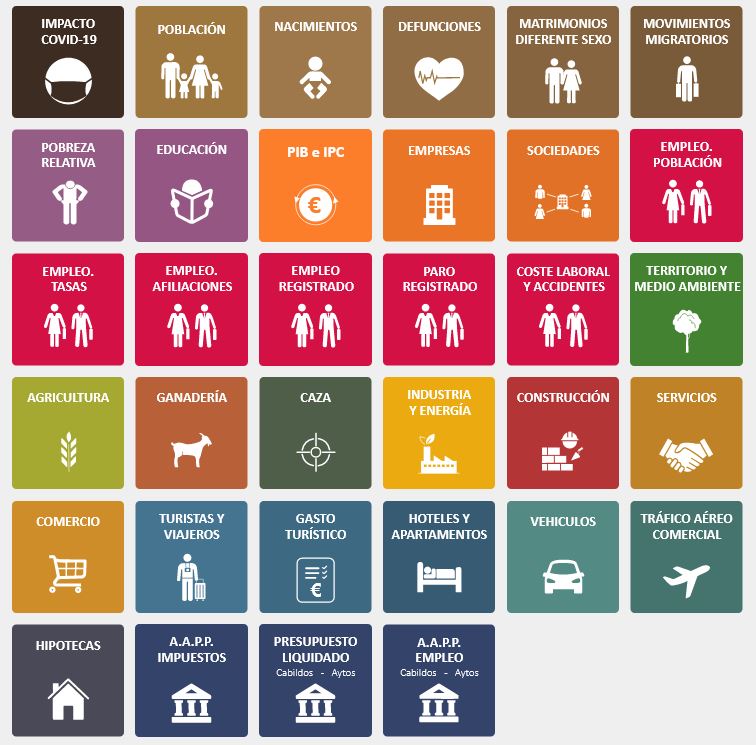
What kinds of data sets are available?
The federated data are categorized according to the recommendations of the Application Guide of the Technical Standard for Interoperability for the Reuse of Information Resources and address a wide range of topics related to the territory, the environment, demographics, the economy, and living conditions or the public sector. Shared data is divided into the following categories:
Istac's commitment to open data
The Decree approving the Statistical Plan of the Canary Islands 2018-2022 (PEC-22), establishes that during its execution the reuse of statistical data will be promoted in accordance with the Law on reuse of public sector information. At the same time, it indicates that the Statistical Data and Metadata Infrastructure (eDatos) will be the support for the open and interoperable dissemination of the data published by the statistical activities of the PEC-22, becoming the only channel for the decentralized dissemination of statistics in the corporate websites of the Government of the Canary Islands.
To comply with the aforementioned guidelines, the Istac has made the open data portal of public statistics in the Canary Islands available to the public, which, under the principles of public statistics and data reuse, distributes the data generated in a manner free, in open formats and with licenses that allow its reuse for commercial and non-commercial purposes.
The portal integrates data and metadata based on standardized semantic assets, geographic information and services to promote their use; and it has programmable application interfaces (API) that facilitate the access and download of the information by third parties. In addition to these APIs, it also provides a series of query tools that allow both downloading the data (for example an Extension for QGIS or an R Package), and taking it to another web or application, such as Widgets, Tableau Public or Google Public Data Explorer.
The website also has a statistical indicator viewer. The user can select the information they want to view from a large number of categories, for example, births and deaths, or the workforce. You can also choose the geographic space (the community as a whole or any specific island or municipality), the type of data (annual, interperiodic variation, etc.) and the temporal range. With this information, the tool will generate the graph with the Istac data.
All these tools show the interest of the Istac and the Government of the Canary Islands not only to facilitate access to their data, but also to promote its reuse by developers who want to create value-added products. With its integration in datos.canarias.es, the visibility of the local statistical data of the Canary Islands is promoted, at the same time that access to the data of interest of the entire Autonomous Community is homogenized.