Documentación
1. Introduction
Visualizations are graphical representations of the data allowing to transmit in a simple and effective way related information. The visualization capabilities are extensive, from basic representations, such as a line chart, bars or sectors, to visualizations configured on control panels or interactive dashboards.
In this "Step-by-Step Visualizations" section we are periodically presenting practical exercises of open data visualizations available in datos.gob.es or other similar catalogs. They address and describe in an easy manner stages necessary to obtain the data, to perform transformations and analysis relevant to finally creating interactive visualizations, from which we can extract information summarized in final conclusions. In each of these practical exercises simple and well-documented code developments are used, as well as open-source tools. All generated materials are available for reuse in the GitHub repository.
In this practical exercise, we made a simple code development that is conveniently documented relying on free to use tools.
Access the data lab repository on Github
Run the data pre-procesing code on top of Google Colab
2. Objective
The main scope of this post is to show how to generate a custom Google Maps map using the "My Maps" tool based on open data. These types of maps are highly popular on websites, blogs and applications in the tourism sector, however, the useful information provided to the user is usually scarce.
In this exercise, we will use potential of the open-source data to expand the information to be displayed on our map in an automatic way. We will also show how to enrich open data with context information that significantly improves the user experience.
From a functional point of view, the goal of the exercise is to create a personalized map for planning tourist routes through the natural areas of the autonomous community of Castile and León. For this, open data sets published by the Junta of Castile and León have been used, which we have pre-processed and adapted to our needs in order to generate a personalized map.
3. Resources
3.1. Datasets
The datasets contain different tourist information of geolocated interest. Within the open data catalog of the Junta of Castile and León, we may find the "dictionary of entities" (additional information section), a document of vital importance, since it defines the terminology used in the different data sets.
- Viewpoints in natural areas
- Observatories in natural areas
- Shelters in natural areas
- Trees in natural areas
- Park houses in natural areas
- Recreational areas in natural areas
- Registration of hotel establishments
These datasets are also available in the Github repository.
3.2. Tools
To carry out the data preprocessing tasks, the Python programming language written on a Jupyter Notebook hosted in the Google Colab cloud service has been used.
"Google Colab" also called " Google Colaboratory", is a free cloud service from Google Research that allows you to program, execute and share from your browser code written in Python or R, so it does not require installation of any tool or configuration.
For the creation of the interactive visualization, the Google My Maps tool has been used.
"Google My Maps" is an online tool that allows you to create interactive maps that can be embedded in websites or exported as files. This tool is free, easy to use and allows multiple customization options.
If you want to know more about tools that can help you with the treatment and visualization of data, you can go to the section "Data processing and visualization tools".
4. Data processing and preparation
The processes that we describe below are commented in the Notebook which you can run from Google Colab.
Before embarking on building an effective visualization, we must carry out a prior data treatment, paying special attention to obtaining them and validating their content, ensuring that they are in the appropriate and consistent format for processing and that they do not contain errors.
The first step necessary is performing the exploratory analysis of the data (EDA) in order to properly interpret the starting data, detect anomalies, missing data or errors that could affect the quality of the subsequent processes and results. If you want to know more about this process, you can go to the Practical Guide of Introduction to Exploratory Data Analysis.
The next step is to generate the tables of preprocessed data that will be used to feed the map. To do so, we will transform the coordinate systems, modify and filter the information according to our needs.
The steps required in this data preprocessing, explained in the Notebook, are as follows:
- Installation and loading of libraries
- Loading datasets
- Exploratory Data Analysis (EDA)
- Preprocessing of datasets
During the preprocessing of the data tables, it is necessary to change the coordinate system since in the source datasets the ESTR89 (standard system used in the European Union) is used, while we will need them in the WGS84 (system used by Google My Maps among other geographical applications). How to make this coordinate change is explained in the Notebook. If you want to know more about coordinate types and systems, you can use the "Spatial Data Guide".
Once the preprocessing is finished, we will obtain the data tables "recreational_natural_parks.csv", "rural_accommodations_2stars.csv", "natural_park_shelters.csv", "observatories_natural_parks.csv", "viewpoints_natural_parks.csv", "park_houses.csv", "trees_natural_parks.csv" which include generic and common information fields such as: name, observations, geolocation,... together with specific information fields, which are defined in details in section "6.2 Personalization of the information to be displayed on the map".
You will be able to reproduce this analysis, as the source code is available in our GitHub account. The code can be provided through a document made on a Jupyter Notebook once loaded into the development environment can be easily run or modified. Due to informative nature of this post and to favor understanding of non-specialized readers, the code is not intended to be the most efficient, but rather to facilitate its understanding so you could possibly come up with many ways to optimize the proposed code to achieve similar purposes. We encourage you to do so!
5. Data enrichment
To provide more related information, a data enrichment process is carried out on the dataset "hotel accommodation registration" explained below. With this step we will be able to automatically add complementary information that was initially not included. With this, we will be able to improve the user experience during their use of the map by providing context information related to each point of interest.
For this we will apply a useful tool for such kind of a tasks: OpenRefine. This open-source tool allows multiple data preprocessing actions, although this time we will use it to carry out an enrichment of our data by incorporating context by automatically linking information that resides in the popular Wikidata knowledge repository.
Once the tool is installed on our computer, when executed – a web application will open in the browser in case it is not opened automatically.
Here are the steps to follow.
Step 1
Loading the CSV into the system (Figure 1). In this case, the dataset "Hotel accommodation registration".
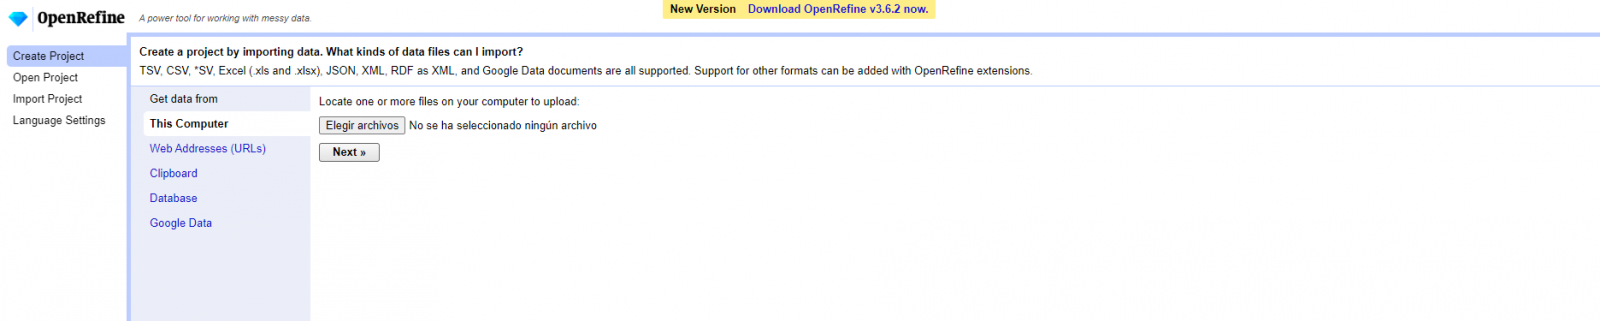
Figure 1. Uploading CSV file to OpenRefine
Step 2
Creation of the project from the uploaded CSV (Figure 2). OpenRefine is managed by projects (each uploaded CSV will be a project), which are saved on the computer where OpenRefine is running for possible later use. In this step we must assign a name to the project and some other data, such as the column separator, although the most common is that these last settings are filled automatically.
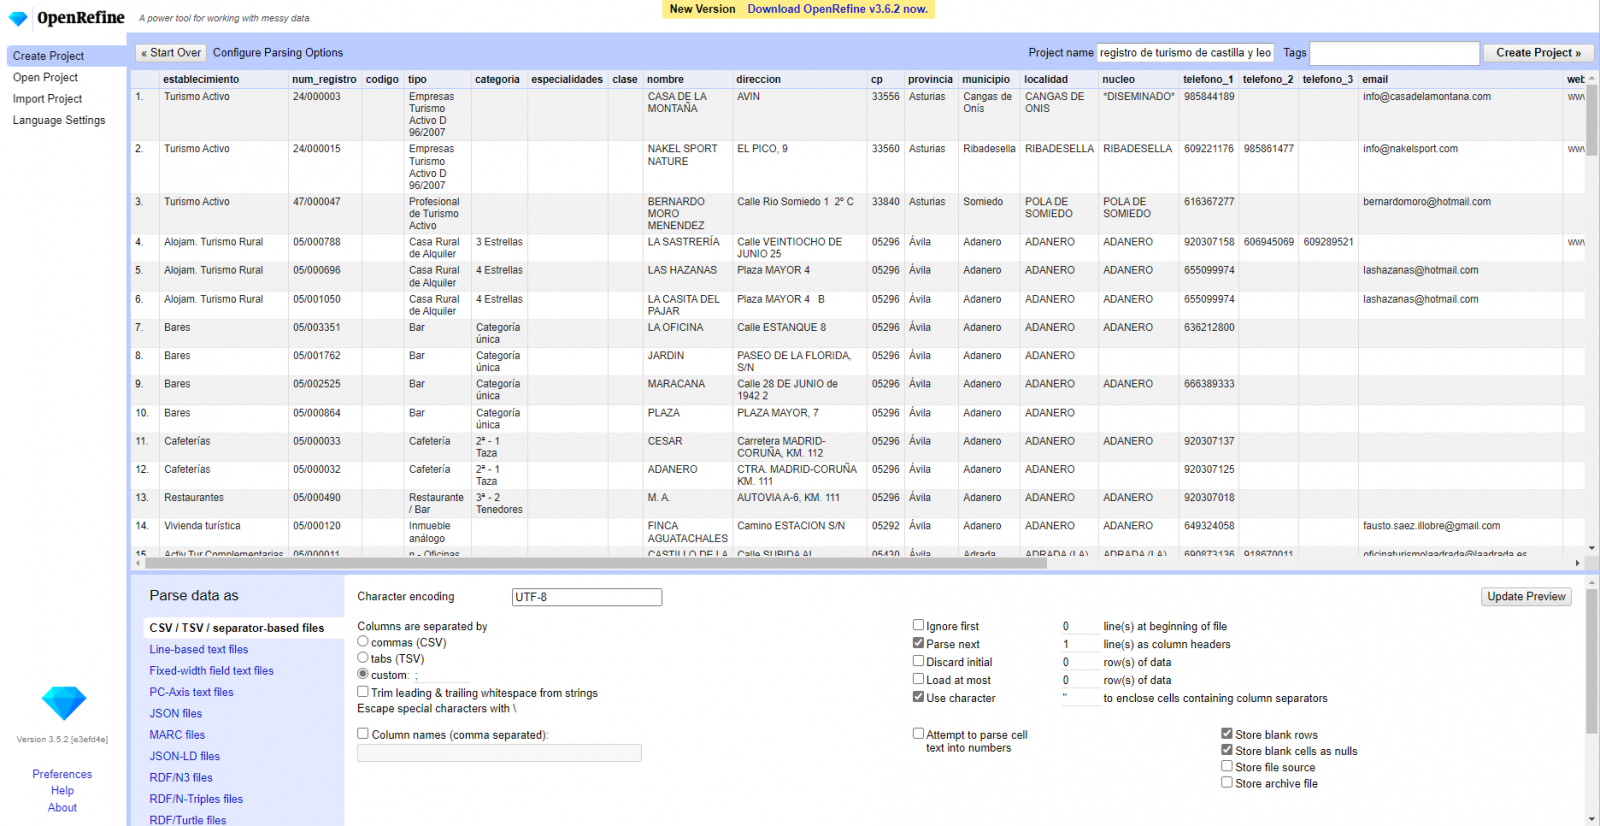
Figure 2. Creating a project in OpenRefine
Step 3
Linked (or reconciliation, using OpenRefine nomenclature) with external sources. OpenRefine allows us to link resources that we have in our CSV with external sources such as Wikidata. To do this, the following actions must be carried out:
- Identification of the columns to be linked. Usually, this step is based on the analyst experience and knowledge of the data that is represented in Wikidata. As a hint, generically you can reconcile or link columns that contain more global or general information such as country, streets, districts names etc., and you cannot link columns like geographical coordinates, numerical values or closed taxonomies (types of streets, for example). In this example, we have the column "municipalities" that contains the names of the Spanish municipalities.
- Beginning of reconciliation (Figure 3). We start the reconciliation and select the default source that will be available: Wikidata. After clicking Start Reconciling, it will automatically start searching for the most suitable Wikidata vocabulary class based on the values in our column.
- Obtaining the values of reconciliation. OpenRefine offers us an option of improving the reconciliation process by adding some features that allow us to conduct the enrichment of information with greater precision.
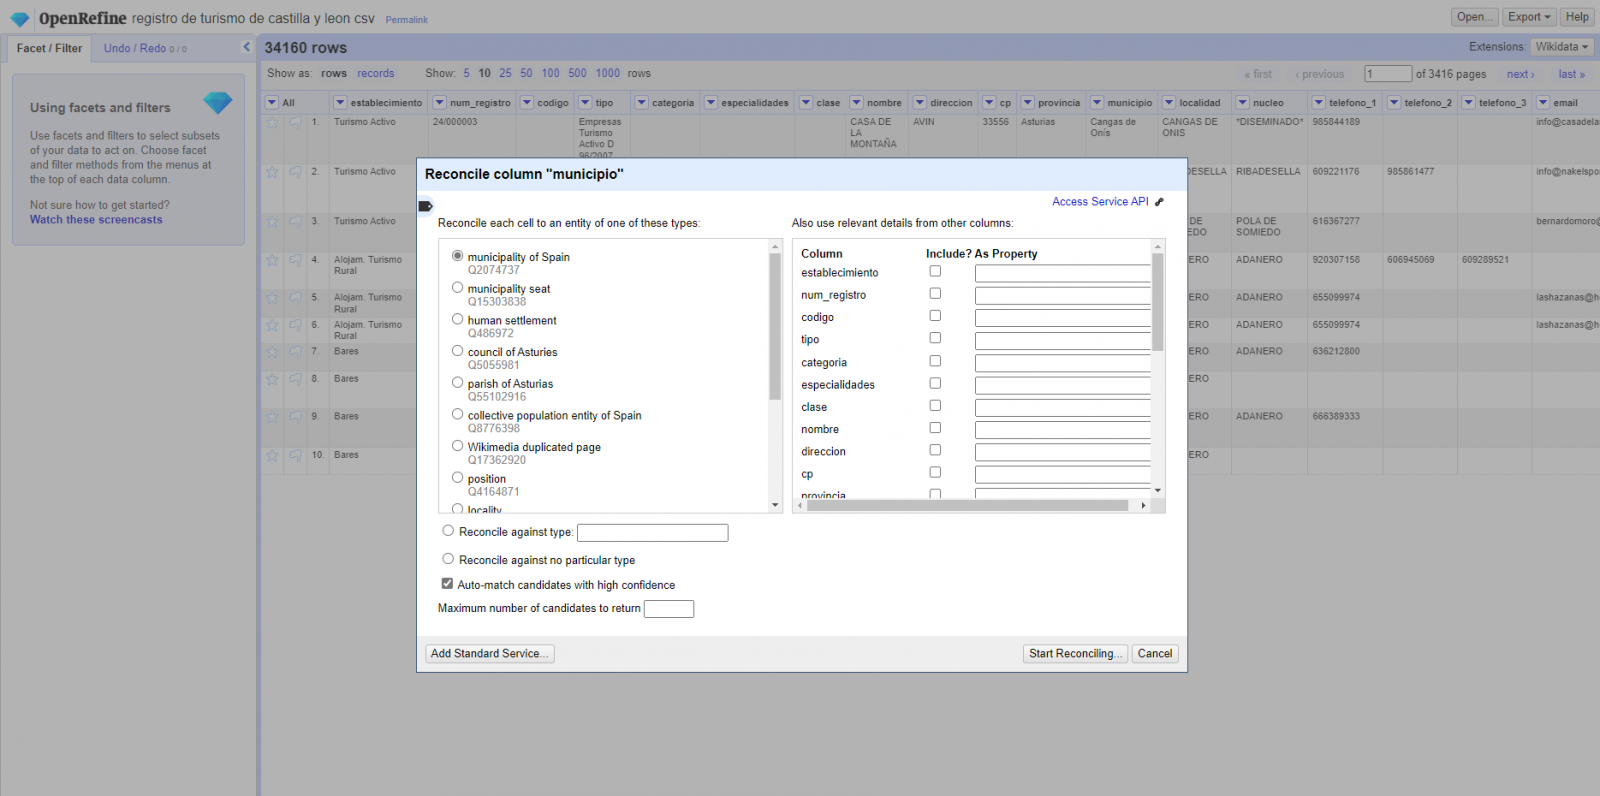
Figure 3. Selecting the class that best represents the values in the "municipality"
Step 4
Generate a new column with the reconciled or linked values (Figure 4). To do this we need to click on the column "municipality" and go to "Edit Column → Add column based in this column", where a text will be displayed in which we will need to indicate the name of the new column (in this example it could be "wikidata"). In the expression box we must indicate: "http://www.wikidata.org/ entity/"+cell.recon.match.id and the values appear as previewed in the Figure. "http://www.wikidata.org/entity/" is a fixed text string to represent Wikidata entities, while the reconciled value of each of the values is obtained through the cell.recon.match.id statement, that is, cell.recon.match.id("Adanero") = Q1404668
Thanks to the abovementioned operation, a new column will be generated with those values. In order to verify that it has been executed correctly, we click on one of the cells in the new column which should redirect to the Wikidata webpage with reconciled value information.
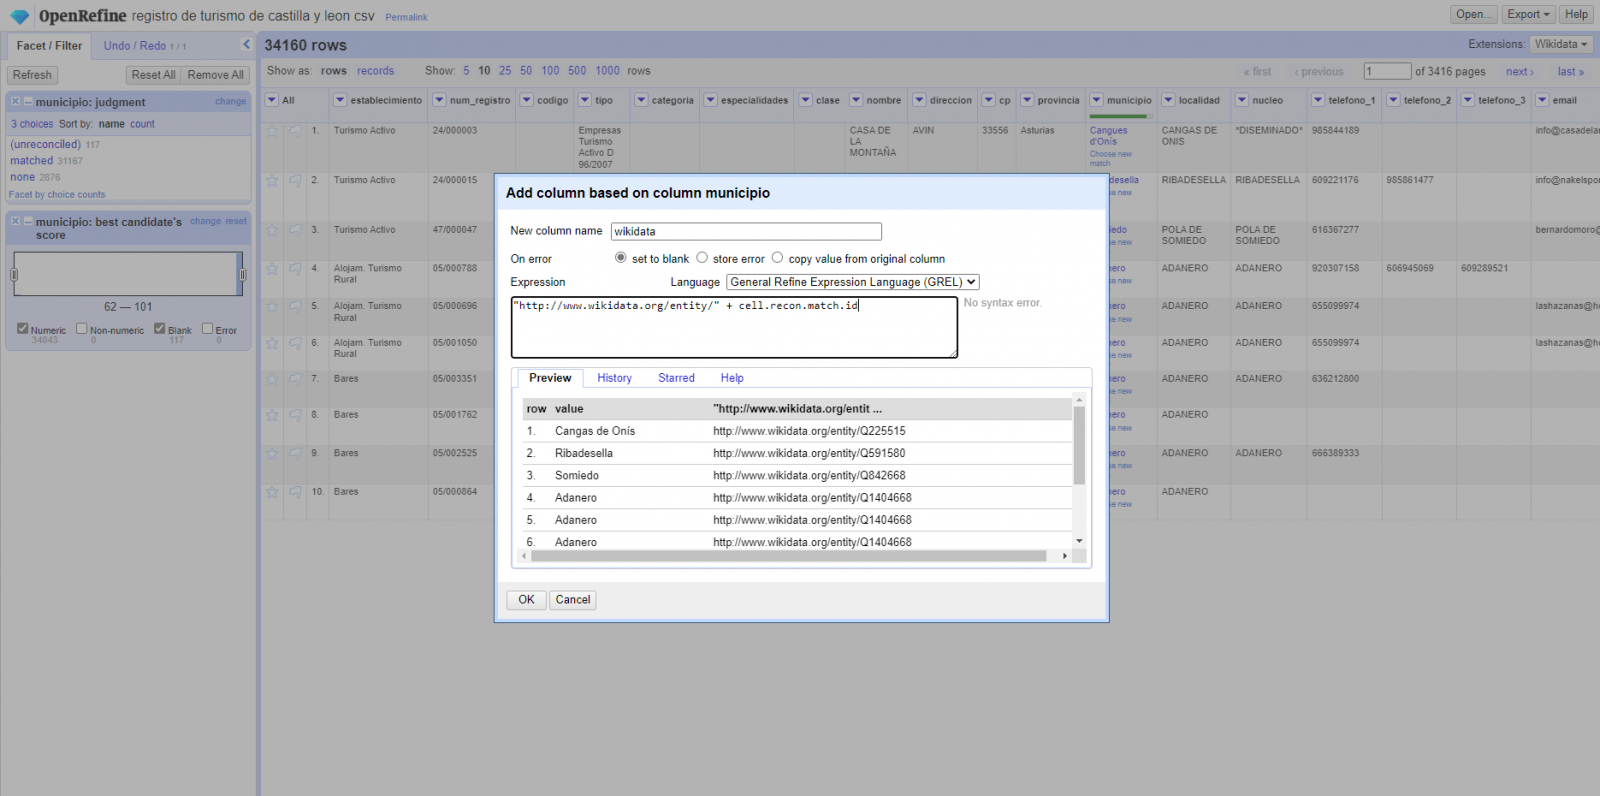
Figure 4. Generating a new column with reconciled values
Step 5
We repeat the process by changing in step 4 the "Edit Column → Add column based in this column" with "Add columns from reconciled values" (Figure 5). In this way, we can choose the property of the reconciled column.
In this exercise we have chosen the "image" property with identifier P18 and the "population" property with identifier P1082. Nevertheless, we could add all the properties that we consider useful, such as the number of inhabitants, the list of monuments of interest, etc. It should be mentioned that just as we enrich data with Wikidata, we can do so with other reconciliation services.
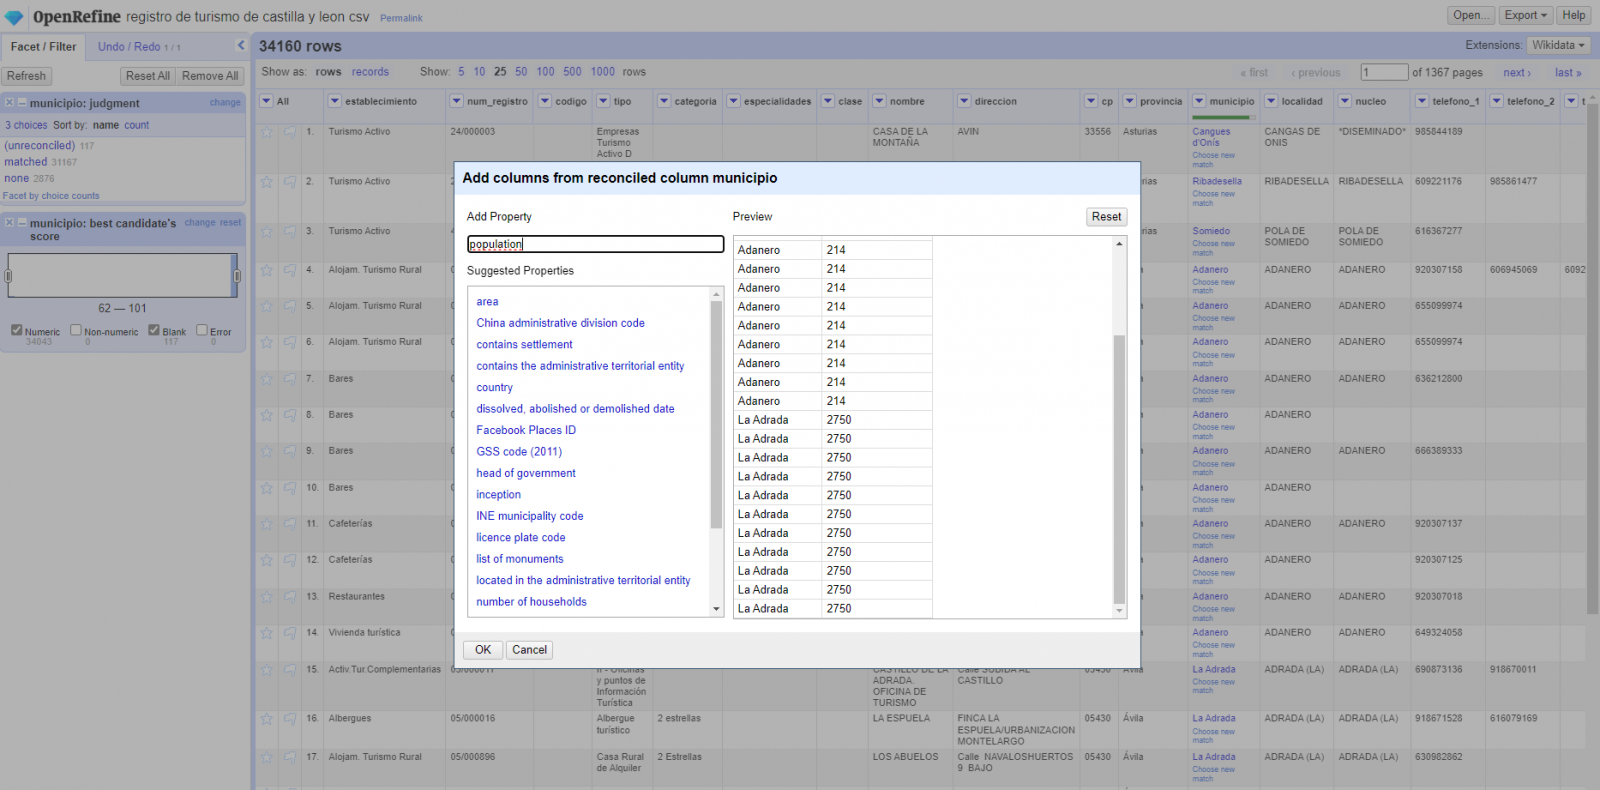
Figura 5. Choice of property for reconciliation
In the case of the "image" property, due to the display, we want the value of the cells to be in the form of a link, so we have made several adjustments. These adjustments have been the generation of several columns according to the reconciled values, adequacy of the columns through commands in GREL language (OpenRefine''s own language) and union of the different values of both columns. You can check these settings and more techniques to improve your handling of OpenRefine and adapt it to your needs in the following User Manual.
6. Map visualization
6.1 Map generation with "Google My Maps"
To generate the custom map using the My Maps tool, we have to execute the following steps:
- We log in with a Google account and go to "Google My Maps", with free access with no need to download any kind of software.
- We import the preprocessed data tables, one for each new layer we add to the map. Google My Maps allows you to import CSV, XLSX, KML and GPX files (Figure 6), which should include associated geographic information. To perform this step, you must first create a new layer from the side options menu.
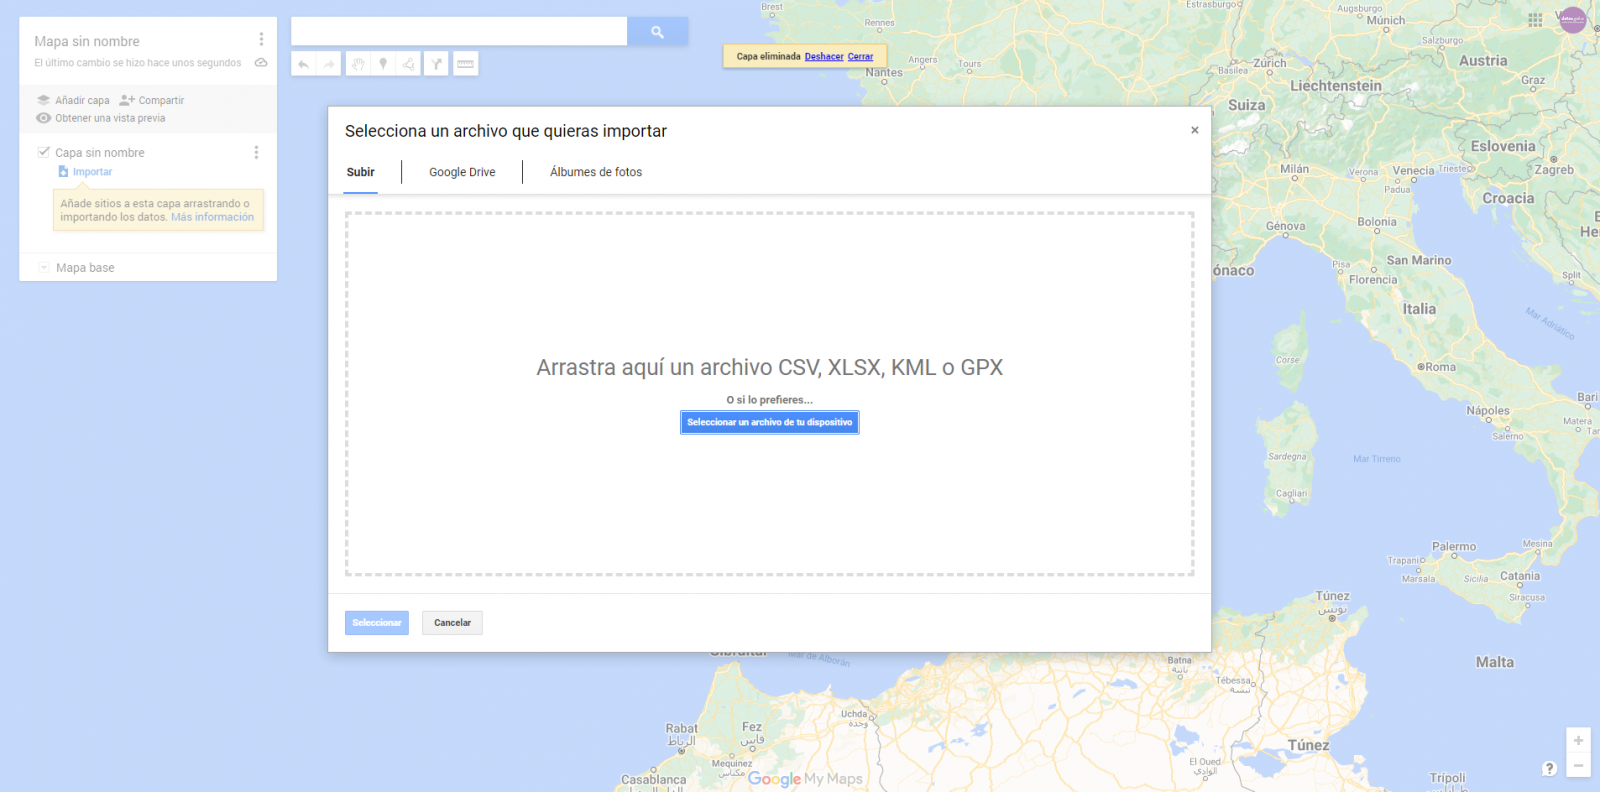
Figure 6. Importing files into "Google My Maps"
- In this case study, we''ll import preprocessed data tables that contain one variable with latitude and other with longitude. This geographic information will be automatically recognized. My Maps also recognizes addresses, postal codes, countries, ...
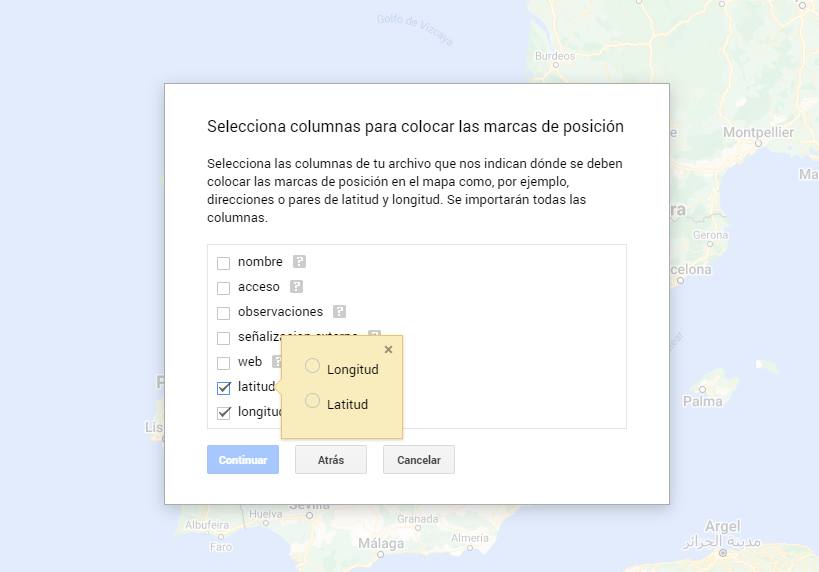
Figura 7. Select columns with placement values
- With the edit style option in the left side menu, in each of the layers, we can customize the pins, editing their color and shape.

Figure 8. Position pin editing
- Finally, we can choose the basemap that we want to display at the bottom of the options sidebar.
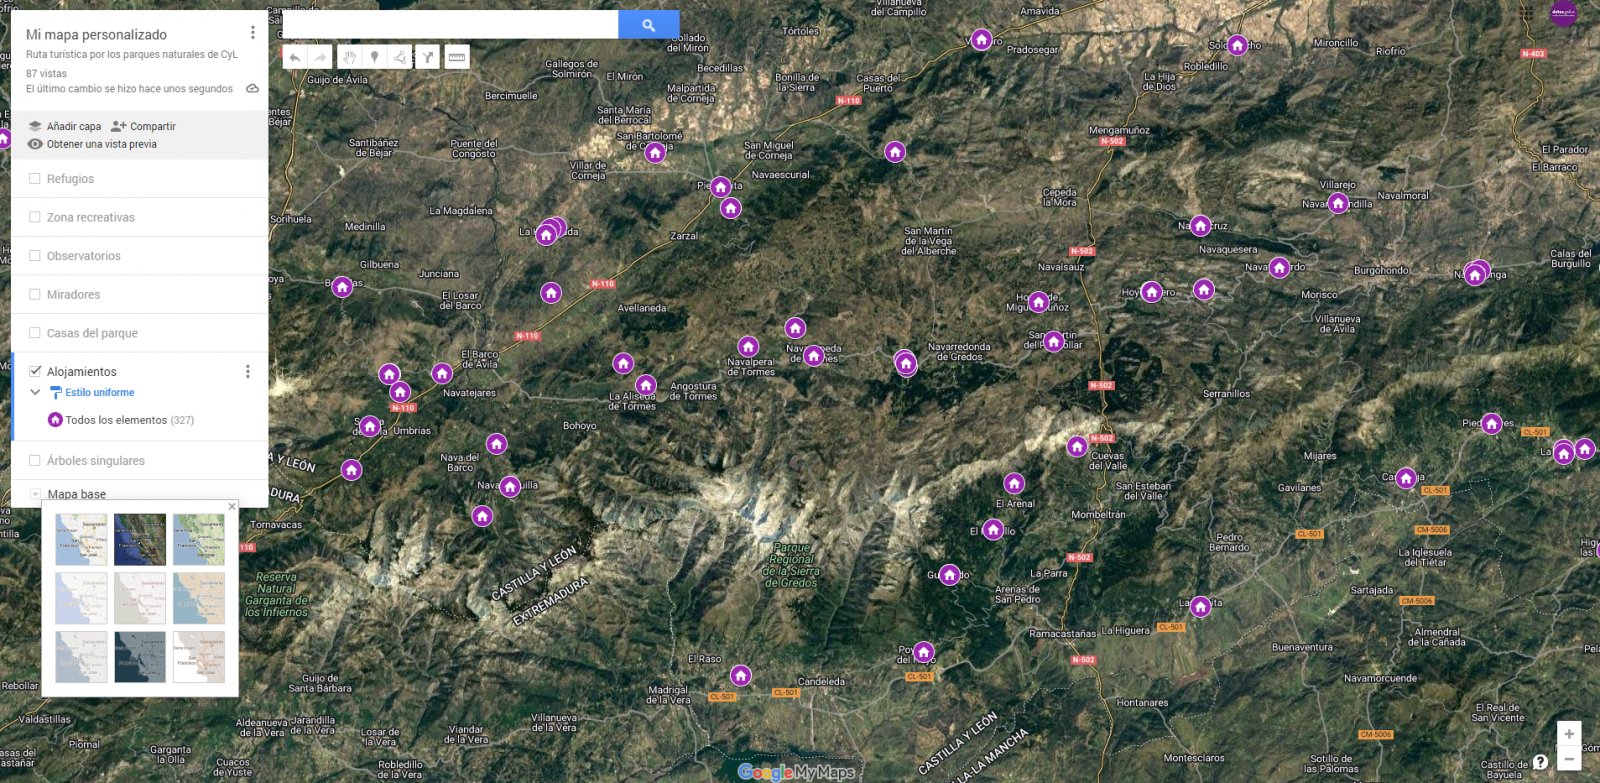
Figura 9. Basemap selection
If you want to know more about the steps for generating maps with "Google My Maps", check out the following step-by-step tutorial.
6.2 Personalization of the information to be displayed on the map
During the preprocessing of the data tables, we have filtered the information according to the focus of the exercise, which is the generation of a map to make tourist routes through the natural spaces of Castile and León. The following describes the customization of the information that we have carried out for each of the datasets.
- In the dataset belonging to the singular trees of the natural areas, the information to be displayed for each record is the name, observations, signage and position (latitude / longitude)
- In the set of data belonging to the houses of the natural areas park, the information to be displayed for each record is the name, observations, signage, access, web and position (latitude / longitude)
- In the set of data belonging to the viewpoints of the natural areas, the information to be displayed for each record is the name, observations, signage, access and position (latitude / longitude)
- In the dataset belonging to the observatories of natural areas, the information to be displayed for each record is the name, observations, signaling and position (latitude / longitude)
- In the dataset belonging to the shelters of the natural areas, the information to be displayed for each record is the name, observations, signage, access and position (latitude / longitude). Since shelters can be in very different states and that some records do not offer information in the "observations" field, we have decided to filter to display only those that have information in that field.
- In the set of data belonging to the recreational areas of the natural park, the information to be displayed for each record is the name, observations, signage, access and position (latitude / longitude). We have decided to filter only those that have information in the "observations" and "access" fields.
- In the set of data belonging to the accommodations, the information to be displayed for each record is the name, type of establishment, category, municipality, web, telephone and position (latitude / longitude). We have filtered the "type" of establishment only those that are categorized as rural tourism accommodations and those that have 2 stars.
Following a visualization of the custom map we have created is returned. By selecting the icon to enlarge the map that appears in the upper right corner, you can access its full-screen display
6.3 Map functionalities (layers, pins, routes and immersive 3D view)
At this point, once the custom map is created, we will explain various functionalities offered by "Google My Maps" during the visualization of the data.
- Layers
Using the drop-down menu on the left, we can activate and deactivate the layers to be displayed according to our needs.
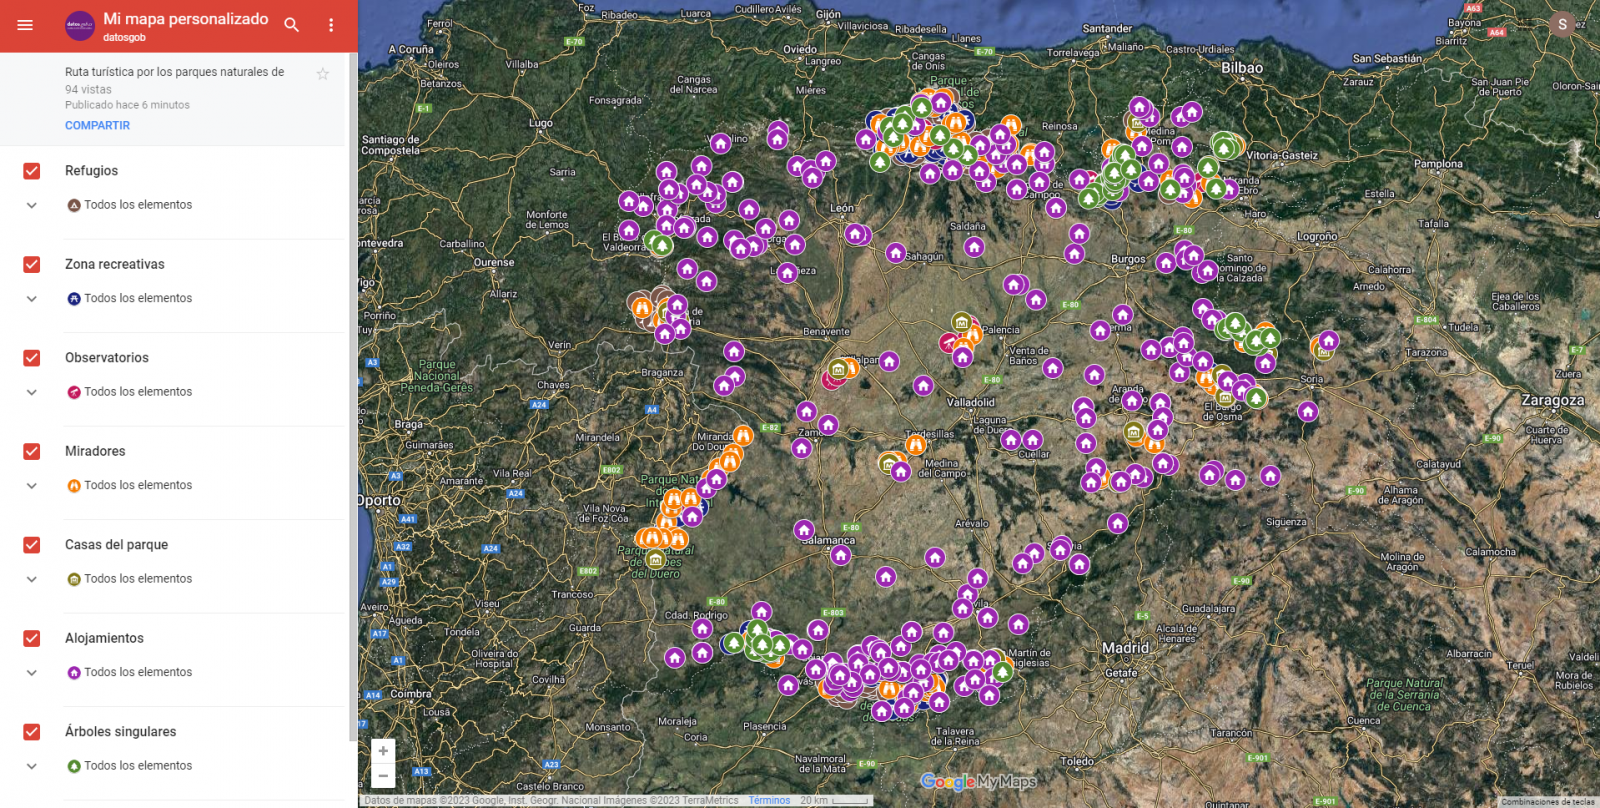
Figure 10. Layers in "My Maps"
-
Pins
By clicking on each of the pins of the map we can access the information associated with that geographical position.
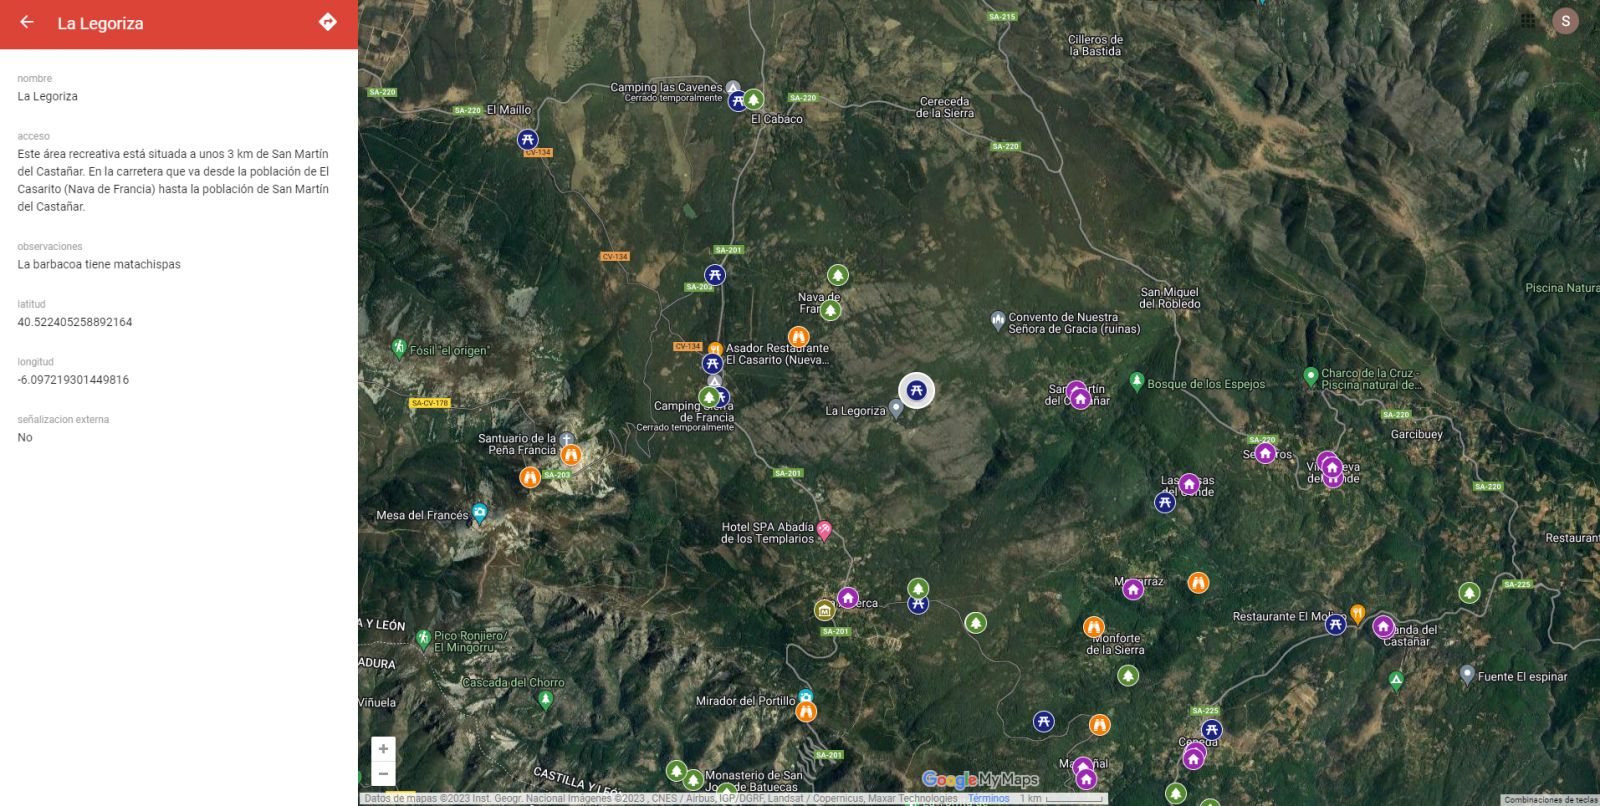
Figure 11. Pins in "My Maps"
-
Routes
We can create a copy of the map on which to add our personalized tours.
In the options of the left side menu select "copy map". Once the map is copied, using the add directions symbol, located below the search bar, we will generate a new layer. To this layer we can indicate two or more points, next to the means of transport and it will create the route next to the route indications.

Figure 12. Routes in "My Maps"
-
3D immersive map
Through the options symbol that appears in the side menu, we can access Google Earth, from where we can explore the immersive map in 3D, highlighting the ability to observe the altitude of the different points of interest. You can also access through the following link.
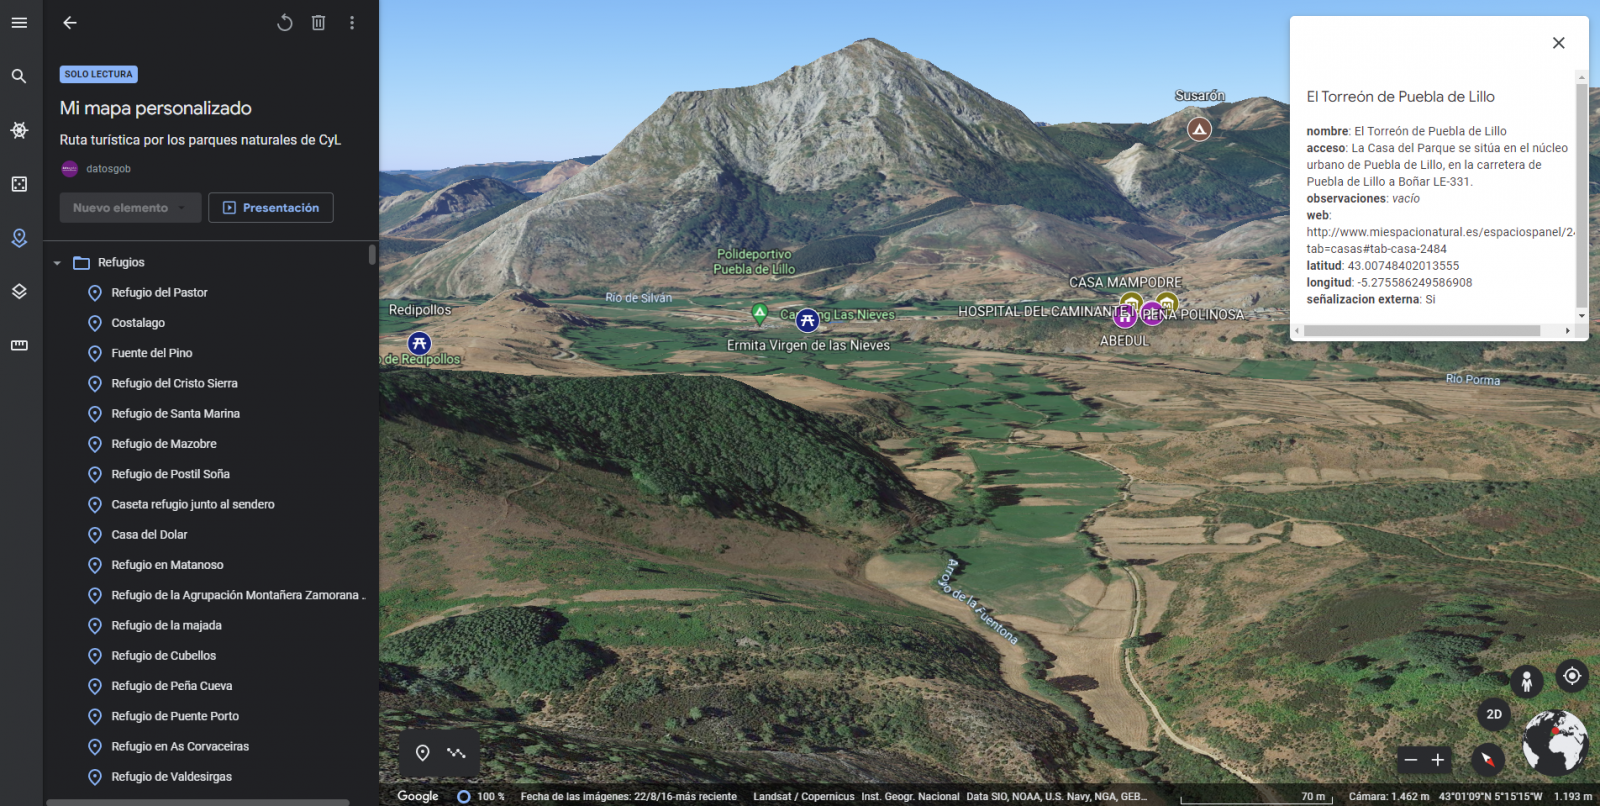
Figure 13. 3D immersive view
7. Conclusions of the exercise
Data visualization is one of the most powerful mechanisms for exploiting and analyzing the implicit meaning of data. It is worth highlighting the vital importance that geographical data have in the tourism sector, which we have been able to verify in this exercise.
As a result, we have developed an interactive map with information provided by Linked Data, which we have customized according to our interests.
We hope that this step-by-step visualization has been useful for learning some very common techniques in the treatment and representation of open data. We will be back to show you new reuses. See you soon!
Blog
Public administration is working to ensure access to open data, in order to empowering citizens in their right to information. Aligned with this objective, the European open data portal (data.europa.eu) references a large volume of data on a variety of topics.
However, although the data belong to different information domains or are in different formats, it is complex to exploit them together to maximise their value. One way to achieve this is through the use of RDF (Resource Description Framework), a data model that enables semantic interoperability of data on the web, standardised by the W3C, and highlighted in the FAIR principles. RDF occupies one of the top levels of the five-star schema for open data publishing, proposed by Tim Berners-Lee, the father of the web.
In RDF, data and metadata are automatically interconnected, generating a network of Linked Open Data (LOD) by providing the necessary semantic context through explicit relationships between data from different sources to facilitate their interconnection. This model maximises the exploitation potential of linked data.
It is a data sharing paradigm that is particularly relevant within the EU data space initiative explained in this post.
RDF offers great advantages to the community. However, in order to maximise the exploitation of linked open data it is necessary to know the SPARQL query language, a technical requirement that can hinder public access to the data.
An example of the use of RDF is the open data catalogues available on portals such as datos.gob.es or data.europa.eu that are developed following the DCAT standard, which is an RDF data model to facilitate their interconnection. These portals have interfaces to configure queries in SPARQL language and retrieve the metadata of the available datasets.
A new app to make interlinked data accessible: Vinalod.
Faced with this situation and with the aim of facilitating access to linked data, Teresa Barrueco, a data scientist and visualisation specialist who participated in the 2018 EU Datathon, the EU competition to promote the design of digital solutions and services related to open data, developed an application together with the European Publications Office.
The result is a tool for exploring LOD without having to be familiar with SPARQL syntax, called Vinalod: Visualisation and navigation of linked open data. The application, as its name suggests, allows you to navigate and visualise data structures in knowledge graphs that represent data objects linked to each other through the use of vocabularies that represent the existing relationships between them. Thus, through a visual and intuitive interaction, the user can access different data sources:
- EU Vocabularies. EU reference data containing, among others, information from Digital Europa Thesaurus, NUTS classification (hierarchical system to divide the economic territory of the EU) and controlled vocabularies from the Named Authority Lists.
- Who's Who in the EU. Official EU directory to identify the institutions that make up the structure of the European administration.
- EU Data. Sets and visualisations of data published on the EU open data portal that can be browsed according to origin and subject.
- EU publications. Reports published by the European Union classified according to their subject matter.
- EU legislation. EU Treaties and their classification.
The good news is that the BETA version of Vinalod is now available for use, an advance that allows for temporary filtering of datasets by country or language.
To test the tool, we tried searching for data catalogues published in Spanish, which have been modified in the last three months. The response of the tool is as follows:

And it can be interpreted as follows:

Therefore, the data.europa.eu portal hosts ("has catalog") several catalogues that meet the defined criteria: they are in Spanish language and have been published in the last three months. The user can drill down into each node ("to") and find out which datasets are published in each portal.
In the example above, we have explored the 'EU data' section. However, we could do a similar exercise with any of the other sections. These are: EU Vocabularies; Who's Who in the EU; EU Publications and EU Legislation.
All of these sections are interrelated, that means, a user can start by browsing the 'EU Facts', as in the example above, and end up in 'Who's Who in the EU' with the directory of European public officials.

As can be deduced from the above tests, browsing Vinalod is a practical exercise in itself that we encourage all users interested in the management, exploitation and reuse of open data to try out.
To this end, in this link we link the BETA version of the tool that contributes to making open data more accessible without the need to know SPARQL, which means that anyone with minimal technical knowledge can work with the linked open data.
This is a valuable contribution to the community of developers and reusers of open data because it is a resource that can be accessed by any user profile, regardless of their technical background. In short, Vinalod is a tool that empowers citizens, respects their right to information and contributes to the further opening of open data.
Entrevista
Publishing open data following the best practices of linked data allows to boost its reuse. Data and metadata are described using RDF standards that allow representing relationships between entities, properties and values. In this way, datasets are interconnected with each other, regardless of the digital repository where they are located, which facilitates their contextualization and exploitation.
If there is a field where this type of data is especially valued, it is research. It is therefore not surprising that more and more universities are beginning to use this technology. This is the case of the University of Extremadura (UEX), which has a research portal that automatically compiles the scientific production linked to the institution. Adolfo Lozano, Director of the Office of Transparency and Open Data at the University of Extremadura and collaborator in the preparation of the "Practical guide for the publication of linked data in RDF", tells us how this project was launched.
Full interview:
1. The research portal of the University of Extremadura is a pioneering initiative in our country. How did the project come about?
The research portal of the University of Extremadura has been launched about a year ago, and has had a magnificent reception among UEX researchers and external entities looking for the lines of work of our researchers.
But the UEX open data portal initiative started in 2015, applying the knowledge of our research group Quercus of the University of Extremadura on semantic representation, and with the experience we had in the open data portal of the City Council of Cáceres. The biggest boost came about 3 years ago when the Vice-Rectorate for Digital Transformation created the UEX Office of Transparency and Open Data.
From the beginning, we were clear that we wanted a portal with quality data, with the highest level of reusability, and where international standards would be applied. Although it was a considerable effort to publish all the datasets using ontological schemas, always representing the data in RDF, and linking the resources as usual practice, we can say that in the medium term the benefits of organizing the information in this way gives us great potential to extract and manage the information for multiple purposes.
We wanted a portal with quality data, with the highest level of reusability, and where international standards. [...] it was a considerable effort to publish all the datasets using ontological schemas, always representing the data in RDF, and linking the resources.
2. One of the first steps in a project of this type is to select vocabularies, that allow conceptualizing and establishing semantic relationships between data. Did you have a good starting point or did you need to develop a vocabulary ex-profeso for this context? Does the availability of reference vocabularies constitute a brake on the development of data interoperability?
One of the first steps in following ontology schemas in an open data portal is to identify the most appropriate terms to represent the classes, attributes and relationships that will configure the datasets. And it is also a practice that continues as new datasets are incorporated.
In our case, we have tried to reuse the most extended vocabularies as possible such as foaf, schema, dublin core and also some specific ones such as vibo or bibo. But in many cases we have had to define our own terms in our ontology because those components did not exist. In our opinion, when the CRUE-TIC Hercules project would be operational and the generic ontology schemas for universities would be defined, it will greatly improve the interoperability between our data, and above all it will encourage other universities to create their open data portals with these models.
One of the first steps in following ontology schemas in an open data portal is to identify the most appropriate terms to represent the classes, attributes and relationships that will configure the datasets.
3. How did you approach the development of this initiative, what difficulties did you encounter and what profiles are necessary to carry out a project of this type?
In our opinion, if you want to make a portal that is useful in the medium term, it is clear that an initial effort is required to organize the information. Perhaps the most complicated thing at the beginning is to collect the data that are scattered in different services of the University in multiple formats, understand what they consist of, find the best way to represent them, and then coordinate how to access them periodically for updates.
In our case, we have developed specific scripts for different data source formats, from different UEX Services (such as the IT Service, the Transfer Service, or from external publication servers) and that transform them into RDF representation. In this sense, it is essential to have Computer Engineers specialized in semantic representation and with extensive knowledge of RDF and SPARQL. In addition, of course, different services of the University must be involved to coordinate this information maintenance.
4. How do you assess the impact of the initiative? Can you tell us with some success stories of reuse of the provided datasets?
From the logs of queries, especially to the research portal, we see that many researchers use the portal as a data collection point that they use to prepare their resumes. In addition, we know that companies that need some specific development, use the portal to obtain the profile of our researchers.
But, on the other hand, it is common that some users (inside and outside the UEX) ask us for specific queries to the portal data. And curiously, in many cases, it is the University's own services that provide us with the data that ask us for specific lists or graphs where they are linked and crossed with other datasets of the portal.
By having the data linked, a UEX professor is linked to the subject he/she teaches, the area of knowledge, the department, the center, but also to his/her research group, to each of his/her publications, the projects in which he/she participates, the patents, etc. The publications are linked to journals and these in turn with their impact indexes.
On the other hand, the subjects are linked to the degrees where they are taught, the centers, and we also have the number of students enrolled in each subject, and quality and user satisfaction indexes. In this way, complex queries and reports can be made by handling all this information together.
As use cases, for example, we can mention that the Word documents of the 140 quality commissions of the degrees are automatically generated (including annual evolution graphs and lists) by means of queries to the opendata portal. This has saved dozens of hours of joint work for the members of these commissions.
Another example, which we have completed this year, is the annual research report, which has also been generated automatically through SPARQL queries. We are talking about more than 1,500 pages where all the scientific production and transfer of the UEX is exposed, grouped by research institutes, groups, centers and departments.
As use cases, for example, we can mention that the Word documents of the 140 quality commissions of the degrees are automatically generated (including annual evolution graphs and lists) by means of queries to the opendata portal. This has saved dozens of hours of joint work for the members of these commissions.
5. What are the future plans of the University of Extremadura in terms of open data?
Much remains to be done. For now we are addressing first of all those topics that we have considered to be most useful for the university community, such as scientific production and transfer, and academic information of the UEX. But in the near future we want to develop datasets and applications related to economic issues (such as public contracts, evolution of expenditure, hiring tables) and administrative issues (such as the teaching organization plan, organization chart of Services, compositions of governing bodies, etc.) to improve the transparency of the institution.
Noticia
The Cross-Forest project combines two areas of great interest to Europe, as set out in the Green Deal. On the one hand, the care and protection of the environment - in particular our forests-. On the other hand, the promotion of an interoperable European digital ecosystem.
The project started in 2018 and ended on 23 June, resulting in different tools and resources, as we will see below.
What is Cross-Forest?
Cross-Forest is a project co-funded by the European Commission through the CEF (Connecting Europe Facility) programme, which seeks to publish and combine open and linked datasets of forest inventories and forest maps, in order to promote models that facilitate forest management and protection.
The project has been carried out by a consortium formed by the Tragsa Public Group, the University of Valladolid and Scayle Supercomputacion of Castilla y León, with the institutional support of the Ministry for Ecological Transition and the Demographic Challenge (MITECO, in Spanish acronyms). On the Portuguese side, the Direção-Geral do Território of Portugal has participated.
The project has developed:
- A Digital Services Infrastructure (DSI) for open forest data, oriented towards modelling forest evolution at country level, as well as predicting forest fire behaviour and spread. Data on fuel materials, forest maps and spread models have been used. High Performance Computing (HPC) resources have been used for their execution, due to the complexity of the models and the need for numerous simulations.
- An ontological model of forest data common to public administrations and academic institutions in Portugal and Spain, for the publication of linked open data. Specifically, a set of eleven ontologies has been created. These ontologies, which are aligned with the INSPIRE Directive, interrelate with each other and are enriched by linking to external ontologies. Although they have been created with a focus on these two countries, the idea is that any other territory can use them to publish their forest data, in an open and standard format.
The different datasets used in the project are published separately, so that users can use the ones they want. All the data, which are published under CC BY 4.0 licence, can be accessed through this Cross-Forest Github repository and the IEPNB Data Catalogue.
4 flagship projects in Linked Open Data format
Thanks to Cross-Forest, a large part of the information of 4 flagship projects of the General Directorate of Biodiversity, Forests and Desertification of the Ministry for Ecological Transition and the Demographic Challenge has been published in linked open data format:
- National Forest Inventory (IFN-3). It includes more than 100 indicators of the state and evolution of the forests. These indicators range from their surface area or the tree and shrub species that inhabit them, to data related to regeneration and biodiversity. It also incorporates the value in monetary terms of the environmental, recreational and productive aspects of forest systems, among other aspects. It has more than 90,000 plots. Two databases corresponding to a subset of the NFI indicators have been published openly.
- Forest Map of Spain (Scale 1:50.000). It consists of the mapping of the situation of forest stands, following a conceptual model of hierarchical land uses.
- National Soil Erosion Inventory (INES). This is a study that detects, quantifies and cartographically reflects the main erosion processes affecting the Spanish territory, both forest and agricultural. Its objective is to know its evolution over time thanks to continuous data collection and it has more than 20,000 plots.
- General Forest Fire Statistics. It includes the information collected in the Fire Reports that are completed by the Autonomous Communities for each of the forest fires that take place in Spain.
These datasets, along with others from this Ministry, have been federated with datos.gob.es, so that they are also available through our data catalogue. Like any other dataset that is published on datos.gob.es, they will automatically be federated with the European portal as well.
The predecessor of this project was CrossNature. This project resulted in the Eidos database, which includes linked data on wild species of fauna and flora in Spain and Portugal. It is also available on datos.gob.es and is reflected in the European portal.
Both projects are an example of innovation and collaboration between countries, with the aim of achieving more harmonised and interoperable data, facilitating to compare indicators and improve actions, in this case, in the field of forest protection.
Blog
The Hercules initiative was launched in November 2017, through an agreement between the University of Murcia and the Ministry of Economy, Industry and Competitiveness, with the aim of developing a Research Management System (RMS) based on semantic open data that offers a global view of the research data of the Spanish University System (SUE), to improve management, analysis and possible synergies between universities and the general public.
This initiative is complementary to UniversiDATA, where several Spanish universities collaborate to promote open data in the higher education sector by publishing datasets through standardised and common criteria. Specifically, a Common Core is defined with 42 dataset specifications, of which 12 have been published for version 1.0. Hercules, on the other hand, is a research-specific initiative, structured around three pillars:
- Innovative SGI prototype
- Unified knowledge graph (ASIO) 1],
- Data Enrichment and Semantic Analysis (EDMA)
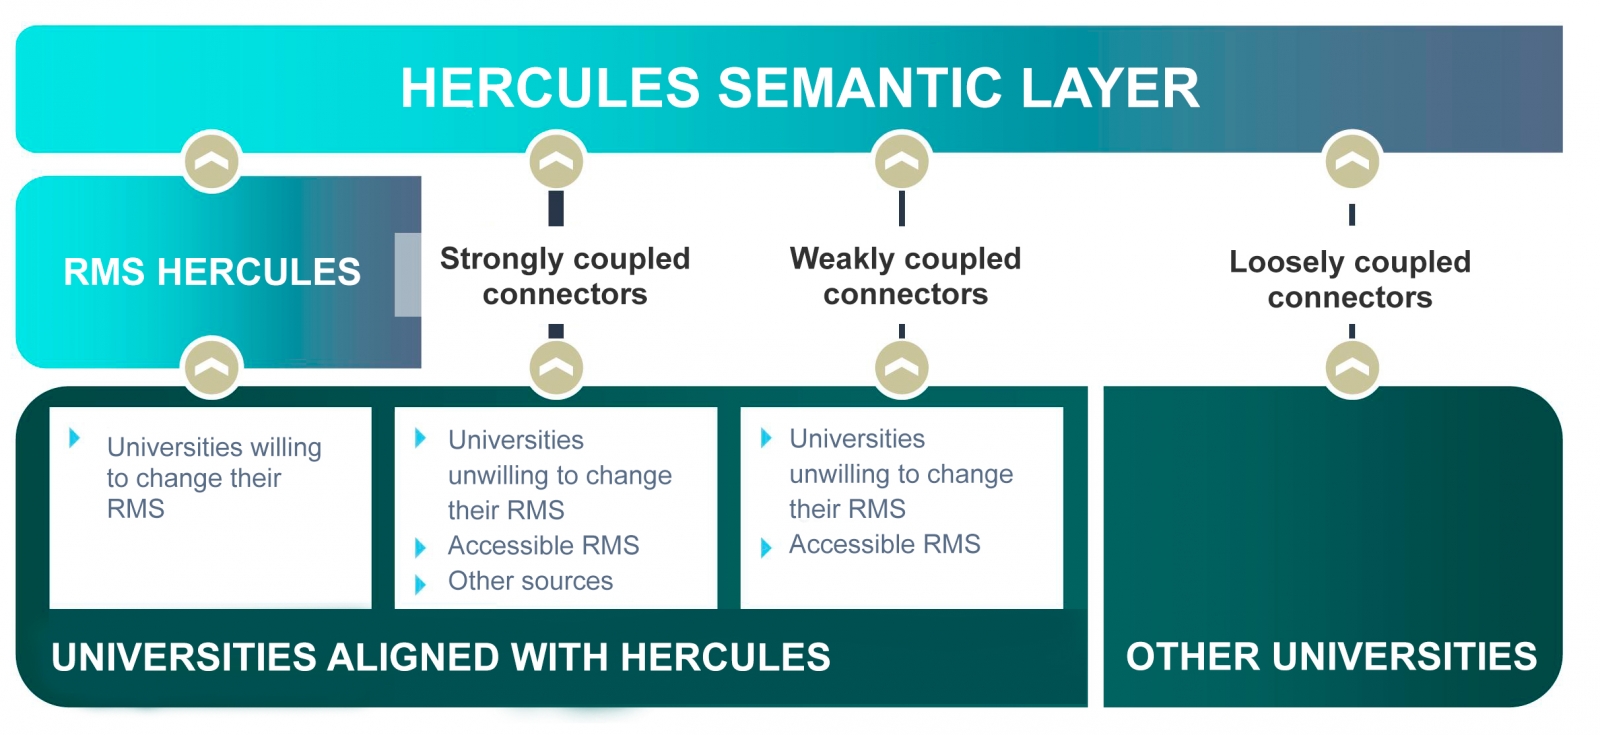
The ultimate goal is the publication of a unified knowledge graph integrating all research data that participating universities wish to make public. Hercules foresees the integration of universities at different levels, depending on their willingness to replace their RMS with the Hercules RMS. In the case of external RMSs, the degree of accessibility they offer will also have an impact on the volume of data they can share through the unified network.
General organisation chart of the Hercule initiative
Within the Hercules initiative, the ASIO Project (Semantic Architecture and Ontology Infrastructure) is integrated. The purpose of this sub-project is to define an Ontology Network for Research Management (Ontology Infrastructure). An ontology is a formal definition that describes with fidelity and high granularity a particular domain of discussion. In this case, the research domain, which can be extrapolated to other Spanish and international universities (at the moment the pilot is being developed with the University of Murcia). In other words, the aim is to create a common data vocabulary.
Additionally, through the Semantic Data Architecture module, an efficient platform has been developed to store, manage and publish SUE research data, based on ontologies, with the capacity to synchronise instances installed in different universities, as well as the execution of distributed federated queries on key aspects of scientific production, lines of research, search for synergies, etc.
As a solution to this innovation challenge, two complementary lines have been proposed, one centralised (synchronisation in writing) and the other decentralised (synchronisation in consultation). The architecture of the decentralised solution is explained in detail in the following sections.
Domain Driven Design
The data model follows the Domain Driven Design approach, modelling common entities and vocabulary, which can be understood by both developers and domain experts. This model is independent of the database, the user interface and the development environment, resulting in a clean software architecture that can adapt to changes in the model.
This is achieved by using Shape Expressions (ShEx), a language for validating and describing RDF datasets, with human-readable syntax. From these expressions, the domain model is automatically generated and allows orchestrating a continuous integration (CI) process, as described in the following figure.
Continuous integration process using Domain Driven Design (just available in Spanish)
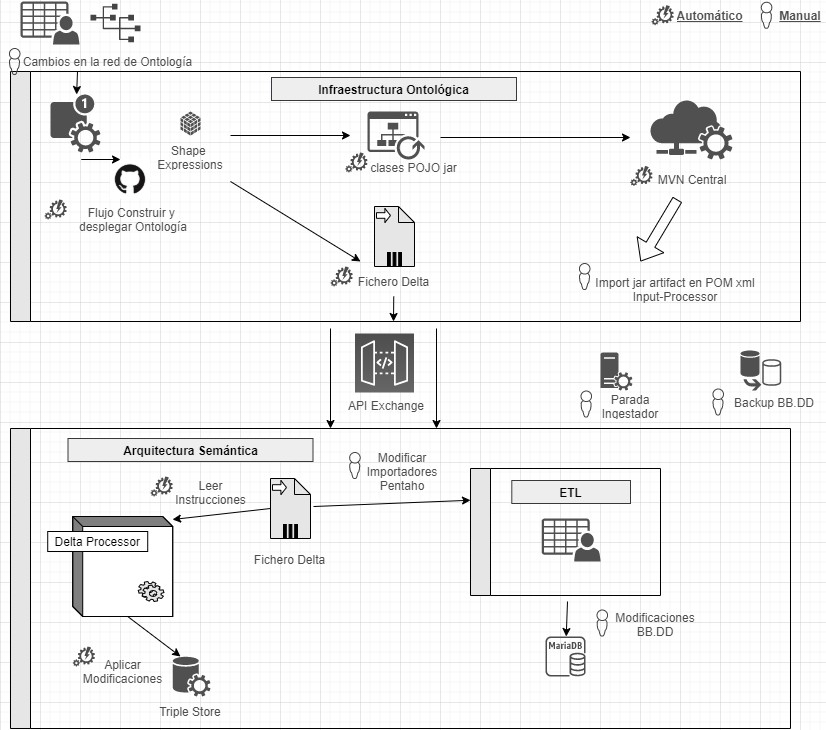
By means of a system based on version control as a central element, it offers the possibility for domain experts to build and visualise multilingual ontologies. These in turn rely on ontologies both from the research domain: VIVO, EuroCRIS/CERIF or Research Object, as well as general purpose ontologies for metadata tagging: Prov-O, DCAT, etc.
Linked Data Platform
The linked data server is the core of the architecture, in charge of rendering information about all entities. It does this by collecting HTTP requests from the outside and redirecting them to the corresponding services, applying content negotiation, which provides the best representation of a resource based on browser preferences for different media types, languages, characters and encoding.
All resources are published following a custom-designed persistent URI scheme. Each entity represented by a URI (researcher, project, university, etc.) has a series of actions to consult and update its data, following the patterns proposed by the Linked Data Platform (LDP) and the 5-star model.
This system also ensures compliance with the FAIR (Findable, Accessible, Interoperable, Reusable) principles and automatically publishes the results of applying these metrics to the data repository.
Open data publication
The data processing system is responsible for the conversion, integration and validation of third-party data, as well as the detection of duplicates, equivalences and relationships between entities. The data comes from various sources, mainly the Hercules unified RMS, but also from alternative RMSs, or from other sources offering data in FECYT/CVN (Standardised Curriculum Vitae), EuroCRIS/CERIF and other possible formats.
The import system converts all these sources to RDF format and registers them in a specific purpose repository for linked data, called Triple Store, because of its capacity to store subject-predicate-object triples.
Once imported, they are organised into a knowledge graph, easily accessible, allowing advanced searches and inferences to be made, enhanced by the relationships between concepts.
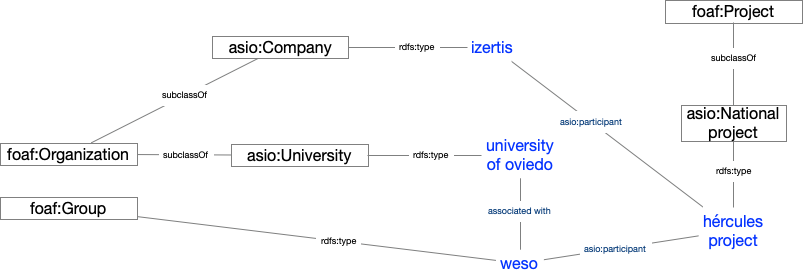
Example of a knowledge network describing the ASIO project
Results and conclusions
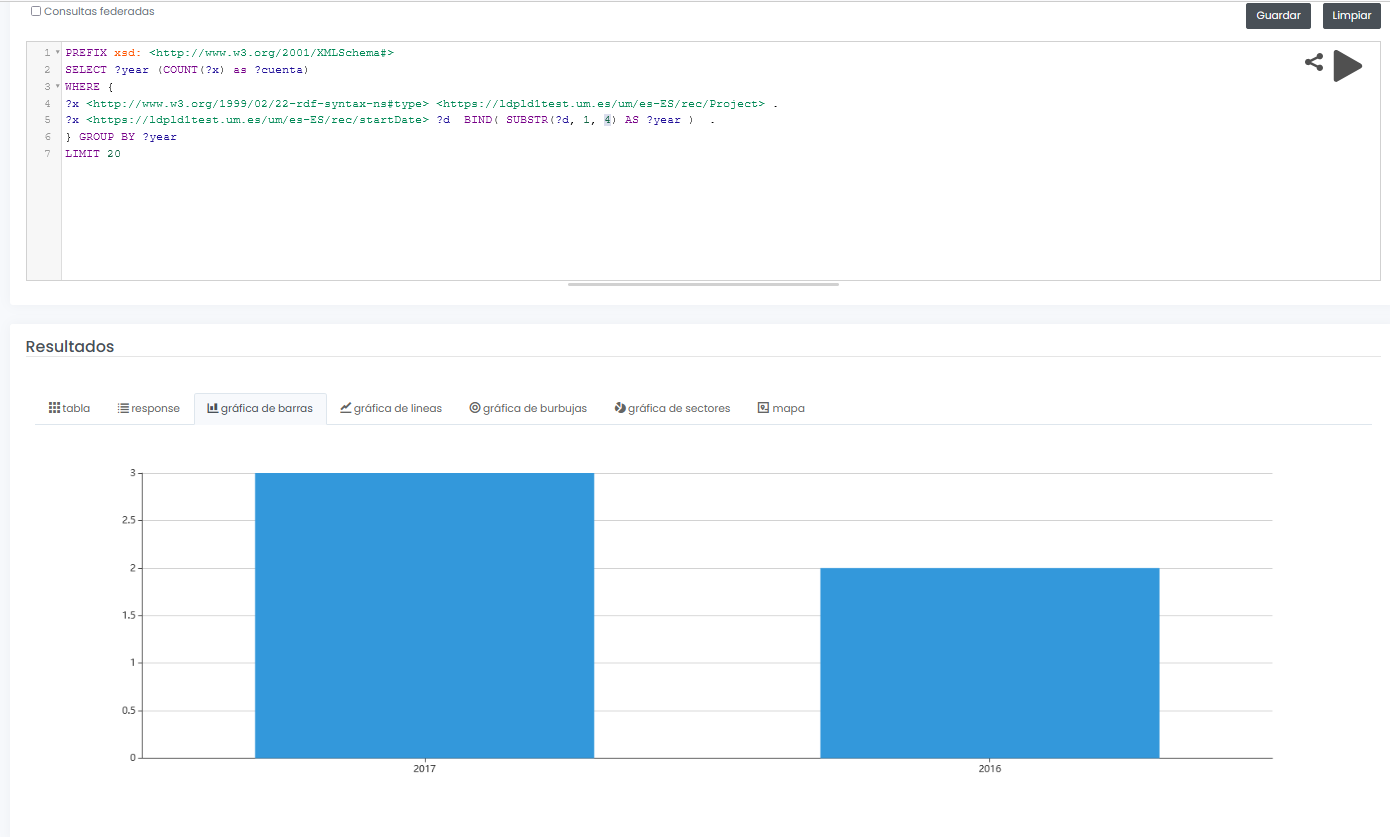
The final system not only allows to offer a graphical interface for interactive and visual querying of research data, but also to design SPARQL queries, such as the one shown below, even with the possibility to run the query in a federated way on all nodes of the Hercules network, and to display results dynamically in different types of graphs and maps.
In this example, a query is shown (with limited test data) of all available research projects grouped graphically by year:
PREFIX xsd: <http://www.w3.org/2001/XMLSchema#>
SELECT ?year (COUNT(?x) as ?cuenta)
WHERE {
?x <http://www.w3.org/1999/02/22-rdf-syntax-nes#type> <https://ldpld1test.um.es/um/es-ES/rec/Project> .
?x <https://ldpld1test.um.es/um/es-ES/rec/startDate> ?d BIND(SUBSTR(?d, 1, 4) as ?year) .
} GROUP BY ?year LIMIT 20
LIMIT 20
Ejemplo de consulta SPARQL con resultado gráfico
In short, ASIO offers a common framework for publishing linked open data, offered as open source and easily adaptable to other domains. For such adaptation, it would be enough to design a specific domain model, including the ontology and the import and validation processes discussed in this article.
Currently the project, in its two variants (centralised and decentralised), is in the process of being put into pre-production within the infrastructure of the University of Murcia, and will soon be publicly accessible.
[1 Graphs are a form of knowledge representation that allow concepts to be related through the integration of data sets, using semantic web techniques. In this way, the context of the data can be better understood, which facilitates the discovery of new knowledge.
Content prepared by Jose Barranquero, expert in Data Science and Quantum Computing.
The contents and views expressed in this publication are the sole responsibility of the author.
Documentación
A large number of different data sources with different contents and formats coexist in an open data portal. It is therefore necessary to provide each file, resource or content on the network with a context or definition that allows people, and also machines, to interpret its meaning. This is where the concept of Linked data comes in.
Linked Data allows the web to be used as a single large global database. Following this publishing paradigm, data is available in context and interconnected for reuse. Linked Data emerged from the Semantic Web project inspired by Tim Berners-Lee, the father of the Web, from the need to introduce contextual information in the form of metadata on the Web.
The document "LinkedData as an open data model" briefly explains the basic concepts to understand how the semantic web and linked data works, such as the case of URIs or unique resource identifiers, ontologies or vocabularies that allow the description of relationships between them, to focus on how Aragon has implemented these technologies to develop different services, such as:
- The Interoperable Information Structure (EI2A), an ontology that homogenises structures, vocabularies and characteristics to respond to the diversity and heterogeneity of existing data within the Administration, within the framework of Aragon Open Data. The document explains some of the ontologies and vocabularies used for the development.
- The European Legislation Identifier (ELI), which allows online access to legislation in a formalised format that facilitates its reuse.
- The semantic infrastructure in Aragon Open Data, where the use of the Virtuoso tool for the storage of linked data stands out. The document explains the characteristics of this universal server, whose architecture allows the persistence of data in RDF-XML formats, among others. In addition, it explains how the bank that stores triplets in a native way for resources relationships works and shows examples of services of Aragon Open data that exploit these triplets of data as Aragopedia and Aragon Open Data Pool.
You can then download the full document (only available in Spanish).
This document is part of the series of educational materials and technological articles that Aragón open Data is producing in order to explain how they have deployed different solutions to respond to the needs for location, access and reuse of the different sets of data. You can complete your reading with another volume in the series: "How to implement CKAN: real case of the Aragon Open Data portal".
Blog
One of the main barriers to the deployment of linked data is the difficulty that data editors have to determine which vocabularies to use to describe their semantics. These vocabularies provide the "semantic glue" that allows simple data to become "meaningful data".
Linked Open Vocabularies (LOV) is a catalog of vocabularies available for reuse with the aim of describing data on the Web. LOV collects metadata and makes visible indicators such as the connection among different vocabularies, version history, maintenance policies, together with past and current references (both to individuals and organizations). The name of this initiative (Linked Open Vocabularies - LOV) has its root in the term Linked Open Data - LOD.
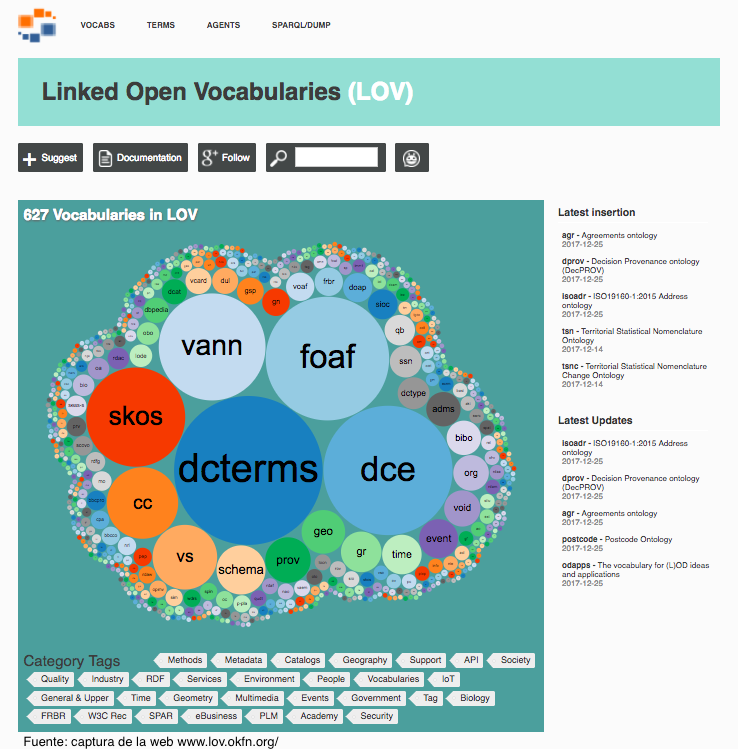
The main goal of LOV is helping the editors of linked data and vocabularies to evaluate the resources (vocabularies, classes, properties and agents) already available and thus promote the highest possible reuse, appart from providing a way for the publishers to add their own creations.
LOV began in 2011 under the Datalift research project and hosted by Open Knowledge International (formerly known as Open Knowledge Foundation). Currently the initiative has the support of a small team of data curators / reviewers and programmers.
To facilitate the reuse of well-documented vocabularies (with metadata), several ways to access the data are provided:
- Through a user interface, with a browsing environment and searches (the web page itself).
- Through a SPARQL endpoint to make queries to the knowledge graph.
- Through a API REST.
- By means of a data dump, both from the knowledge base of LOV (in Notation3 format), as well as from the knowledge base plus the vocabularies themselves (in N-Quads) format).
Currently, the registry identifies and lists:
- 621 vocabularies (RDF vocabularies -RDFS / OWL- defined as schemas (T-Box) for the description of Linked Data)
- About 60,000 terms (between classes and properties).
- Nearly 700 agents (creators, contributors or publishers, and both people and organizations)
Among all the vocabularies, 34 has a term in Spanish, which allows a wide field of work for the Spanish community.
LOV is a clear example of the importance of correctly documenting vocabularies with metadata. The value of metadata lies in its ability to classify and organize information in the most efficient way, providing greater intelligence and knowledge of superior quality, which facilitates and drives automation initiatives, review of compliance, collaboration, open data and much more .
Blog
An important part of the data which is published on the Semantic Web, where resources are identified by URIs, is stored within triple store databases. This data can only be accessed through SPARQL queries via a SPARQL endpoint.
Moreover, the URIs used, usually designed in a pattern, in most of the datasets which are stored in those databases are not dereferenced, meaning that requests made to that identifier are met with no response (an ‘error 404’ message).
Given the current situation, in which this data is only accessible by machines, and combined with the push of the Linked Data movement, various projects have emerged in which the main objective is to generate human views of the data through web interfaces (where the views of the resources are interlinked), as well as offering a service where the URIs are dereferenced.
Pubby is perhaps the best-known of the projects which have been created for this purpose. It is a Java developed web application, whose code is shared under the open source license Apache Version 2.0. It is designed to be deployed on a system that has SPARQL access to the database of triplets that you wish to apply.
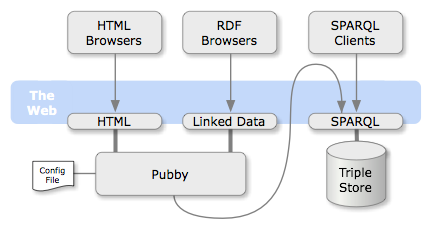
The non-dereferenced URIs and the dereferenced URIs are mapped through a configuration file which is managed by the Pubby server. The application uses this to process the requests to the mapped URIs, requesting the information of the original URI to the associated database (via a SPARQL ‘DESCRIBE’ query) and returning the results to the client in the requested format.
In addition, Pubby provides a simple HTML view of the stored data and manages content negotiation between the different representations. Users can navigate between the HTML views of the linked resources (Linked Data) via the web interface. These views show all the information of the resources, including their attributes and relationships with other resources.
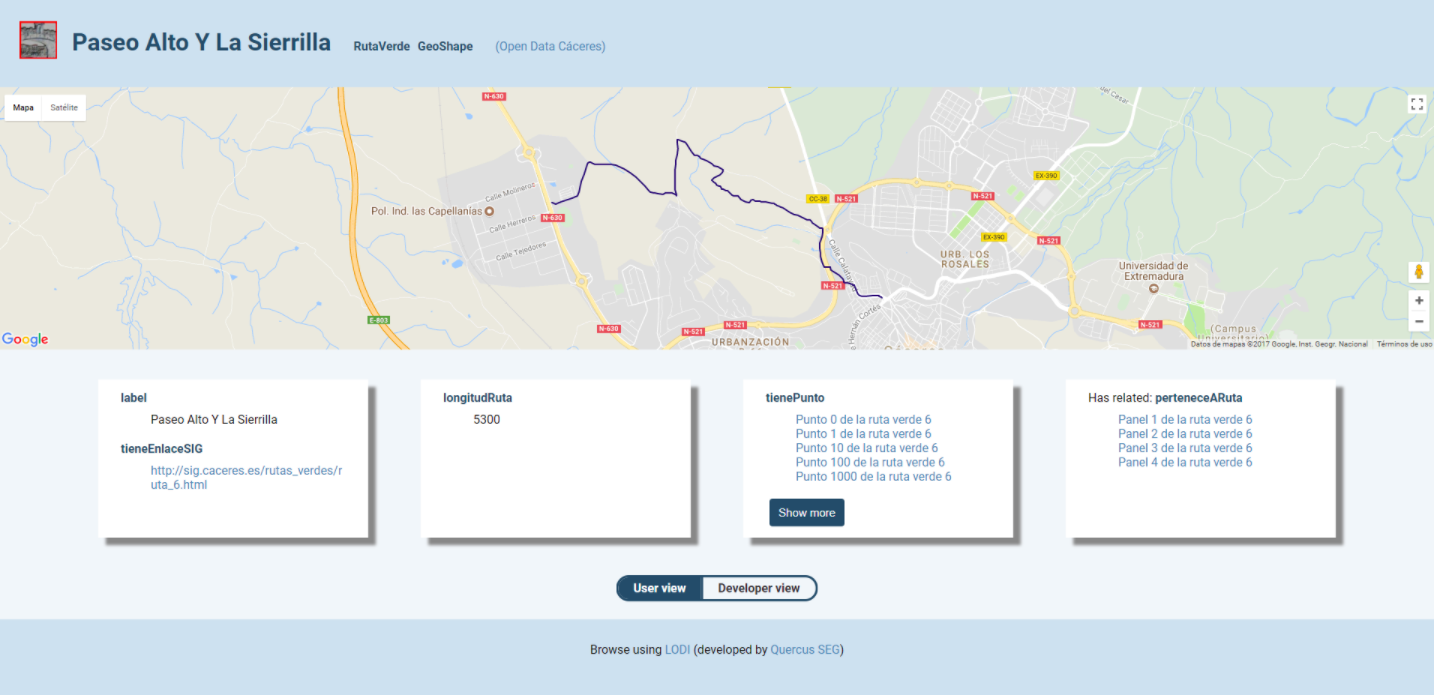
Multiple parallel projects (forks) and inspired projects have emerged from the Pubby project. One of the most recent is the Linked Open Data Inspector (LODI) project, developed by the Quercus software engineering group at the University of Extremadura under Creative Commons 3.0. This project is developed in Node.js and features some positive differences with respect to Pubby:
● It provides a simple HTML view for a general audience, and a more detailed view for programmers.
● It provides resource information in N3 format (but not RDF/XML or Turtle).
● In the case of resources with geospatial information, it displays a map detailing the location.
● In the case of detected images (.jpg, .jpeg or .png), these images are shown automatically.
There are currently two open data portals which are using LODI: Open Data Cáceres and Open Data UEx.
Pubby, LODI and other similar projects (such as LODDY), using the AGROVOC thesaurus, have managed to expose information that was retained within RDF databases which was not accessible to humans. Projects like these help the linked data web continue to grow, both in quantity and quality, putting human interaction at the centre of this progress.
Noticia
The Spanish National Library (BNE) continues promoting the dissemination and reuse of its documentary collections. In addition to contributing to the preservation of Spanish cultural heritage, through the digitization and digital preservation of its collections, the BNE also seeks to facilitate citizen access to cultural data, enrich it and encourage its reuse across all fields, beyond research, such as tourism, fashion or video games, among others.
Since launching the first version of its linked data portal, datos.bne.es, in 2014, BNE has opted to offer a new approach to the large amount of data that they generates: data related to the works they preserve but also to authors, vocabularies, geographical terms, etc. These data have a high level of standardization and meet the international standards of description and interoperability. The data are also identified through URIs and new conceptual models, linked through semantic technologies and offered in open and reusable formats.
In addition, datos.bne.es is a clear example of how the application of Linked Open Data techniques and standards facilitates the enrichment of data with other sources, becoming a tool and basis for research projects that incorporates big data or machine learning. This opens up numerous possibilities for searching and visualizing information (through graphs, georeferences, etc.). In short, datos.bne.es is the transit from a tool to locate copies to a tool to locate and use data, enriching and integrating the data into the Linked Open Data universe.
Since 2014, steps have been taken in this direction, seeking to bring the BNE data to citizens and reusers. For this, BNE has just launched a new version of datos.bne.es. This new version means, on the one hand, a complete data update, and on the other hand, new functionalities that facilitate access to information.
Among these developments, we can find:
- Incorporation of a new specialized search engine. From now on, users can carry out advanced searches related to works editions, as well as the people and entities that have taken part in their creation. In this way, authors can be searched based on their date and place of birth or death, their gender or profession. It is important to note that these data are not yet available in the catalogue for all people and entities, so the results should be considered a sample that will be progressively expanded.
- Possibility of carrying out multilingual searches. The Themes search engine allows the multilingual search of concepts in English and French. For example, a search for "Droit à l'éducation" will return the concept "Derecho a la educación". This functionality has been achieved by semantically exploiting the relationship between the vocabularies of BNE, Library of Congress and the National Library of France. In subsequent updates the number of languages will increase.
- Improvement of access to Hispanic Digital Library resources. From now on, digitized editions of music and press resources will include direct access to the digitized resource.
All these updates represent a great step in the path that the National Library of Spain is carrying out in favour of cultural open data promotion, but efforts continues. During the next months they will continue working to improve usability, focusing on a visual and intuitive portal, with easy-to-reuse datasets (for example, incorporating new formats or enriching the data through semantic technologies). In addition, they will go for interoperability and standardization improvements. All these are necessary actions to facilitate that users can reuse the available data and create new products and services that add value to society.
To ensure that all the actions carried out are aligned with users’ needs, the National Library of Spain has also opted for the creation of an Open Data Community. The objective is that citizens could share a dialogue space to propose new improvements, updates and uses of cultural open data. This community will be formed by a combination of professional librarian and technical profiles, which will help to extract all the value from the BNE´s data.
Noticia
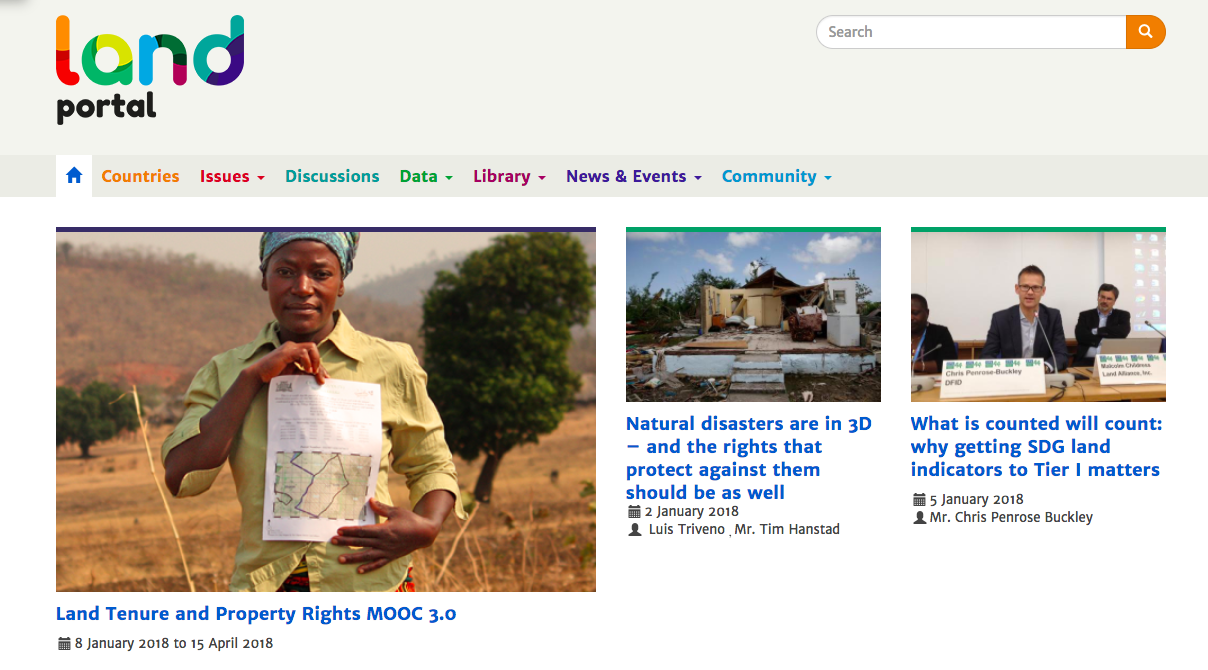
High diplomacy traditionally plays a role in helping cultures and nations to dialogue with each other. But when it comes to strengthening the right to land, it is the local communities themselves that have to get involved.
This is the vision of the Land Portal Foundation, and the main reason to create the web landportal.org, a place where interested groups can gather and consult information about land governance. This information comes from diverse sources (fragmented and sometimes not accessible) and produced by governments, academia, international organizations, indigenous peoples and non-governmental organizations. Appart from gathering information, the platform promotes the generation of debates, the exchange of information and the creation of networks of contacts.
The organization, and therefore the platform, is based on the idea of the "open movement", which are embodied in concrete realities such as establishing by default open source licenses in all its computer developments, the consumption of open data and the publication of linked open data, or the use of open licenses when sharing information.
The portal collects statistical data, bibliographic data, or data on different resources (organizations, events, news, projects) and republishes them as LOD in a machine-readable format (RDF), using a standards-based and shared data model under an open license. With this, the foundation aims to create an information ecosystem and reuse it.
To access this data published under the criteria of the Linked Open Data, a SPARQL endpoint has been deployed where semantic queries can be made to the different graphs in which the knowledge is grouped.
Another project of the organization is LandVoc,, a controlled vocabulary that gathers concepts related to the land governance. This vocabulary comes from the AGROVOC thesaurus, and was born as an attempt to standardize the concepts related to the land governance. In this way the different organizations of the domain can use the concepts to label content and thus favor the information exchange and the integration of systems. LandVoc currently consists of 270 concepts, is available in 4 languages (English, French, Spanish and Portuguese), and is published under the open license Creative Commons Attribution-Noncommercial-ShareAlike 3.0 IGO (CC BY-NC-SA 3.0 IGO).
The Land Portal Foundation carries out all this with the aim of improving the land governance and thus benefit the groups with greater insecurity in their right to land. The theory of change of the organization predicts an increase in the quality of life of the most vulnerable groups, if their right to live and cultivate without fear of forced or illegal evictions is achieved; and with the security of land tenure, it also predicts progress of the food security for the most vulnerable communities in the world.