Documentación
1. Introduction
Data visualization is a task linked to data analysis that aims to represent graphically the underlying information. Visualizations play a fundamental role in data communication, since they allow to draw conclusions in a visual and understandable way, also allowing detection of patterns, trends, anomalous data or projection of predictions, among many other functions. This makes its application transversal to any process that involves data. The visualization possibilities are very broad, from basic representations such as line, bar or sector graph, to complex visualizations configured on interactive dashboards.
Before starting to build an effective visualization, a prior data treatment must be performed, paying attention to their collection and validation of their content, ensuring that they are free of errors and in an adequate and consistent format for processing. The previous data treatment is essential to carry out any task related to data analysis and realization of effective visualizations.
We will periodically present a series of practical exercises on open data visualizations that are available on the portal datos.gob.es and in other similar catalogues. In there, we approach and describe in a simple way the necessary steps to obtain data, perform transformations and analysis that are relevant to creation of interactive visualizations from which we may extract all the possible information summarised in final conclusions. In each of these practical exercises we will use simple code developments which will be conveniently documented, relying on free tools. Created material will be available to reuse in Data Lab on Github.
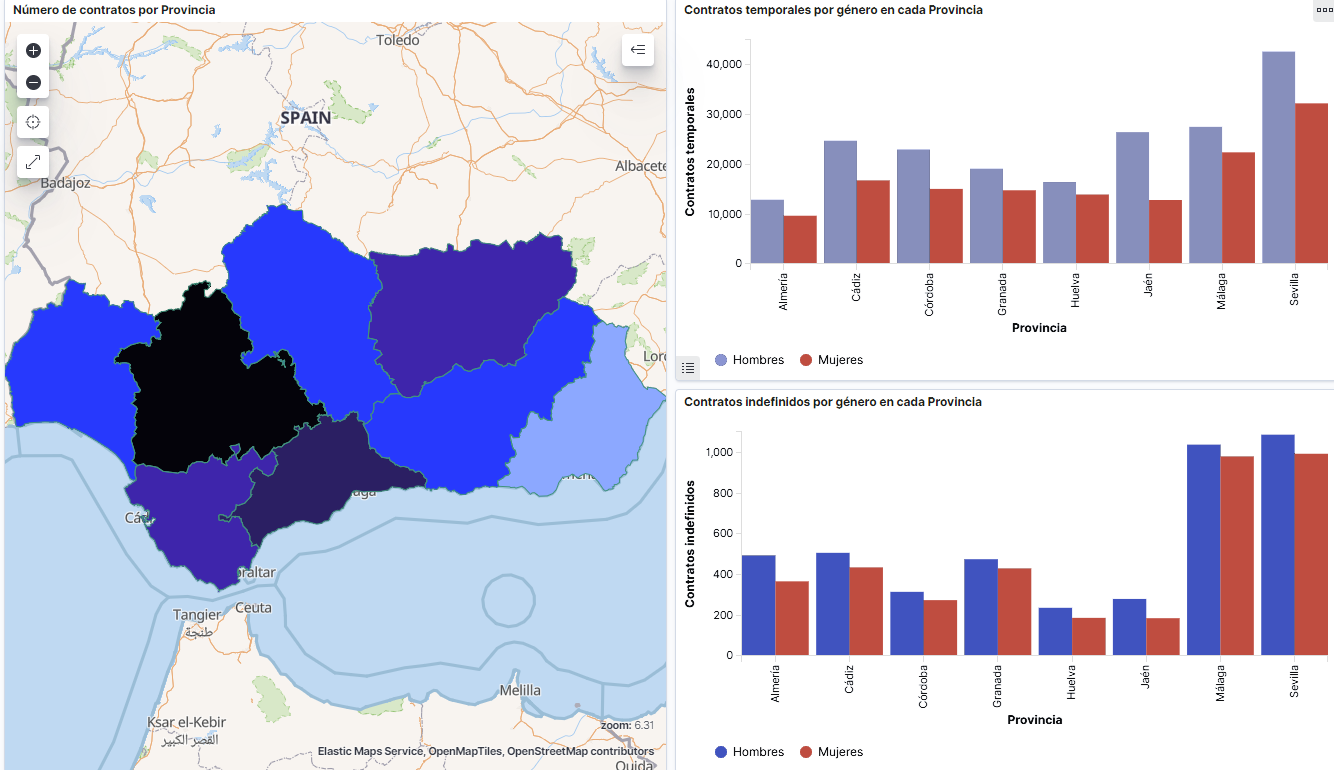
Captura del vídeo que muestra la interacción con el dashboard de la caracterización de la demanda de empleo y la contratación registrada en España disponible al final de este artículo
2. Objetives
The main objective of this post is to create an interactive visualization using open data. For this purpose, we have used datasets containing relevant information on evolution of employment demand in Spain over the last years. Based on these data, we have determined a profile that represents employment demand in our country, specifically investigating how does gender gap affects a group and impact of variables such as age, unemployment benefits or region.
3. Resources
3.1. Datasets
For this analysis we have selected datasets published by the Public State Employment Service (SEPE), coordinated by the Ministry of Labour and Social Economy, which collects time series data with distinct breakdowns that facilitate the analysis of the qualities of job seekers. These data are available on datos.gob.es, with the following characteristics:
- Demandantes de empleo por municipio: contains the number of job seekers broken down by municipality, age and gender, between the years 2006-2020.
- Gasto de prestaciones por desempleo por Provincia: time series between the years 2010-2020 related to unemployment benefits expenditure, broken down by province and type of benefit.
- Contratos registrados por el Servicio Público de Empleo Estatal (SEPE) por municipio: these datasets contain the number of registered contracts to both, job seekers and non-job seekers, broken down by municipality, gender and contract type, between the years 2006-2020.
3.2. Tools.
R (versión 4.0.3) and RStudio with RMarkdown add-on have been used to carry out this analysis (working environment, programming and drafting).
RStudio is an integrated open source development environment for R programming language, dedicated to statistical analysis and graphs creation.
RMarkdown allows creation of reports integrating text, code and dynamic results into a single document.
To create interactive graphs, we have used Kibana tool.
Kibana is an open code application that forms a part of Elastic Stack (Elasticsearch, Beats, Logstasg y Kibana) qwhich provides visualization and exploration capacities of the data indexed on the analytics engine Elasticsearch. The main advantages of this tool are:
- Presents visual information through interactive and customisable dashboards using time intervals, filters faceted by range, geospatial coverage, among others
- Contains development tools catalogue (Dev Tools) to interact with data stored in Elasticsearch.
- It has a free version ready to use on your own computer and enterprise version that is developed in the Elastic cloud and other cloud infrastructures, such as Amazon Web Service (AWS).
On Elastic website you may find user manuals for the download and installation of the tool, but also how to create graphs, dashboards, etc. Furthermore, it offers short videos on the youtube channel and organizes webinars dedicated to explanation of diverse aspects related to Elastic Stack.
If you want to learn more about these and other tools which may help you with data processing, see the report “Data processing and visualization tools” that has been recently updated.
4. Data processing
To create a visualization, it´s necessary to prepare the data properly by performing a series of tasks that include pre-processing and exploratory data analysis (EDA), to understand better the data that we are dealing with. The objective is to identify data characteristics and detect possible anomalies or errors that could affect the quality of results. Data pre-processing is essential to ensure the consistency and effectiveness of analysis or visualizations that are created afterwards.
In order to support learning of readers who are not specialised in programming, the R code included below, which can be accessed by clicking on “Code” button, is not designed to be efficient but rather to be easy to understand. Therefore, it´s probable that the readers more advanced in this programming language may consider to code some of the functionalities in an alternative way. A reader will be able to reproduce this analysis if desired, as the source code is available on the datos.gob.es Github account. The way to provide the code is through a RMarkdown document. Once it´s loaded to the development environment, it may be easily run or modified.
4.1. Installation and import of libraries
R base package, which is always available when RStudio console is open, includes a wide set of functionalities to import data from external sources, carry out statistical analysis and obtain graphic representations. However, there are many tasks for which it´s required to resort to additional packages, incorporating functions and objects defined in them into the working environment. Some of them are already available in the system, but others should be downloaded and installed.
#Instalación de paquetes \r\n #El paquete dplyr presenta una colección de funciones para realizar de manera sencilla operaciones de manipulación de datos \r\n if (!requireNamespace(\"dplyr\", quietly = TRUE)) {install.packages(\"dplyr\")}\r\n #El paquete lubridate para el manejo de variables tipo fecha \r\n if (!requireNamespace(\"lubridate\", quietly = TRUE)) {install.packages(\"lubridate\")}\r\n#Carga de paquetes en el entorno de desarrollo \r\nlibrary (dplyr)\r\nlibrary (lubridate)\r\n4.2. Data import and cleansing
a. Import of datasets
Data which will be used for visualization are divided by annualities in the .CSV and .XLS files. All the files of interest should be imported to the development environment. To make this post easier to understand, the following code shows the upload of a single .CSV file into a data table.
To speed up the loading process in the development environment, it´s necessary to download the datasets required for this visualization to the working directory. The datasets are available on the datos.gob.es Github account.
#Carga del datasets de demandantes de empleo por municipio de 2020. \r\n Demandantes_empleo_2020 <- \r\n read.csv(\"Conjuntos de datos/Demandantes de empleo por Municipio/Dtes_empleo_por_municipios_2020_csv.csv\",\r\n sep=\";\", skip = 1, header = T)\r\nOnce all the datasets are uploaded as data tables in the development environment, they need to be merged in order to obtain a single dataset that includes all the years of the time series, for each of the characteristics related to job seekers that will be analysed: number of job seekers, unemployment expenditure and new contracts registered by SEPE.
#Dataset de demandantes de empleo\r\nDatos_desempleo <- rbind(Demandantes_empleo_2006, Demandantes_empleo_2007, Demandantes_empleo_2008, Demandantes_empleo_2009, \r\n Demandantes_empleo_2010, Demandantes_empleo_2011,Demandantes_empleo_2012, Demandantes_empleo_2013,\r\n Demandantes_empleo_2014, Demandantes_empleo_2015, Demandantes_empleo_2016, Demandantes_empleo_2017, \r\n Demandantes_empleo_2018, Demandantes_empleo_2019, Demandantes_empleo_2020) \r\n#Dataset de gasto en prestaciones por desempleo\r\ngasto_desempleo <- rbind(gasto_2010, gasto_2011, gasto_2012, gasto_2013, gasto_2014, gasto_2015, gasto_2016, gasto_2017, gasto_2018, gasto_2019, gasto_2020)\r\n#Dataset de nuevos contratos a demandantes de empleo\r\nContratos <- rbind(Contratos_2006, Contratos_2007, Contratos_2008, Contratos_2009,Contratos_2010, Contratos_2011, Contratos_2012, Contratos_2013, \r\n Contratos_2014, Contratos_2015, Contratos_2016, Contratos_2017, Contratos_2018, Contratos_2019, Contratos_2020)b. Selection of variables
Once the tables with three time series are obtained (number of job seekers, unemployment expenditure and new registered contracts), the variables of interest will be extracted and included in a new table.
First, the tables with job seekers (“unemployment_data”) and new registered contracts (“contracts”) should be added by province, to facilitate the visualization. They should match the breakdown by province of the unemployment benefits expenditure table (“unemployment_expentidure”). In this step, only the variables of interest will be selected from the three datasets.
#Realizamos un group by al dataset de \"datos_desempleo\", agruparemos las variables numéricas que nos interesen, en función de varias variables categóricas\r\nDtes_empleo_provincia <- Datos_desempleo %>% \r\n group_by(Código.mes, Comunidad.Autónoma, Provincia) %>%\r\n summarise(total.Dtes.Empleo = (sum(total.Dtes.Empleo)), Dtes.hombre.25 = (sum(Dtes.Empleo.hombre.edad...25)), \r\n Dtes.hombre.25.45 = (sum(Dtes.Empleo.hombre.edad.25..45)), Dtes.hombre.45 = (sum(Dtes.Empleo.hombre.edad...45)),\r\n Dtes.mujer.25 = (sum(Dtes.Empleo.mujer.edad...25)), Dtes.mujer.25.45 = (sum(Dtes.Empleo.mujer.edad.25..45)),\r\n Dtes.mujer.45 = (sum(Dtes.Empleo.mujer.edad...45)))\r\n#Realizamos un group by al dataset de \"contratos\", agruparemos las variables numericas que nos interesen en función de las varibles categóricas.\r\nContratos_provincia <- Contratos %>% \r\n group_by(Código.mes, Comunidad.Autónoma, Provincia) %>%\r\n summarise(Total.Contratos = (sum(Total.Contratos)),\r\n Contratos.iniciales.indefinidos.hombres = (sum(Contratos.iniciales.indefinidos.hombres)), \r\n Contratos.iniciales.temporales.hombres = (sum(Contratos.iniciales.temporales.hombres)), \r\n Contratos.iniciales.indefinidos.mujeres = (sum(Contratos.iniciales.indefinidos.mujeres)), \r\n Contratos.iniciales.temporales.mujeres = (sum(Contratos.iniciales.temporales.mujeres)))\r\n#Seleccionamos las variables que nos interesen del dataset de \"gasto_desempleo\"\r\ngasto_desempleo_nuevo <- gasto_desempleo %>% select(Código.mes, Comunidad.Autónoma, Provincia, Gasto.Total.Prestación, Gasto.Prestación.Contributiva)Secondly, the three tables should be merged into one that we will work with from this point onwards..
Caract_Dtes_empleo <- Reduce(merge, list(Dtes_empleo_provincia, gasto_desempleo_nuevo, Contratos_provincia))
c. Transformation of variables
When the table with variables of interest is created for further analysis and visualization, some of them should be transformed to other types, more adequate for future aggregations.
#Transformación de una variable fecha\r\nCaract_Dtes_empleo$Código.mes <- as.factor(Caract_Dtes_empleo$Código.mes)\r\nCaract_Dtes_empleo$Código.mes <- parse_date_time(Caract_Dtes_empleo$Código.mes(c(\"200601\", \"ym\")), truncated = 3)\r\n#Transformamos a variable numérica\r\nCaract_Dtes_empleo$Gasto.Total.Prestación <- as.numeric(Caract_Dtes_empleo$Gasto.Total.Prestación)\r\nCaract_Dtes_empleo$Gasto.Prestación.Contributiva <- as.numeric(Caract_Dtes_empleo$Gasto.Prestación.Contributiva)\r\n#Transformación a variable factor\r\nCaract_Dtes_empleo$Provincia <- as.factor(Caract_Dtes_empleo$Provincia)\r\nCaract_Dtes_empleo$Comunidad.Autónoma <- as.factor(Caract_Dtes_empleo$Comunidad.Autónoma)d. Exploratory analysis
Let´s see what variables and structure the new dataset presents.
str(Caract_Dtes_empleo)\r\nsummary(Caract_Dtes_empleo)The output of this portion of the code is omitted to facilitate reading. Main characteristics presented in the dataset are as follows:
- Time range covers a period from January to December 2020.
- Number of columns (variables) is 17. .
- It presents two categorical variables (“Province”, “Autonomous.Community”), one date variable (“Code.month”) and the rest are numerical variables.
e. Detection and processing of missing data
Next, we will analyse whether the dataset has missing values (NAs). A treatment or elimination of NAs is essential, otherwise it will not be possible to process properly the numerical variables.
any(is.na(Caract_Dtes_empleo)) \r\n#Como el resultado es \"TRUE\", eliminamos los datos perdidos del dataset, ya que no sabemos cual es la razón por la cual no se encuentran esos datos\r\nCaract_Dtes_empleo <- na.omit(Caract_Dtes_empleo)\r\nany(is.na(Caract_Dtes_empleo))4.3. Creation of new variables
In order to create a visualization, we are going to make a new variable from the two variables present in the data table. This operation is very common in the data analysis, as sometimes it´s interesting to work with calculated data (e.g., the sum or the average of different variables) instead of source data. In this case, we will calculate the average unemployment expenditure for each job seeker. For this purpose, variables of total expenditure per benefit (“Expenditure.Total.Benefit”) and the total number of job seekers (“total.JobSeekers.Employment”) will be used.
Caract_Dtes_empleo$gasto_desempleado <-\r\n (1000 * (Caract_Dtes_empleo$Gasto.Total.Prestación/\r\n Caract_Dtes_empleo$total.Dtes.Empleo))4.4. Save the dataset
Once the table containing variables of interest for analysis and visualizations is obtained, we will save it as a data file in CSV format to perform later other statistical analysis or use it within other processing or data visualization tools. It´s important to use the UTF-8 encoding (Unicode Transformation Format), so the special characters may be identified correctly by any other tool.
write.csv(Caract_Dtes_empleo,\r\n file=\"Caract_Dtes_empleo_UTF8.csv\",\r\n fileEncoding= \"UTF-8\")5. Creation of a visualization on the characteristics of employment demand in Spain using Kibana
The development of this interactive visualization has been performed with usage of Kibana in the local environment. We have followed Elastic company tutorial for both, download and installation of the software.
Below you may find a tutorial video related to the whole process of creating a visualization. In the video you may see the creation of dashboard with different interactive indicators by generating graphic representations of different types. The steps to build a dashboard are as follows:
A continuación se adjunta un vídeo tutorial donde se muestra todo el proceso de realización de la visualización. En el vídeo podrás ver la creación de un cuadro de mando (dashboard) con diferentes indicadores interactivos mediante la generación de representaciones gráficas de diferentes tipos. Los pasos para obtener el dashboard son los siguientes:
- Load the data into Elasticsearch and generate an index that allows to interact with the data from Kibana. This index permits a search and management of the data in the loaded files, practically in real time.
- Generate the following graphic representations:
- Line graph to represent a time series on the job seekers in Spain between 2006 and 2020.
- Sector graph with job seekers broken down by province and Autonomous Community
- Thematic map showing the number of new contracts registered in each province on the territory. For creation of this visual it´s necessary to download a dataset with province georeferencing published in the open data portal Open Data Soft.
- Build a dashboard.
Below you may find a tutorial video interacting with the visualization that we have just created:
6. Conclusions
Looking at the visualization of the data related to the profile of job seekers in Spain during the years 2010-2020, the following conclusions may be drawn, among others:
- There are two significant increases of the job seekers number. The first, approximately in 2010, coincides with the economic crisis. The second, much more pronounced in 2020, coincides with the pandemic crisis.
- A gender gap may be observed in the group of job seekers: the number of female job seekers is higher throughout the time series, mainly in the age groups above 25.
- At the regional level, Andalusia, followed by Catalonia and Valencia, are the Autonomous Communities with the highest number of job seekers. In contrast to Andalusia, which is an Autonomous Community with the lowest unemployment expenditure, Catalonia presents the highest value.
- Temporal contracts are leading and the provinces which generate the highest number of contracts are Madrid and Barcelona, what coincides with the highest number of habitants, while on the other side, provinces with the lowest number of contracts are Soria, Ávila, Teruel and Cuenca, what coincides with the most depopulated areas of Spain.
This visualization has helped us to synthetise a large amount of information and give it a meaning, allowing to draw conclusions and, if necessary, make decisions based on results. We hope that you like this new post, we will be back to present you new reuses of open data. See you soon!
Entrevista
R-Ladies is a software community that aims to give visibility to women who work or develop projects or software using R to do so. It is a local branch of R-Ladies Global, an open source community born in 2016.
Its organisers, Inés Huertas, Leticia Martín-Fuertes and Elen Irazabal, gave us a few minutes to talk about the activities carried out by this community and how to promote the presence of women in technological fields.
Full interview:
1. How does R-Ladies start?
R-Ladies Madrid was born from an international initiative, but it was also born from a local reality in Spain at that time, which was that few girls could be found at congresses or developing R packages, so nobody thought it was a problem until the first meetups, when many women who were attending a community for the first time started to appear and we didn't see them in those other spaces for different reasons. That motivated us to continue with the community, since in many occasions we were the gateway for them to be able to participate in these communities or conferences, etc.
2. What advantages and disadvantages does R have as a programming language compared to its competitors?
R is one of the first free software languages used in the world of data. It has been closely related to the university and research community, which initially fed a large part of the package that we have today. Today there are large companies that work to improve and maintain these repositories, because the spectrum of software that can be found in R is very broad and has a powerful community behind it. You can find developments ranging from niche research packages such as biogenetics, to less specific packages for general analysis.
3. The number of women in engineering is 25% (while the total number of women in the university system is 59%). In your opinion, what are the reasons behind this situation?
There are several reasons for this, but if we have to choose one, it is the lack of visibility of women in engineering. Great efforts are currently being made to give visibility to women who develop and work with data. At R-Ladies, for example, we have an international directory where you can find women to speak at conferences around the world, thus being able to create reference models for other women who are encouraged to participate. That's what we do at R-Ladies, we give visibility to women who are working with R.
In any case, and given the digital revolution we are living through, what we are seeing is the union between letters and sciences. For example, in the field of Artificial Intelligence, we are seeing how it is affecting areas that were previously literary, such as linguistics, law, marketing and so on. Given this intersection, mixed profiles are appearing that, without having studied an engineering degree, are dedicated to applying technical aspects to the non-technical world. For example, teaching natural language to machines.
The case of law is also paradigmatic; there are already regulations that require technical knowledge to apply them. In fact, even the technical world can also be interested in the world of letters, for example, how law and regulation affect how the internet works.
In short, the world of science and the world of literature should not be seen as separate careers, but as increasingly complementary.
We are seeing the union between the arts and the sciences. Mixed profiles are appearing that, without having studied an engineering degree, are dedicated to applying technical aspects to the non-technical world.
4. How do initiatives such as R-Ladies help to boost the presence of women in technology?
Precisely by helping to create Role Models. Supporting women so that they do not suffer from the so-called "imposter syndrome". Giving a talk in your free time about the things you work on or are interested in is much more than it seems, for many of these women it is a first step that can help them to present a project in their company or defend a proposal to a client.
5. What projects are you working on?
Currently with the pandemic we have had to adapt with a cycle of monthly online workshops/talks during 2020/2021 that does not limit us to be physically in Madrid, so we have speakers that otherwise would be more complicated to bring to Madrid. In addition, we have tried to do these monthly workshops in an incremental way, so that starting in September until now we have been increasing the level of the sessions starting from the first steps in R to finish with the realization of a data analysis with Neural Networks. We are also feeding with these sessions our YouTube channel, generating content in Spanish on how to use R that is having a great reception.
6. What types of open data have you used in your projects and what data would you like to work with?
On the use of open data, some of the working groups use data from the BOE or Open Data NASA for project development. We also helped to set up a working group that works with covid data.
We would like to be able to work with Spanish jurisprudence. It would be very interesting to see how in the history of democracy different sentences have been handed down and how they have evolved over the years.
We would also like to be able to work with the RAE's reference corpora, such as CREA, CORDE or CORPES XXI, which contain texts of various kinds, including oral transcriptions, with which we could carry out a great deal of linguistic analysis and serve as training data to improve the presence of Spanish in the field of AI.
On the use of open data, some of the working groups use data from the BOE or Open Data NASA for project development. We also helped set up a working group that works with covid data.
7. Finally, how can interested people follow R-Ladies and collaborate with you?
Super easy! You can write to us at madrid@rladies.org, sign up for our Meetup or simply tweet us at @RladiesMad. Everyone is welcome!
Noticia
Summer is just around the corner and with it the well-deserved holidays. Undoubtedly, this time of year gives us time to rest, reconnect with the family and spend pleasant moments with our friends.
However, it is also a great opportunity to take advantage of and improve our knowledge of data and technology through the courses that different universities make available to us during these dates. Whether you are a student or a working professional, these types of courses can contribute to increase your training and help you gain competitive advantages in the labour market.
Below, we show you some examples of summer courses from Spanish universities on these topics. We have also included some online training, available all year round, which can be an excellent product to learn during the summer season.
Courses related to open data
We begin our compilation with the course 'Big & Open Data. Analysis and programming with R and Python' given by the Complutense University of Madrid. It will be held at the Fundación General UCM from 5 to 23 July, Monday to Friday from 9 am to 2 pm. This course is aimed at university students, teachers, researchers and professionals who wish to broaden and perfect their knowledge of this subject.
Data analysis and visualisation
If you are interested in learning the R language, the University of Santiago de Compostela organises two courses related to this subject, within the framework of its 'Universidade de Verán' The first one is 'Introduction to geographic and cartographic information systems with the R environment', which will be held from 6 to 9 July at the Faculty of Geography and History of Santiago de Compostela. You can consult all the information and the syllabus through this link.
The second is 'Visualisation and analysis of data with R', which will take place from 13 to 23 July at the Faculty of Mathematics of the USC. In this case, the university offers students the possibility of attending in two shifts (morning and afternoon). As you can see in the programme, statistics is one of the key aspects of this training.
If your field is social sciences and you want to learn how to handle data correctly, the course of the International University of Andalusia (UNIA) 'Techniques of data analysis in Humanities and Social Sciences' seeks to approach the use of new statistical and spatial techniques in research in these fields. It will be held from 23 to 26 August in classroom mode.
Big Data
Big Data is increasingly becoming one of the elements that contribute most to the acceleration of digital transformation. If you are interested in this field, you can opt for the course 'Big Data Geolocated: Tools for capture, analysis and visualisation' which will be given by the Complutense University of Madrid from 5 to 23 July from 9 am to 2 pm, in person at the Fundación General UCM.
Another option is the course 'Big Data: technological foundations and practical applications' organised by the University of Alicante, which will be held online from 19 to 23 July.
Artificial intelligence
The Government has recently launched the online course 'Elements of AI' in Spanish with the aim of promoting and improving the training of citizens in artificial intelligence. The Secretary of State for Digitalisation and Artificial Intelligence will implement this project in collaboration with the UNED, which will provide the technical and academic support for this training. Elements of AI is a massive open educational project (MOOC) that aims to bring citizens knowledge and skills on Artificial Intelligence and its various applications. You can find out all the information about this course here. And if you want to start the training now, you can register through this link. The course is free of charge.
Another interesting training related to this field is the course 'Practical introduction to artificial intelligence and deep learning' organised by the International University of Andalusia (UNIA). It will be taught in person at the Antonio Machado headquarters in Baeza between 17 and 20 August 2021. Among its objectives, it offers students an overview of data processing models based on artificial intelligence and deep learning techniques, among others.
These are just a few examples of courses that are currently open for enrolment, although there are many more, as the offer is wide and varied. In addition, it should be remembered that summer has not yet begun and that new data-related courses could appear in the coming weeks. If you know of any other course that might be of interest, do not hesitate to leave us a comment below or write to us at contacto@datos.gob.es.
Entrevista
R Hispano is a community of users and developers that was born in 2011, within the III Conference of R Users, with the aim of promoting the advancement of knowledge and the use of the programming language in R. From datos.gob.es we have spoken with them so that they can tell us more about the activities they carry out and the role of open data in them.
Full interview.
1. Can you briefly explain what the R-Hispano Community is?
It is an association created in Spain whose objective is to promote the use of R among a Hispanic audience. There are many R users worldwide and we try to serve as a meeting point for all those whose primary language is Spanish. By having a smaller group within such a large community as a reference, it is easier to build relationships and meet people to turn to when you want to learn more or share what you have learned.
2. R was born as a language linked to the statistical exploitation of data, however, it has become an essential tool of Data Science, why so much acceptance of this language by the community?
It's true that many data science and engineering professionals tend to use more generic languages like Python. However, there are several reasons why R is essential in the "Stack" of teams that work with data. First of all, R has its origin in the S language, which was designed in the 1970s specifically for data analysis, within the Bell Laboratories. This allows people with different computer backgrounds to participate in complex projects, focusing on analysis methods. Second, R has aged very well, and a broad community of users, developers, and businesses contribute to the project with packages and tools that quickly extend functionality to the most innovative methods with (relative) simplicity and rigor.
3. R Hispano works through numerous local initiatives, what advantages does this form of organization bring?
In day-to-day activities, especially when we had face-to-face meetings, more than a year ago, it is more comfortable to coordinate people as closely as possible. It makes no sense for a person in Madrid to organize monthly meetings in Malaga, Seville or the Canary Islands. The interesting thing about these events is to attend regularly, get to know the attendees, understand what the public demands and what can be offered. That, apart from pampering and dedication, requires being close because, otherwise, there is no way to establish that bond. That is why it seemed to us that it is from the cities themselves that this relationship has to be maintained from day to day. On the other hand, it is the way in which the Community of R has been organized around the world, with the success that we all know.
4. Do you consider open data initiatives a valuable source of information for the development of your projects? Any notable reuse examples? What aspects of the current initiatives do you consider could be improved?
The first thing to say is that R Hispano as such has no projects. However, many R Hispano partners work with open data in their professional field, be it academic or business. Of course, it is a very valuable source of information, with many examples, such as the analysis of data from the pandemic that we still suffer, data from sports competitions and athletes' performance, environmental, socio-economic data, ... We cannot highlight any of them because there are many very interesting that would deserve it equally. As for the improvements, there are still many public data repositories that do not publish it in a “treatable” format by analysts. A PDF report can be open data, but it certainly does not contribute to its dissemination, analysis, and exploitation for the good of society.
5. Can you tell us about some of the activities carried out by these local Initiatives?
Several local R groups, both in Spain and Latam, recently collaborated with the technology training company, UTad, in the event “Encounters in the R phase”. Held online for two days. The R user days that we celebrate each year are usually organized by one of the local groups at the headquarters. The Córdoba group is organizing the next ones, postponed due to the pandemic and for which we hope to announce dates soon.
The Madrid R User Group began to function as a local group linked to the Hispanic R Community more than fifteen years ago. Since its origin, it has maintained a monthly periodicity of meetings announced on the social network Meetup (sponsored by RConsortium, entity, founded and subsidized by large companies to favor the use of R). The activity has been interrupted by the limitations of the Covid-19, but all the history of the presentations has been compiled in this portal.
From the Group of R Canarias they have been involved in the conference TabularConf, which took place on January 30, online, with an agenda of a dozen presentations on data science and artificial intelligence. In the past the Canarian group carried out a R user meeting with communications on various topics, including modeling, geographic data processing, as well as queries to public data APIs, such as datos.gob.es, with the library opendataes. Other bookstores presented at a meetup they held in 2020 areistacr or inebaseR, always betting on access to public data.
In the Local Group of Seville, during the hackathons held in recent years they have begun to develop several packages totally linked to open data.
- Air: To get air quality data in Andalusia (works, but needs some adjustments)
- Aemet: R package to interact with the AEMET API (climatic data). We took the first steps in a hackathon, then Manuel Pizarro made a fully functional package.
- Andaclima: Package to obtain climatic data from agroclimatic stations of the Junta de Andalucía
- Data.gob.es.r: Package embryo to interact with http://datos.gob.es. Really just an exploration of ideas, nothing functional for now.
Regarding COVID-19, it is worth highlighting the development by the UCLM, with the collaboration of a former member of the Board of Directors of the R Hispano Community, of this COVID-19 analysis panel, with the cases that the Board of Communities of Castilla-La Mancha presented by municipality. It consists of a interactive tool to consult the information on the incidence and rates per 100,000 inhabitants.
6. In addition, they also collaborate with other groups and initiatives.
Yes, we collaborate with other groups and initiatives focused on data, such as the UNED (Faculty of Sciences), which for a long period of time welcomed us as its permanent headquarters. I would also highlight our performances with:
- Data Journalism Group. Joint filings with the Data Journalism group, sharing the benefits of R for their analysis.
- A collaboration with the Group Machine Learning Spain that resulted in a common presentation in the Google Campus of Madrid.
- With groups of other data languages, such as Python.
- Collaborations with companies. At this point we highlight having participated in two Advanced Analytics events organized by Microsoft, as well as having received small financial aid from companies such as Kabel or Kernel Analytics (recently acquired by Boston Consulting Group).
These are some examples of presentations in the Madrid group based on open data:
-
Madrid Air Quality Analysis (First Y Second version)
- ENRON data analysis
In addition, different partners of R-Hispano also collaborate with academic institutions, in which they teach different courses related to Data analysis, especially promoting the use and analysis of open data, such as the Faculty of Economics of the UNED, the Faculties of Statistics and Tourism and Commerce of the UCM, the University of Castilla-La Mancha, the EOI (specific subject on open data), the Francisco de Vitoria University, the Higher School of Telecommunications Engineering, the ESIC and the K- School.
Finally, we would like to highlight the constant link that is maintained with different relevant entities of the R ecosystem: with R-Consortium (https://www.r-consortium.org/) and RStudio (https://rstudio.com/). It is through the R-Consortium where we have obtained the recognition of the Madrid Group as a stable group and from which we obtain the sponsorship for the payment of Meetup. Within RStudio we maintain different contacts that have also allowed us to obtain sponsorships that have helped in the R Conference, as well as speakers of the stature of Javier Luraschi (author of the package and book on “sparklyr”) or Max Kuhn (author of packages such as "Caret" and its evolution "tidymodels").
7. Through ROpenSpain, some RHispano partners have collaborated in the creation of packages in R that facilitate the use of open data.
ROpenSpain is a community of R, open data and reproducibility enthusiasts who come together and organize to create R packages of the highest quality for the exploitation of Spanish data of general interest. It was born, with the inspiration of ROpenSci, in February 2018 as an organization ofGitHub and has a collaboration channel in Slack. As of January 2021, ROpenSpain groups the following R packages:
- opendataes: Easily interact with the data.gob.es API, which provides data from public administrations throughout Spain.
- MicroData: Allows importing to R various types of INE microdata files: EPA, Census, etc.
- caRtocity: Consult the Cartociudad API, which provides geolocation services, routes, maps, etc.
- Siane: To represent statistical information on the maps of the National Geographic Institute.
- airquality: Air quality data in Spain from 2011 to 2018.
- mapSpain: To load maps of municipalities, provinces and Autonomous Communities. Includes a plugin for leaflet.
- MorbiditySpainR: Read and manipulate data from the Hospital Morbidity Survey
- spanish: For the processing of certain types of Spanish information: numbers, cadastral geocoding, etc.
- BOE: For the processing of the Official State Gazette and the Official Gazette of the Mercantile Registry.
- istacbaser: To consult the API of the Canary Institute of Statistics.
- Cadastre: Consult the Land Registry API.
Some of these packages have been featured at events organized by the R Hispano Community.
8. Finally, how can interested people follow R-Hispano and collaborate with you?
An important element as a link in the entire community of R users in Spanish is the R-Help-es help list:
- Search: https://r-help-es.r-project.narkive.com/;
- Subscription: https://stat.ethz.ch/mailman/listinfo/r-help-es ).
It is one of the few active R-Help lists independent of the main English R-Help that has generated more than 12,800 entries in its more than 12-year history.
In addition, a high level of activity is maintained in social networks that serve as a speaker, a lever through which future events or different news related to data of interest to the community are announced.
We can highlight the following initiatives in each of the platforms:
- Twitter: Presence of the R-Hispano association itself; https://twitter.com/R_Hisp and participation in the hashtag #rstatsES (R in Spanish) of different R collaborators at the national level.
- LinkedIn: In this professional network, "R" has a presence through the company page https://www.linkedin.com/company/comunidad-r-hispano/. In addition, many R-Hispano partners from both Spain and Latam are part of this network, sharing open resources.
- Telegram channel: (https://t.me/rhispano) There is a telegram channel where news of interest to the community is disseminated with certain periodicity
Finally, on the association's website, http://r-es.org, you can find information about the association, as well as how to become a member (the fee is, like R, free)
Blog
Until relatively recently, talking about art and data in the same conversation might seem strange. However, recent advances in data science and artificial intelligence seem to open the door to a new discipline in which science, art and technology go hand in hand.

The cover image has been extracted from the blog https://www.r-graph-gallery.com and was originally created by Marcus Volz on his website.
The image above could be an abstract painting created by some modern art author and exhibited at the MoMA in New York. However, it is an image created with some R-code lines that use complex mathematical expressions. Despite the spectacularity of the resulting figure, the beautiful shape of the strokes does not represent a real form. But the ability to create art with data is not limited to generating abstract forms. The possibilities of creating art with code go much further. Here you are two examples:
Real art and representation of plants

With less than 100 lines of R code we can create this plant and infinite variations in terms of branches, symmetry and complexity. Without being an expert in plants and algae, I am sure that I have seen plants and algae similar to this in many occasions. With these representations, we just try to reproduce what nature creates naturally, taking into account physics and mathematics laws. The figures shown below have been created using the R code originally extracted from Antonio Sánchez Chinchón blog.

Variations of plants artificially created by R code and fractal expressions.
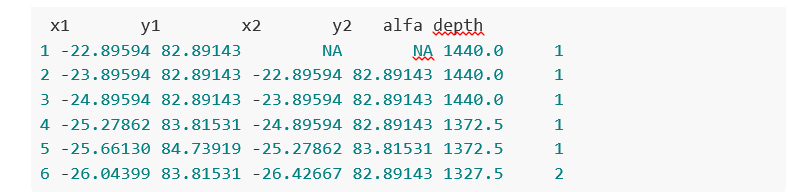
As an example, these are the data that make up some of the figures discussed above:
Photography and art with data
But it is not just possible to construct abstract figures or representations that imitate the forms of plants. With the help of data tools and artificial intelligence we can imitate, and even create new works. In the following example, we obtain simplified versions of photographs, using subsets of pixels from the original photograph. Let's see this example in detail.
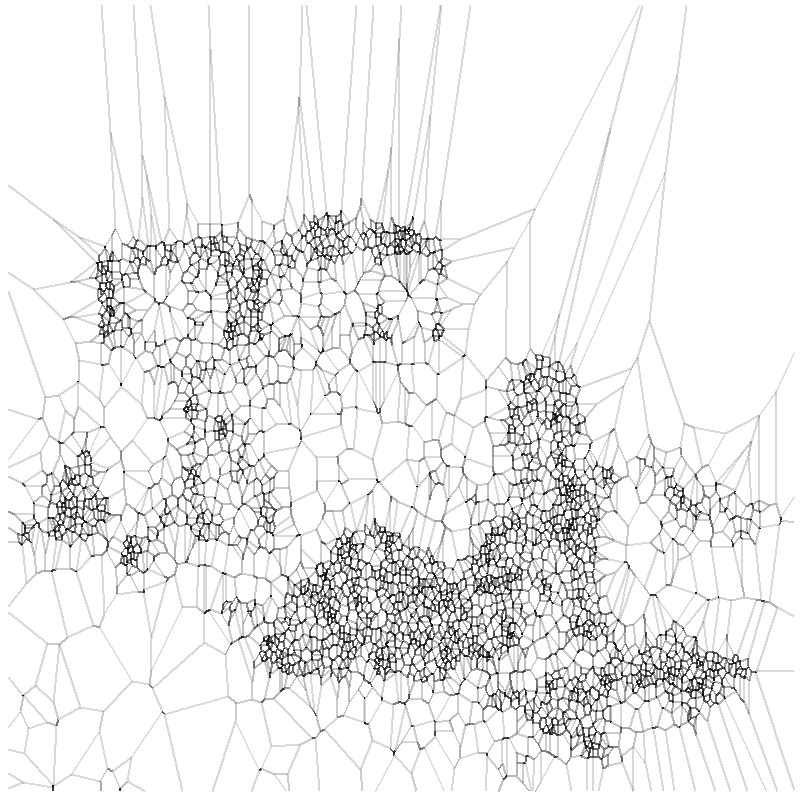
We take a photograph of a bank of open images, in this case Wikimedia Commons website, such as the following:

By Finetooth - Own work, CC BY-SA 3.0, https://commons.wikimedia.org/w/index.php?curid=11692574
Next, we execute a relatively simple algorithm that generates polygonal shapes around the main pixels of the original image. In addition to a simple images treatment to turn this photograph into a flat black and white image, this algorithm applies a mathematical method called Voronoid diagram. When the subset of data (on which we apply the Voronoid diagram) is small, the result of the treatment is poor and we can barely distinguish the underlying form of the figure.
However, as we increase the subset of points to reproduce the initial photograph, we begin to find fascinating results. Finally, with less than 20% of all the points that make up the original image, we obtain a really beautiful and artistic result. This experiment is based on the original post by Antonio Sánchez Chinchón on his blog Fronkostin.
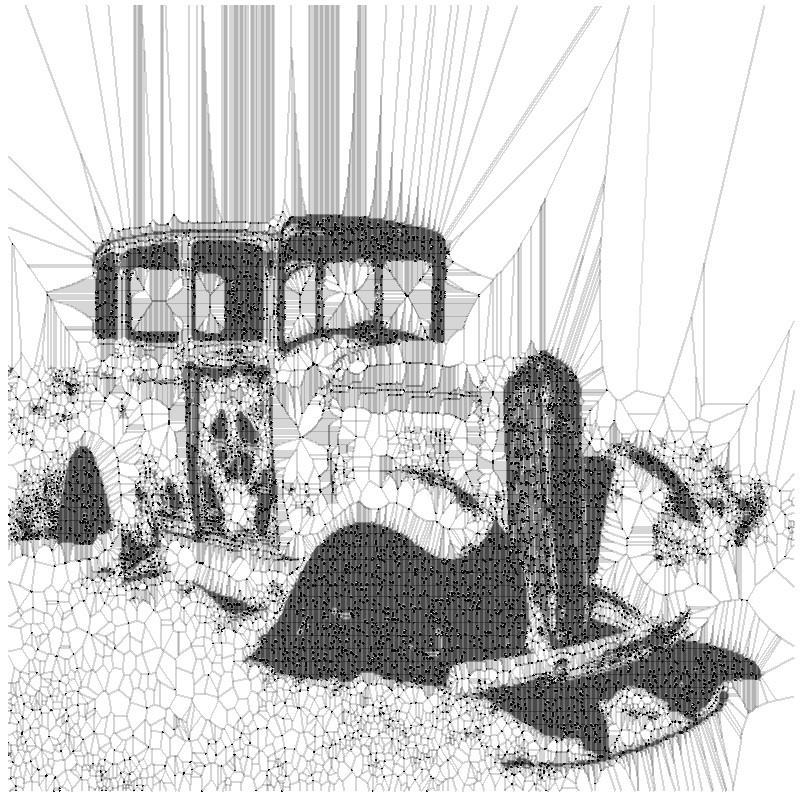
The ability to generate art with the powerful combination of mathematics and programming codes is absolutely powerful. In the following link it is possible to appreciate some of the most impressive works that exist in this art form. The author of this blog is Marcus Volz, researcher at the University of Melbourne. Marcus works with R to generate the figures in two dimensions and with Houdini for 3D and animation.
Content prepared by Alejandro Alija, expert in Digital Transformation and innovation.
Contents and points of view expressed in this publication are the exclusive responsibility of its author.
Blog
R vs Python? Better R and Python: Two languages, two styles. A common goal: to domesticate the data.
If data science were a sport, R and Python would be the two best teams in the league for several seasons. If you are a Data Scientist or are close to this scientific-technical discipline, the two programming languages that come to your mind immediately are R and Python. However, far from considering them complementary languages, most of the time, we end up comparing virtues and defects of both languages as if we were in a competition. R and Python are excellent tools, but they are often conceived as rivals. Just search R vs Python in Google to get hundreds of entries that try to tip the scales in favour of one of them. Largely, this is because the data science communities have been determined to divide according to the programming language they use. We could say that there is an R team and a Python team and history is teaching us that these two teams are destined to be eternal rivals. The fans of both teams fervently believe that their language is superior to the other. Maybe, in the background, these two languages are not so different, but it seems that the people who use them do are.
Both languages show a spectacular growth and projection in recent years, leaving their classic rivals far away in most of the rankings of programming languages for data science.

Growth of R and Python in comparison with other programming languages for data science.
You have to also kept in mind that, while Python is a general-purpose programming language (with very good aptitudes for data science), R is a specific programming language for this discipline, created and designed since its origin with a clear orientation towards mathematics and statistics.
R and Python communities
In Spain there are different communities that group developers of one and another (misunderstood) sides.
R
The R Hispanic community brings together many of the events related to the world of R in our country. The Hispanic community organizes an annual conference that has been growing in popularity in recent years and where you can see the latest applications of R to real data science problems. Originally, they were events aimed at the academic field that little by little are giving entrance to applications coming from the business and applied world.
Worldwide, the R Foundation is the one who supports and maintains the R code development project as well as the one that promotes the world's biggest event around the R code - the UseR! Conference, which will be celebrated in Toulouse, France in 2019.
There are R user groups (hundreds in the world) in practically all developed countries and several of these groups are in countries such as the US, Canada or Russia. In this interactive map you can explore the activity of the R community around the world. http://rapporter.net/custom/R-activity/
A few years ago, an interesting movement began in the community of R users that resulted in the creation of user groups composed of women. The so-called R-Ladies groups have grown significantly, highlighting the importance of women in science and, in particular, in the field of data science.
Python
Predictably, the user communities of R are reflected in those of Python and vice versa. Starting by the end, the Python user community has its own PyLadies sub-community with the focus on enhancing the presence of women in Python code development. In the same way, there was a Hispanic Python that unfortunately has no longer activity although we can find the web in the google file. For its part, the Python España association has been providing organizational support to the PyConEs conference since 2013. It is the national conference on the Python language, and financial aid to local communities.
Worldwide, in the same way as in R, the Python Software Foundation (PSF) is an organization dedicated to advancing open source technology related to the Python programming language. The PSF offers support to the Python development community through financial aid programs, the maintenance of technological infrastructures (such as the websites to store official documentation as well as libraries repositories) and finally, the organization of the PyConUS, the Python development conference in the United States.
En definitiva, las comunidades alrededor del código abierto u open-source forman un modelo de desarrollo de software basado en la colaboración abierta y en la transparencia en los procesos. Estas comunidades garantizan el desarrollo de código abierto de mayor calidad, más confiable, con una mayor flexibilidad y un menor coste al aprovechar el poder colectivo para la generación de código, acabando así con el vendor lock-in de las empresas de software propietario.
Las comunidades de desarrollo de estos lenguajes - estándares de facto en el mundo de la ciencia de datos - tienen mucho que aportar a las comunidades de datos abiertos. Las organizaciones mantenedoras de los repositorios de datos abiertos pueden seguir el camino marcado por las comunidades open-source. Más allá de almacenar y poner a disposición conjuntos de datos abiertos a través de diferentes mecanismos, la potencia de la comunidad reside en los usuarios. El foco ha de ponerse en crear modelos de compromiso (engagement) que atraigan el talento de los desarrolladores y creadores de contenido alentados por el acceso sencillo y rápido a los datos con los que moldear el futuro digital.
Content prepared by Alejandro Alija, expert in Digital Transformation and innovation.
Contents and points of view expressed in this publication are the exclusive responsibility of its author.
Documentación
In the digital world, data becomes a fundamental asset for companies. Thanks to them, they can better understand their environment, business and competition, and make convenient decisions at the right time.
In this context, it is not surprising that an increasing number of companies are looking for professional profiles with advanced digital capabilities. Workers who are able to search, find, process and communicate exciting stories based on data.
The report "How to generate value from data: formats, techniques and tools to analyse open data" aims to guide those professionals who wish to improve the digital skills highlighted above. It explores different techniques for the extraction and descriptive analysis of the data contained in the open data repositories.
The document is structured as follows:
- Data formats. Explanation of the most common data formats that can be found in an open data repository, paying special attention to csv and json.
- Mechanisms for data sharing through the Web. Collection of practical examples that illustrate how to extract data of interest from some of the most popular Internet repositories.
- Main licenses. The factors to be considered when working with different types of licenses are explained, guiding the reader towards their identification and recognition.
- Tools and technologies for data analysis. This section becomes slightly more technical. It shows different examples of extracting useful information from open data repositories, making use of some short code fragments in different programming languages.
- Conclusions. A technological vision of the future is offered, with an eye on the youngest professionals, who will be the workforce of the future.
The report is aimed at a general non-specialist public, although those readers familiar with data treatment and sharing o in the web world will find a familiar and recognizable reading.
Next, you can then download the full text, as well as the executive summary and a presentation.
Note: The published code is intended as a guide for the reader, but may require external dependencies or specific settings for each user who wishes to run it.