Noticia
The opening of the data should not be an end in itself. The open data portals created without a clear objective, lacking a well-defined plan to attract visitors, tend to fall into disuse over time.
Opening public data isn’t an end in itself. Portals created without a clear sense of purpose or any plan to attract visitors often lie underused over time. As the report of Open Data Maturity in Europe indicates, less than 50% of national portals really know who their users are. For this reason, it becomes necessary to fullfil the needs of the community, update the data regularly and take into account the platform usability so they are sustainable in the long term.
How can we achieve it? The European guide Recommendations for Open Data Portals: from its launch to sustainability helps us in this task thanks to the guidelines provided for open data platforms to be succesful on its implementation and subsequent maintenance.
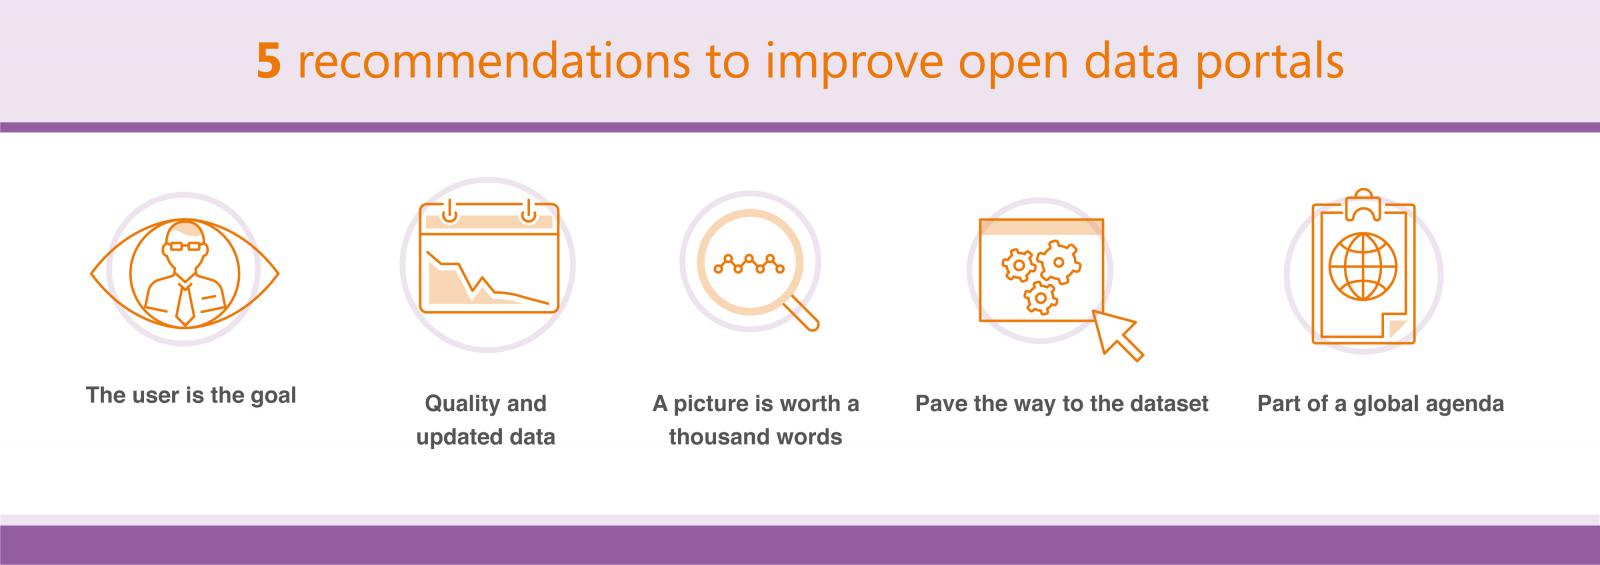
5 recommendations to improve open data portals
The user is the goal. Open data is meaningless if nobody reuses it. Data hackathons can help in this aspect by bringing the community closer to public sector information.
The city of Chicago carries out this action since five years through the Chi Hacknight, a weekly event where members of the IT community and public employees share ideas and implement reuse projects of municipal data.
Quality and updated data. For a portal to attract and retain users, it is necessary to provide quality and updated information.
The New York Databridge platform collects information from a score of agencies and organizations in the city that directly send their data to the portal. At the same time, in order to allow information interoperability, a common standard based on geocodes has been created to eliminate possible differences between the data of the different entities.
In addition, Databridge also feeds and supports other municipal tools, such as Firecast from the Fire Department, which predicts what buildings in the city are more at risk of fire. In this way, the agencies are committed to ensuring that the portal information is accurate and up-to-date so they can benefit from its reuse potential.
A picture is worth a thousand words. Raw data is difficult to consume. Visualizations, graphs, maps or tables make the information more user-friendly. Aware of this, the city of Cincinnati has developed the CincyInsights initiative, a website with more than 25 different dashboards to visualize local data: public spending, business activity, emergency services, etc.
In fact, thanks to this program, the city has been able to address health problems in different neighborhoods and improve the medical assistance provided to the community. In fact, public employees began to use CicyInsights to monitor the opiate consumption in the twon, locate the areas with the highest rate of overdose and, thus, carry out preventive health actions.
Thanks to this project, in less than a year, the volume of ownloads from Cincinnati open data portal spiked.
Pave the way to the dataset. Sometimes finding the necessary information becomes a difficult task. One option to solve this problem is to make the datasets accesible via search engines. So did Data USA that designed its portal in a way search engines could read the information of the platform, being accesible for users.
To do this, profile pages were created within the platform to host the different datasets. These profile pages were designed with algorithms that create titles matching the search terms to facilitate their indexing, including related content, data by cities, states and activity. For instance, a page displaying the average number of hours worked by residents of different cities is headlined “The hardest working people in America”, increasing chances of it being found via search engines
Part of a global agenda. Bringing these recommendations together means understanding the open data portal as a tool to improve governance, encourage citizen participation and boost development.
An example of the opportunities offered by this more holistic approach is the case of Kansas, in the USA. The KCStat program reuses data from local calls related to transport, safety or economic incidents so the different municipal departments work on them. The result is shared publicly in a monthly meeting and through visualizations in the open data portal of the city, so citizens know how municipal policies address their problems.
As it is concluded in the original article, if the open data portals want to obtain the highest return on investment, they need to elaborate a plan so that the content is relevant, accessible and attractive both for the government and the society. Because, only in this way, it will be possible to reuse and exploit the potential of public sector information.
Original article:
https://apolitical.co/solution_article/five-sure-fire-ways-upgrade-open-data-portals/
Noticia
Last 23rd March, the GovLab and Omidyar Network published the report Open Data Impact: When Demand and Supply Mee where key findings about the social, economic, cultural and political impact of open data are released, based on the analysis of 19 case studies from around the world. These case studies serve as the base to understand when and how open data works; as, so far, there are few systematic analyses that assess real impact of open data.
The initiative Open Data’s Impact has selected nineteen stories to evaluate their geographic and sectoral representativeness. To this end, a combination of desk research and in-depth interview with projects’ key players has been used. In order to systematically interpret the collected data, an analytical framework was built and applied across each case study analysing the three following parameters: key dimensions of impact, key enabling conditions and key challenges.
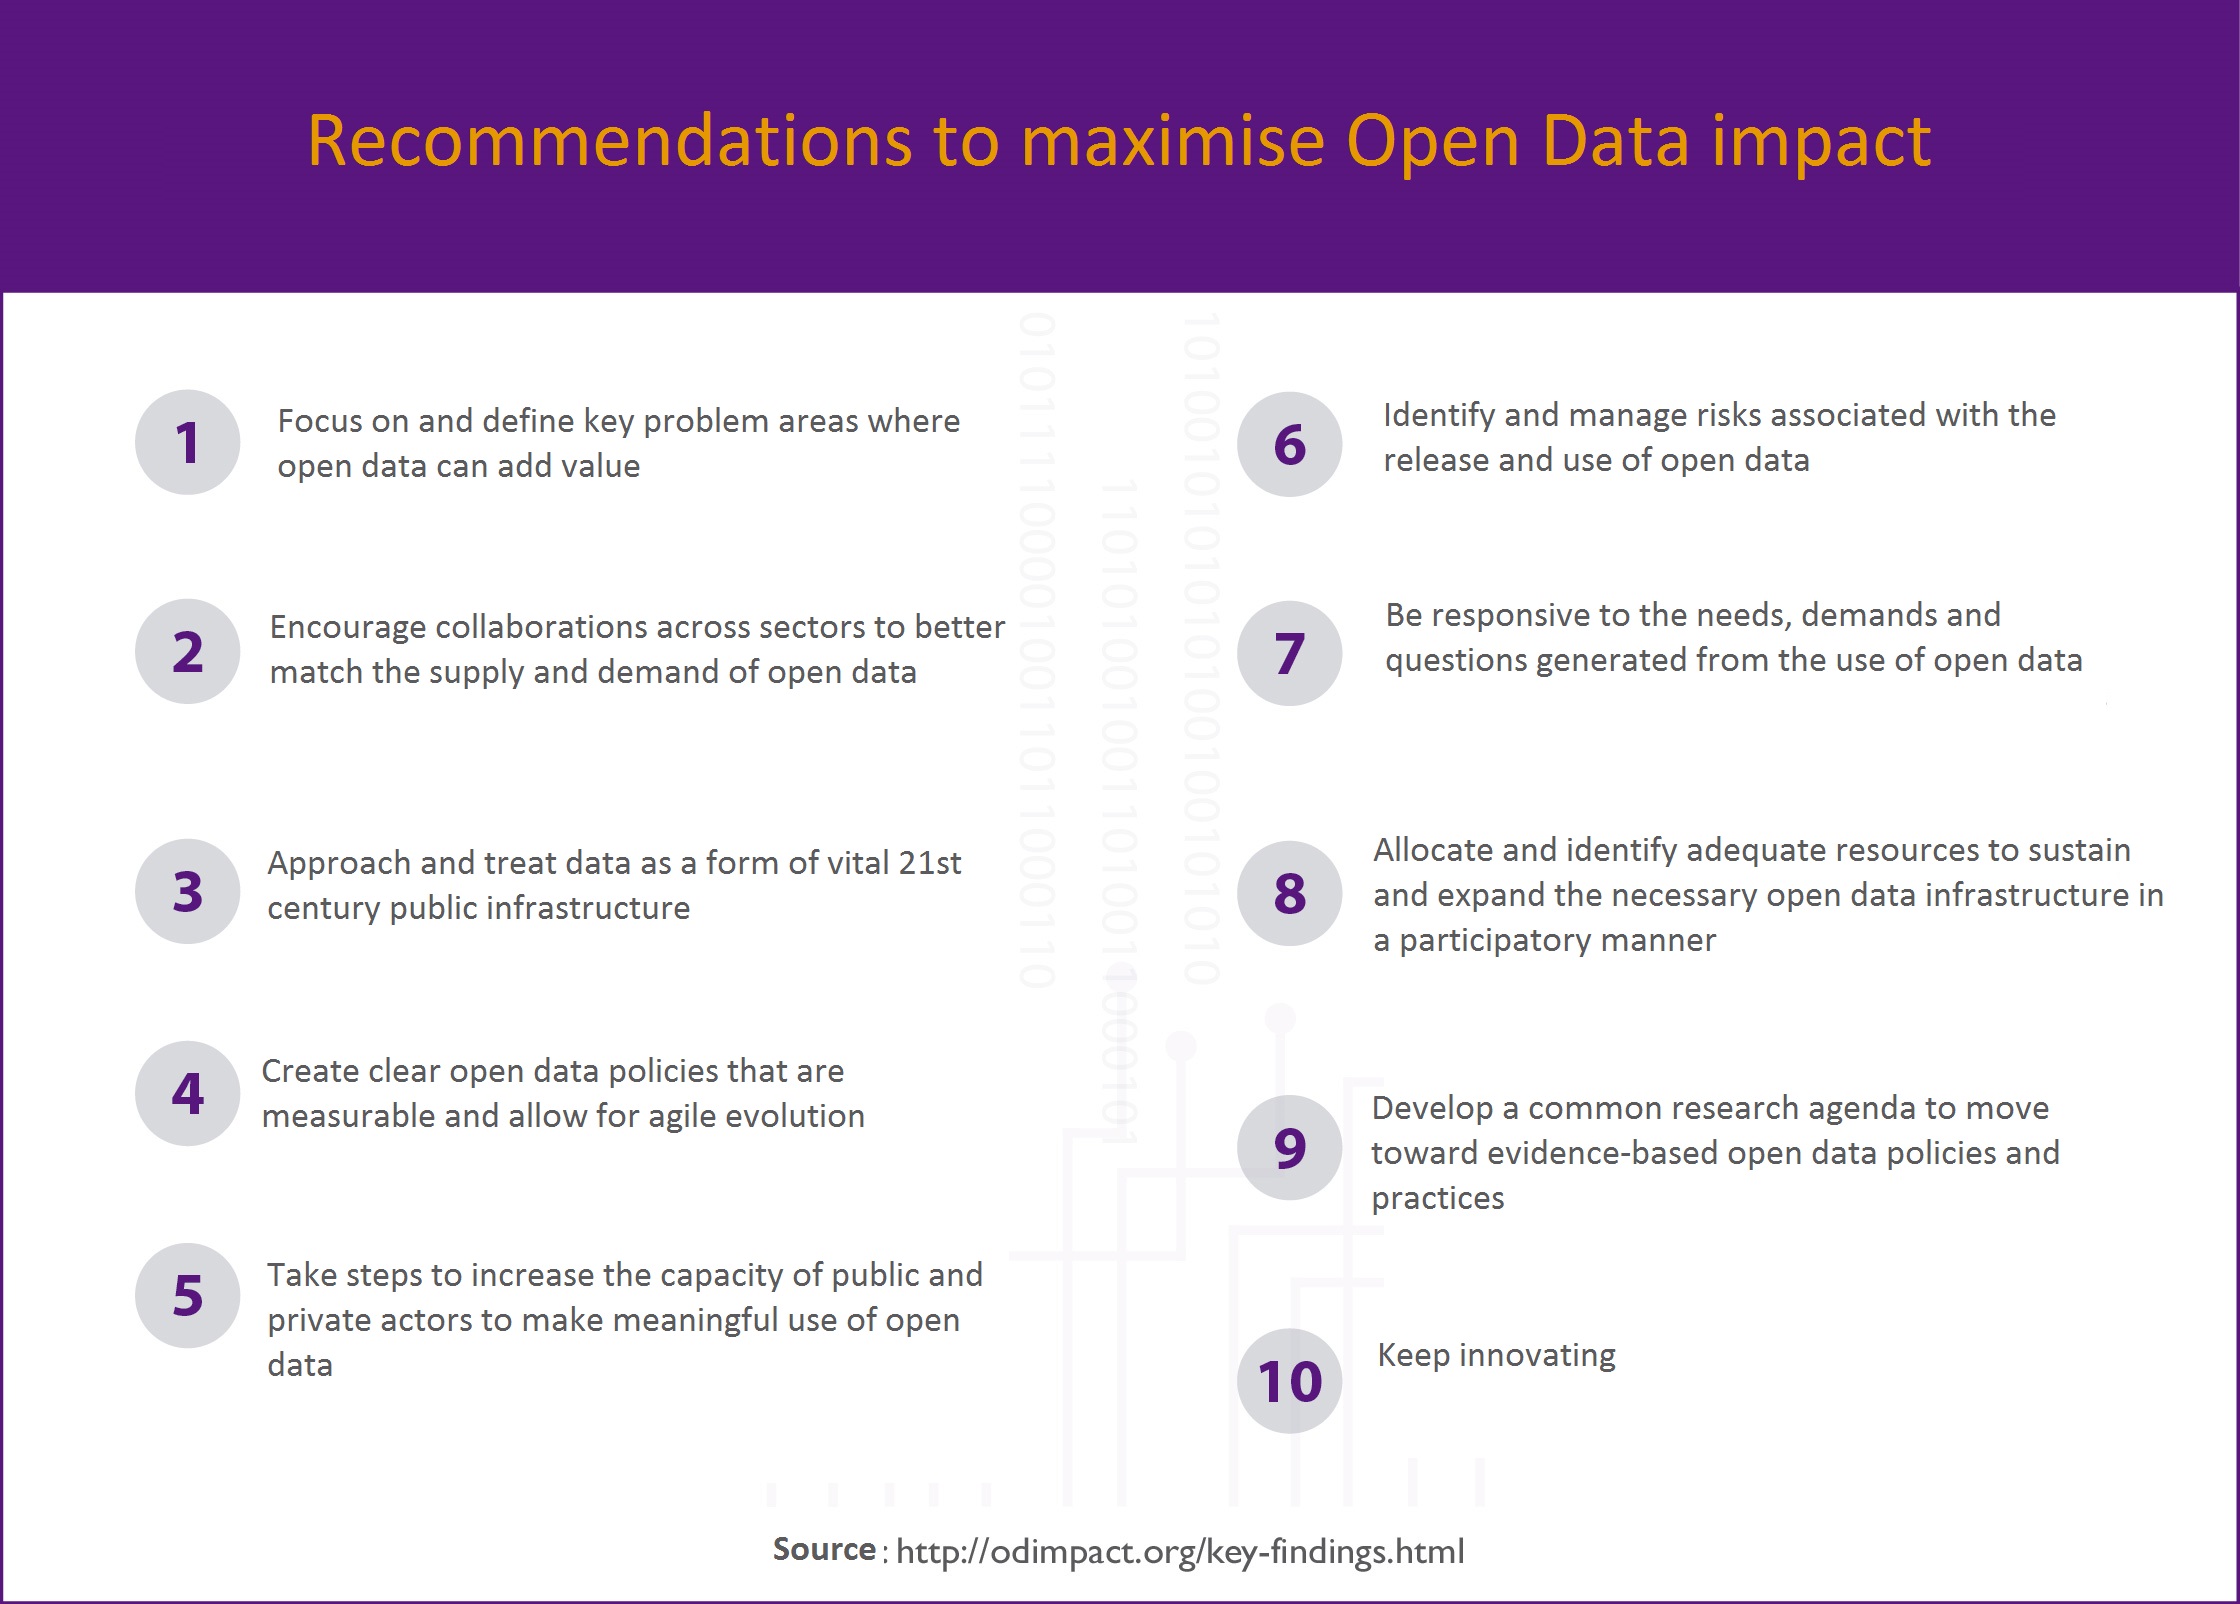
The report concludes with ten recommendations designed for policymakers, advocates, users, and other stakeholders in the open data community. Together with each conclusion, the study includes a few concrete methods of implementation that help turn the general recommendation into real impact. This set of recommendations and methodologies has been called “Next Generation Open Data Roadmap”, a plan which guides the research of open data potential across geographies, sectors and demographics.
Together with the release of the key findings report, Open Data’s Impact has aldo launched an “Additional Resources” section on its website, whose objective is to provide context on the case studies, and to point in the direction of other complementary research, including:
- A “repository of repositories,” other compendiums of open data case studies and sources.
- A compilation of some popular open data glossaries.
- A number of open data research publications and reports, with a particular focus on impact.
- A collection of open data definitions and a matrix of analysis to help assess those definitions.
The team of Open Data’s Impact invite user to participate in this project with their thoughts on the report or at its website. To leave comments or suggestions, user should contact Stefaan Verhulst, Chief Research and Development Officer at The Govlab.