4 documents found
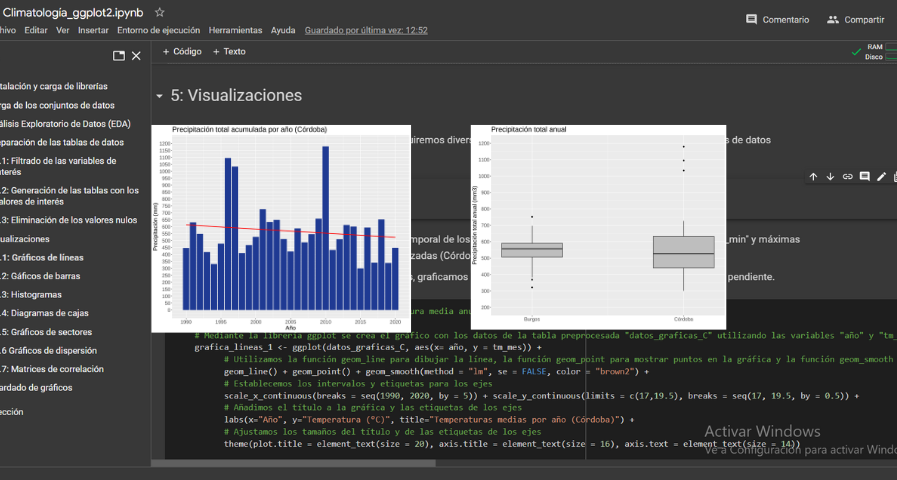
Analysis of meteorological data using the "ggplot2" library
1. Introduction
Visualizations are graphical representations of data that allow the information linked to them to be communicated in a simple and effective way. The visualization possibilities are very wide, from basic representations, such as a line chart, bars or sectors, to visualizations…
- Data exercises
Characteristics of the Spanish University students and most demanded degrees
1. Introduction
Visualizations are graphical representations of data that allow to transmit in a simple and effective way the information linked to them. The visualization potential is very wide, from basic representations, such as a graph of lines, bars or sectors, to visualizations configured on…
- Data exercises

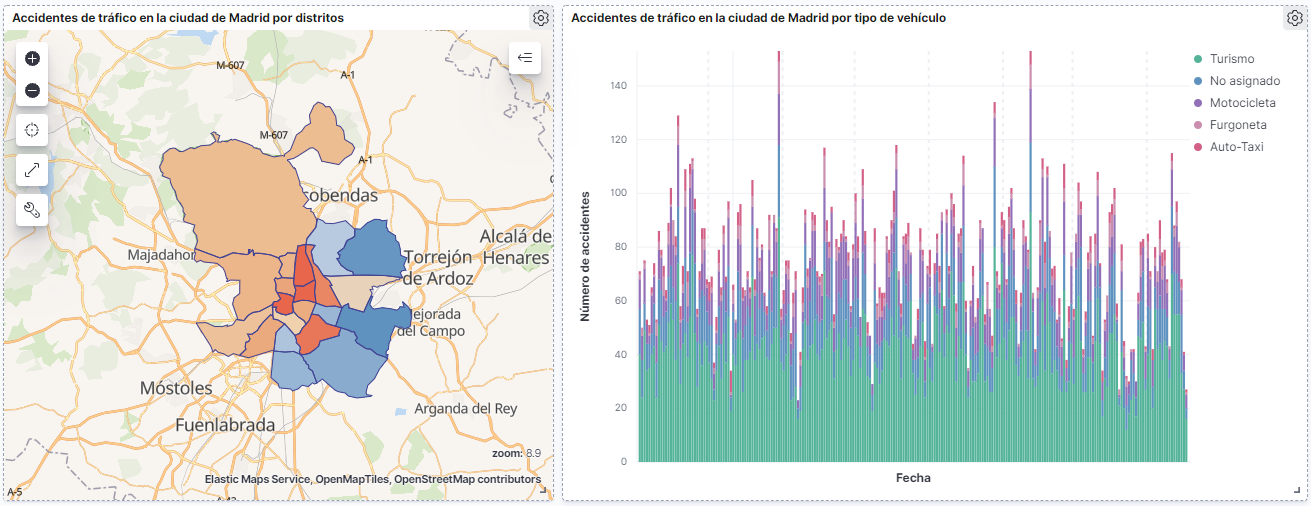
How many accidents occur in the city of Madrid?
1. Introduction
Data visualization is a task linked to data analysis that aims to graphically represent underlying data information. Visualizations play a fundamental role in the communication function that data possess, since they allow to drawn conclusions in a visual and understandable way,…
- Data exercises
Characterization of the employment demand and registered contracting in Spain
1. Introduction
Data visualization is a task linked to data analysis that aims to represent graphically the underlying information. Visualizations play a fundamental role in data communication, since they allow to draw conclusions in a visual and understandable way, also allowing detection of…
- Data exercises
