4 documents found
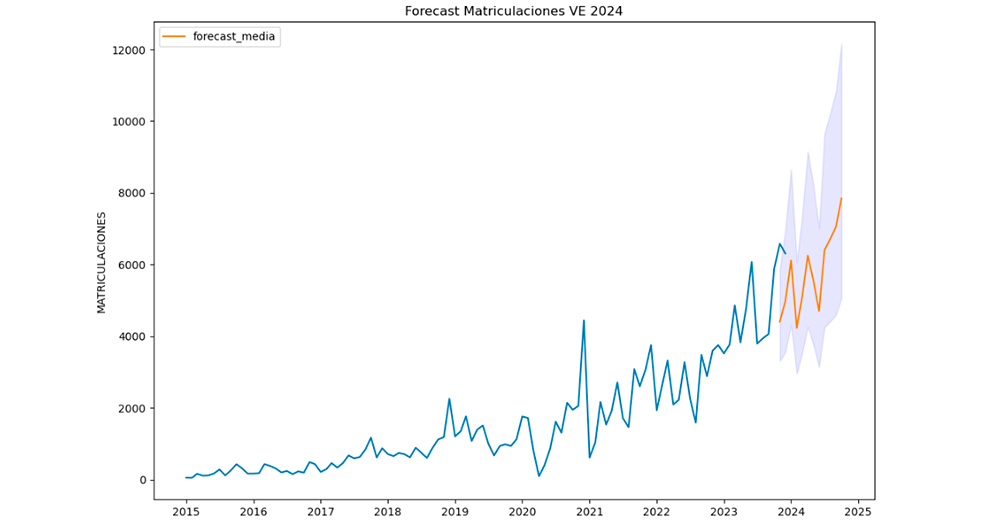
Road to electrification: Deciphering electric vehicle growth in Spain through data analytics
1. Introduction
Visualisations are graphical representations of data that allow to communicate, in a simple and effective way, the information linked to the data. The visualisation possibilities are very wide ranging, from basic representations such as line graphs, bar charts or relevant metrics,…
- Data exercises
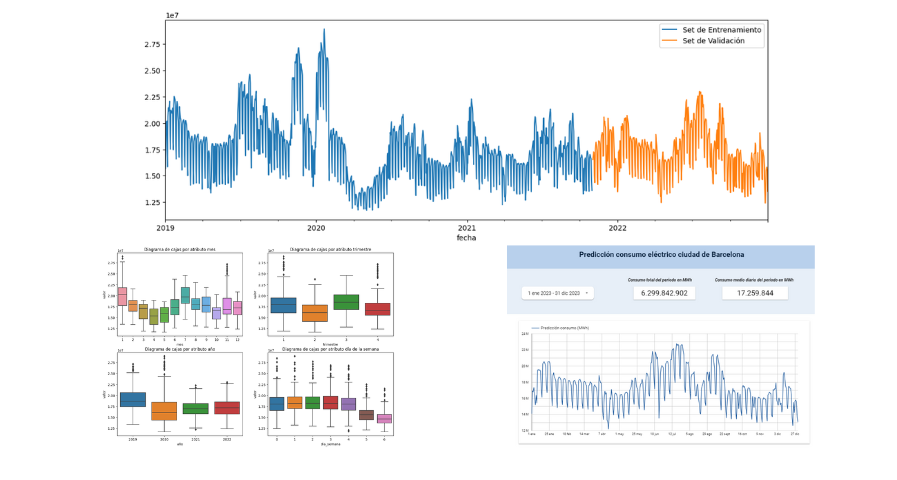
Predictive analisys of electric consuption in the city of Barcelona
1. Introduction
Visualizations are graphical representations of data that allow you to communicate, in a simple and effective way, the information linked to it. The visualization possibilities are very extensive, from basic representations such as line graphs, bar graphs or relevant metrics, to…
- Data exercises
Emerging Technologies and Open Data: Predictive Analytics
In order to extract the full value of data, it is necessary to classify, filter and cross-reference it through analytics processes that help us draw conclusions, turning data into information and knowledge. Traditionally, data analytics is divided into 3 categories:
Descriptive analytics, which…
- Reports and studies

New trends and challenges in the data world
The amount of data we generate does not stop growing. 90% of the data created in the history of humanity were produced during the last year and a 40% annual growth is estimated for the next decade. These figures highlight the importance of data in today's economy and society. The data provide us…
- Reports and studies
