3 documents found
Tourism in Spain: Analyzing National Tourist Flows Using Interactive Visualizations
1. Introduction
Visualizations are graphical representations of data that allow for the simple and effective communication of information linked to them. The possibilities for visualization are very broad, from basic representations such as line graphs, bar charts or relevant metrics, to…
- Data exercises

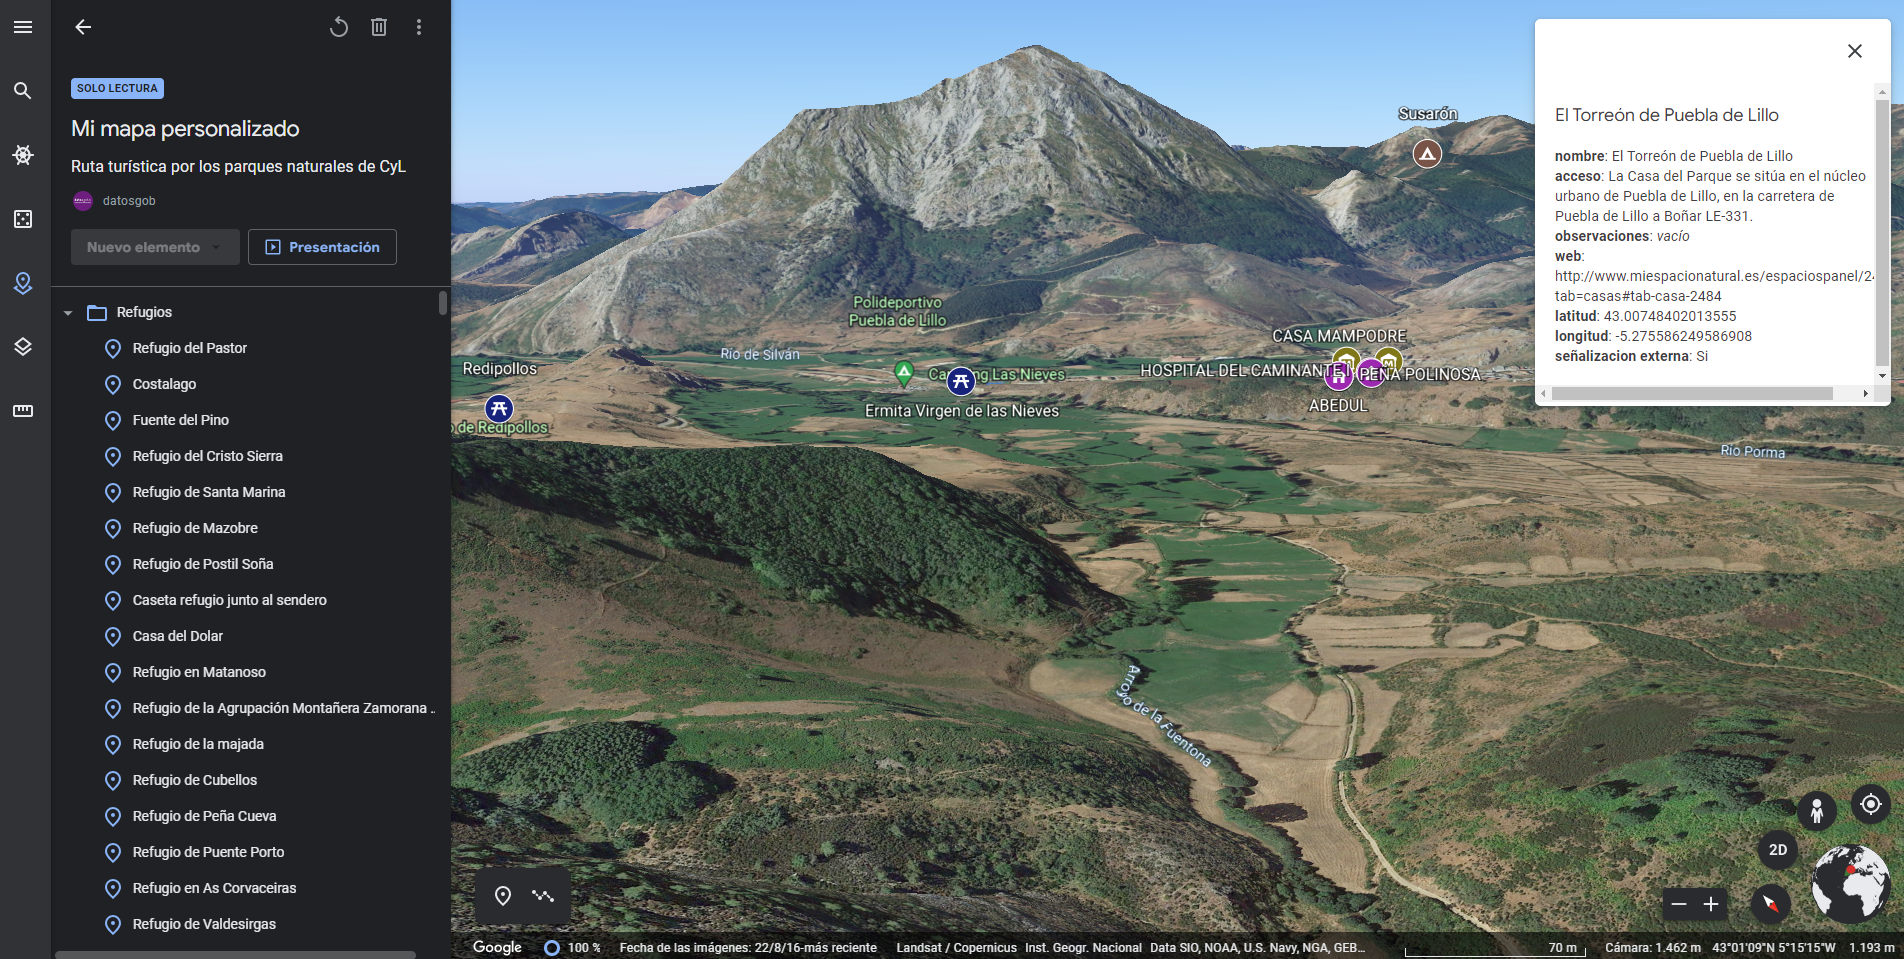
Generating personalized tourist map with "Google My Maps"
1. Introduction
Visualizations are graphical representations of the data allowing to transmit in a simple and effective way related information. The visualization capabilities are extensive, from basic representations, such as a line chart, bars or sectors, to visualizations configured on control…
- Data exercises
New trends and challenges in the data world
The amount of data we generate does not stop growing. 90% of the data created in the history of humanity were produced during the last year and a 40% annual growth is estimated for the next decade. These figures highlight the importance of data in today's economy and society. The data provide us…
- Reports and studies
