Application
Sicma, a climate and environmental information system, is a platform that displays climate scenarios and various variables generated from them. This application is developed entirely with free software and allows users to consult current, past, and future climate conditions, with variable spatial resolution according to the needs of each case (100 by 100 meters in the case of the Canary Islands, and 200 by 200 meters in the case of Andalusia). This makes it possible to obtain local information on the point of intervention.
The information is generated for the scenarios, models, horizons and annual periods considered necessary in each case and with the most appropriate resolution and interpolations for each territory.
Sicma provides information on variables calculated from daily series. To quantify uncertainties, it offers projections generated from ten climate models based on the sixth report of the Intergovernmental Panel on Climate Change (IPCC), each under four future emissions scenarios, known as shared socio-economic pathways (SSPs). Therefore, a total of 40 projections are generated. These climate projections, detailed up to the year 2100, are a very useful tool for planning and managing water, agriculture and environmental conservation.
Users can easily access information on climate scenarios, providing representative data in different territorial areas through a viewer. Some of the variables included in this viewer are: maximum temperature, average temperature, minimum temperature, precipitation, potential evapotranspiration, water balance, hot days (>40ºC) or tropical nights (>22ºC).
In addition to viewing, it is also possible to download data in alphanumeric formats in spreadsheets, graphs, or value maps.
There are currently two open sicma environments:
- Sicma Andalucía: https://andalucia.sicma.red/
- Sicma Canarias: https://canarias.sicma.red/
Noticia
At the end of 2023, as reported by datos.gob.es, the ISTAC made public more than 500 semantic assets, including 404 classifications or 100 concept schemes.
All these resources are available in the Open Data Catalog of the Canary Islands, an environment in which there is room for both semantic and statistical resources and which, therefore, may involve an extra difficulty for a user looking only for semantic assets.
To facilitate the reuse of these datasets with information so relevant to society, the Canary Islands Statistics Institute, with the collaboration of the Directorate General for the Digital Transformation of Public Services of the Canary Islands Government, published the Bank of Semantic Assets.
In this portal, the user can perform searches more easily by providing a keyword, identifier, name of the dataset or institution that prepares and maintains it.

The Bank of semantic assets of the Canary Islands Statistics Institute is an application that serves to explore the structural resources used by the ISTAC. In this way it is possible to reuse the semantic assets with which the ISTAC works, since it makes direct use of the eDatos APIs, the infrastructure that supports the Canary Islands statistics institute.
The number of resources to be consulted increases enormously with respect to the data available in the Catalog, since, on the one hand, it includes the DSD (Data Structures Definitions), with which the final data tables are built; and, on the other hand, because it includes not only the schemes and classifications, but also each of the codes, concepts and elements that compose them.
This tool is the equivalent of the aforementioned Fusion Metadata Registry used by SDMX, Eurostat or the United Nations; but with a much more practical and accessible approach without losing advanced functionalities. SDMX is the data and metadata sharing standard on which the aforementioned organizations are based. The use of this standard in applications such as ISTAC's makes it possible to homogenize in a simple way all the resources associated with the statistical data to be published.
The publication of data under the SDMX standard is a more laborious process, as it requires the generation of not only the data but also the publication keys, but in the long run it allows the creation of templates or statistical operations that can be compared with data from another country or region.
The application recently launched by the ISTAC allows you to navigate through all the structural resources of the ISTAC, including families of classifications or concepts, in an interconnected way, so it operates as a network.
Functionalities of the Semantic Asset Bank
The main advantage of this new tool over the aforementioned registries is its ease of use. Which, in this case, is directly measured by how easy it is to find a specific resource.

Thanks to the advanced search, specific resources can be filtered by ID, name, description and maintainer; to which is added the option of including only the results of interest, discriminating both by version and by whether they are recommended by the ISTAC or not.
In addition, it is designed to be a large interconnected bank, so that, entering a concept, classifications are recommended, or that in a DSD all the representations of the dimensions and attributes are linked.

These features not only differentiate the Semantic Asset Bank from other similar tools, but also represent a step forward in terms of interoperability and transparency by not only offering semantic resources but also their relationships with each other.
The new ISTAC resource complies with the provisions both at national level with the National Interoperability Scheme (Article 10, semantic assets), and at European level with the European Interoperability Framework (Article 3.4, semantic interoperability). Both documents defend the need and value of using common resources for the exchange of information, a maxim that is being implemented transversally in the Government of the Canary Islands.
Training Pill
To disseminate this new search engine for semantic assets, the ISTAC has published a short video explaining the Bank and its features, as well as providing the necessary information about SDMX. In this video it is possible to know, in a simple way and in just a few minutes how to use and get the most out of the new Semantic Assets Bank of the ISTAC through simple and complex searches and how to organize the data to respond to a previous analysis.
In summary, with the Semantic Asset Bank, the Canary Islands Statistics Institute has taken a significant step towards facilitating the reuse of its semantic assets. This tool, which brings together tens of thousands of structural resources, allows easy access to an interconnected network that complies with national and European interoperability standards.
Noticia
The Canary Islands Statistics Institute (ISTAC) has taken a significant step forward in the volume of geographic data thanks to the publication of a total of 4,002 new datasets (3,859 thematic maps and 143 statistical cubes) in datos.gob.es, following its federation in Canarias Datos Abiertos.
This type of initiative is aligned with the European Union's Data Strategy, which establishes the guidelines to achieve a single data market that benefits companies, researchers and public administrations. The automation of publication processes through common standards is key to ensure interoperability and adequate access to open data sets of public administrations.
The generation of these datasets is the culmination of an automation work that has allowed the expansion of the number of published cubes, as now combinations of granularity and year since 2004 are presented. In early October, the ISTAC added to its catalog more than 500 semantic assets and more than 2100 statistical cubes, as we told in this post on datos.gob.es.
In addition, the sets published to date have undergone a renewal process to become the aforementioned 143 statistical cubes. The increase of these datasets not only improves the directory of datos.canarias.es and datos.gob.es in quantitative terms, but also broadens the uses it offers thanks to the type of information added.
The indicators of these cubes are represented on the cartography through choropleth maps and in multiple formats. This automation will, in turn, not only allow other datasets to be published more easily in the future, but also more frequently.
Another of the advances of this work is that the services are generated on the fly from the Geoserver map server, and not through an upload to CKAN, as was done until now, which reduces their storage and speeds up their updating.
How to bring demographic indicators closer to the population
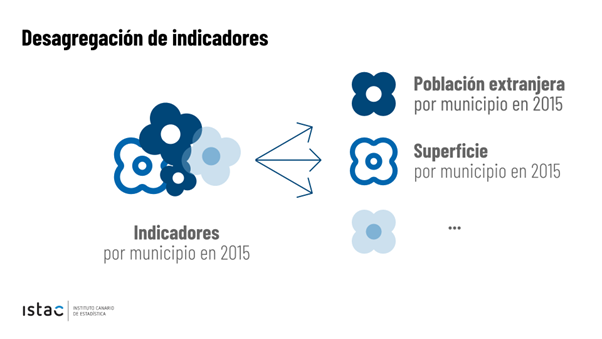
Demographic indicators are dense data cubes that offer a large amount of detailed geographic information, including total population, disaggregated by sex, residence, age and other indices up to a total of 27 different variables.
As so much information is contained in each cube, it can be difficult to represent specific indicators on the cartography, especially if the user is not used to working with certain GIS (Geographical Information System) software.
To bring this content to all types of users, the ISTAC has generated 3,859 new maps, representing on a choropleth map each of the indicators contained in the 143 statistical cubes. The publication of these new cartographic data is thus presented as a more efficient and simplified way of obtaining the information already represented, allowing users to easily access the specific data they need.
We could compare this transformation to flowers. Previously, only whole bouquets were published, with 27 flowers per bouquet, which had to be managed and handled to represent the flowers that were of interest. Now, in addition to continuing to publish the bouquets, new processes have been generated to be able to publish each flower separately, automating the generation of each of these sets, which will also be updated more frequently.
This new option facilitates the use of these choropleth maps (like the one shown in the image) by people without technical GIS knowledge, since they are presented in easily downloadable formats as images (.jpg and .png) for professional, educational or personal use.
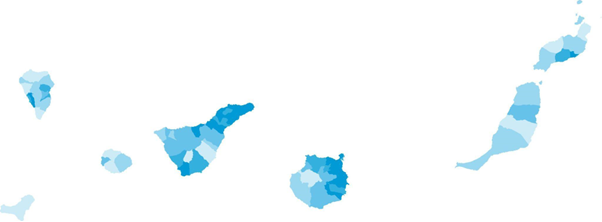

Mapa de población de 65 o más años (% sobre total) por municipios. Año 2022
For more advanced users, ISTAC has also expanded the range of formats in which the original indicator cubes are served. The "bouquets", which previously only showed data in CSV format, now have a wide variety of distributions: KML, GML, GeoPackage, GeoJSON, WFS, WMS. Taking advantage of the benefits provided by the use of styles in the WMS format, all the styles associated with the indicators have been generated, so that, using them, it is possible to represent the same map that is downloaded in image format. These styles are calculated for each indicator-granularity-year combination, according to the method of calculating quantiles for five intervals.
This new approach with both simple and complex geographic data enriches the catalog and allows users without specific knowledge to access and reuse them. In addition, it should be noted that this opens the door to other massive publications of data based on other statistical operations.
In short, this is an important step in the process of opening up data. A process that improves the use and sharing of data, both for the user on the ground and for professionals in the sector. Given the growing need to share, process and compare data, it is essential to implement processes that facilitate interoperability and appropriate access to open data. In this sense, the Canary Islands Institute of Statistics is concentrating its efforts to ensure that its open data sets are accessible and in the appropriate formats for sharing. All this in order to obtain value from them.
Noticia
Public administrations (PAs) have the obligation to publish their open datasets in reusable formats, as dictated by European Directive 2019/1024 which amends Law 37/2007 of November 16, regarding the reuse of public sector information. This regulation, aligned with the European Union's Data Strategy, stipulates that PAs must have their own catalogs of open data to promote the use and reuse of public information.
One of these catalogs is the Canary Islands Open Data Portal, which contains over 7,450 open, free, and reusable datasets from up to 15 organizations within the autonomous community. The Ministry of Agriculture, Livestock, Fisheries, and Food Sovereignty (CAGPSA) of the Government of the Canary Islands is part of this list. As part of its Open Government initiative, CAGPSA has strongly promoted the opening of its data.
Through a process of analysis, refinement, and normalization of the data, CAGPSA has successfully published over 20 datasets on the portal, thus ensuring the quality of information reuse by any interested party.
Analysis, data normalization, and data opening protocol for the Government of the Canary Islands
To achieve this milestone in data management, the Ministry of Agriculture, Livestock, Fisheries, and Food Sovereignty of the Government of the Canary Islands has developed and implemented a data opening protocol, which includes tasks such as:
- Inventory creation and prioritization of data sources for publication.
- Analysis, refinement, and normalization of prioritized datasets.
- Requesting the upload of datasets to the Canary Islands Open Data Portal.
- Addressing requests related to the published datasets.
- Updating published datasets.
Data normalization has been a key factor for the Ministry, taking into account international semantic assets (including United Nations classifications and various agencies or Eurostat) and applying guidelines defined in international standards such as SDMX or those set by datos.gob.es, to ensure the quality of the published data.
CAGPSA has not only put efforts into data normalization and publication but has also provided support to the ministry's personnel in the management and maintenance of the data, offering training and awareness sessions. Furthermore, they have created a manual for data reuse, outlining guidelines based on European and national directives regarding open data and the reuse of public sector information. This manual helps address concerns of the ministry's staff regarding the publication of personal or commercial data.
As a result of this work, the Ministry has actively collaborated with the Canary Islands Open Data Portal in publishing datasets and defining the data opening protocol established for the entire Government of the Canary Islands.
Commitment to Quality and Information Reuse
CAGPSA has been particularly recognized for the publication of the Agricultural Transformation Societies (SAT) dataset, which ranked among the top 3 datasets by the Multisectorial Information Association (ASEDIE) in 2021. This initiative has been praised by the association on multiple occasions for its focus on data quality and management.
Their efforts in data normalization, support to the ministry's staff, collaboration with the open data portal, and the extensive array of datasets, position CAGPSA as a reference in this field within the Canary Islands autonomous community.
At datos.gob.es, we applaud these kinds of examples and highlight the good practices in data opening by public administrations. The initiative of the Ministry of Agriculture, Livestock, Fisheries, and Food Sovereignty of the Government of the Canary Islands is a significant step that brings us closer to the advantages that open data and its reuse offer to the citizens. The Ministry's commitment to data openness contributes to the European and national goal of achieving a data-driven administration.
Entrevista
The Canary Islands Statistics Institute (ISTAC) is the central body of the autonomous statistical system and the official research center of the Government of the Canary Islands. It is in charge of providing statistical information of interest related to the autonomous community, taking into account the singularities of the territory. It also coordinates public statistical activity, facilitating its promotion and management.
Alberto González Yanes, Head of the Economic Statistics Service of the ISTAC, has talked to datos.gob.es to tell us how they work and what is the impact of the data they treasure.
Full interview:
1. Statistical data are considered high-value data by the EU. Moreover, the UN itself has highlighted the importance of having initiatives that generate data focused on local realities. Why do you consider this type of data to be so valuable? What is its potential impact?
Regarding the importance of statistical data, we have to take into account a not very well known issue: they generate duties and rights for citizens, but also for States. For example, we are seeing it right now with the CPI, which entails the duty to pay more rent and, in turn, the right to obtain a higher salary.
In addition, they are instruments with which the States are equipped to be able to know the reality in an objective and independent way. It is important to highlight this role of public statistics as opposed to any different role of other public data, which do not have the same value from the point of view that concerns us. It is not in vain that public statistics appear in the entire constitutional block, from the Magna Carta itself (with its own article), to the different Statutes of Autonomy. Our legislation establishes independent bodies for the production of statistical data and does so by means of a model that could be considered federal, in which there are at least eighteen systems, one for state purposes and seventeen for autonomous and local purposes.
Decentralization is a very important element because it allows support for data-based decision-making in each territory, while state production only reaches, in the best of cases, a provincial scale. If we want a society that generates rights and duties at the autonomous, provincial, island, municipal, and even submunicipal levels, it is essential to support them with reliable local data.
With respect to their impact, we have a current and very significant example. The ISTAC has just published the Registered Active Population Statistics (EPA-Reg), which produces data on the active population at the submunicipal level. This represents a qualitative leap with respect to the EPA, which only reaches a provincial or, at most, insular level for some indicators required by Eurostat and prepared by the Institute under agreement with the INE.
Decentralization is a very important element because it allows support for data-based decision making in each territory.
In EPA-Reg, we construct indicators that approximate the concepts offered by the International Labor Organization when measuring the population and its relationship with economic activity. In this way, information is provided for each neighborhood and each town in the Archipelago. And, undoubtedly, the Local Development Agents, the Employment Councils and the Canary Islands Employment Service itself need these data to make decisions and carry out a better intervention on a small scale.
Decentralization is a very important element because it allows support for data-driven decision making in each territory.
2. The ISTAC has been generating a large amount of statistical data for more than 30 years. How was the process of incorporating the open data philosophy into your daily activity? What challenges did you encounter and how did you overcome them?
Open data has two key elements: on the one hand, making data publicly available and, on the other hand, how to present it in an open format, easily reusable by third parties.
Regarding the first aspect, openness of data is in the genesis of public statistics at the international level. All statistical legislation contemplates the obligation to publish data: the European Statistics Regulation, Law 12/89 on the Public Statistical Function or Law 1/91 on Public Statistics of the Autonomous Community of the Canary Islands, as far as the ISTAC is concerned. But disseminating data is much more than an obligation, it is the reason to exist of statistics. Moreover, it must be done in an egalitarian way, planned in time, with a previously known calendar to guarantee transparency and confidence to the citizens, as well as the security of being able to use these results for decision making.
Another different issue is the formats in which these data were published, which were often closed: PDF, Excel and many others. It is true that statistical offices are used to working with a huge amount of data and this necessarily implies the need to metadocument them in order to try to manage them properly. But good management does not imply that all this information has to be open.
We want to facilitate the information we have, so semantic standardization is born from the beginning, all the data sets are well structured so that they can be reusable.
We have to keep in mind that the first reusers of the data we published were and still are ourselves. Many times, government departments, the ISTAC itself, suffered from format changes or, for example, from having to rescue information from a non-editable pdf, something unsustainable. So, in practice, and even from an egocentric perspective, it became clear to us the need to have open formats for better data management.
We want to facilitate the information we have, so semantic standardization is born from the beginning, all data sets are well structured so that they can be reusable.
And, while we were in that process, open data came to the international limelight, which fitted very well with the moment in which the ISTAC was, so it was decided to move forward on that path. Just as we needed to have good formats and an optimal organization of all the information, we had to offer the same advantages to the end users, to the citizens. Therefore, from the very beginning, in the redefinition of the Institute's entire dissemination strategy, this need was raised, which linked perfectly with the whole open data culture.
And so, around 2008, we proposed a whole public data management system that would allow good metadata management, which has led us, for example, to have 85 metadata for each dataset, of which only a part is disseminated externally. Similarly, at that stage we began to structurally metadata document the datasets, with a first semantic approach (classifications, codes, concepts, etc.). That was the genesis and, over time, through different projects we have achieved that the culture of data openness is incorporated from the design, from the moment the statistical product is being thought up until it is disseminated. We want to facilitate the information we have, so semantic standardization is born from the beginning, all data sets are well structured so that they can be reusable and we are always thinking about how the dissemination will be to facilitate, not only accessibility, but also usability by third parties.The main challenges, initially (2005 - 2006), were internal and technological. We did not have an organizational culture of data management or standardized metadocumentation. Nor were there enough standards or applications on the market to enable us to address the problem. So what we did, through various projects, several of them with European funding, was to set up a whole data infrastructure with different technologies. During this phase, we equipped ourselves with internal standards, adopting international standards such as SDMX (Statistical Data and Metadata eXchange) or DCAT-AP, among others. All in all, we were cooking and building the path we had to follow, which has led us to currently have a very powerful data management system.
3. What is your open data governance process like and what kind of profiles do you have in the team?
We are something like a data factory, which goes through its entire life cycle: capture, processing, i.e., cleaning, cleansing, imputation, integration, georeferencing, generation of information at microdata scale, anonymization, generation of data of all kinds (not only aggregated data in cubes, but also in dashboards, in dashboards, in geographic information...). Therefore, we cover the entire business spectrum within data governance which, as I said before, from start to finish is crossed by the culture of data openness. We know that what we are producing is to make it available to the citizenry. So we have many types of profiles within the organization:
- Surveyors, whose work, the work of all the staff who are in the field, is very important although we don't always emphasize it.
- Traditional profiles of statistical technicians.
- Those that have been incorporated in recent times, linked to data architecture, data engineering, data science and specialists in geographic information systems.
- And, recently, we are incorporating professionals linked to data communication because we have a huge production and dissemination of data, but we want to advance in a fundamental aspect, which is dissemination. The public has the right not only to access, but also to understand the information we produce, so we need to do important work in this regard.
4. The ISTAC is making a strong commitment to facilitate automated access to data through APIs. What impact is this strategy having in terms of data reuse? Do you consider that access via API in combination with downloading data files is the way forward for publishers of statistical data or is one of the two alternatives the preferred one for the type of user who consumes this category of data?
Regarding the use of APIs, from the very beginning, since we started planning our data technology structure, back in 2008, even before they were contemplated in the current Reuse Directive, we decided that all our information would be supported by an API ecosystem. And so it is, we have about eight public APIs, with different methods, and we are going to keep expanding them. We believe in this kind of strategy so much that our own applications are users of our APIs. That means that we don't put parallel APIs to the systems to be consumed by the public, but our systems are also consumers of those APIs. This is an important element, because since you are the first reuser of your APIs, it allows you to discover the limitations and problems of all kinds that may arise when disseminating data through them.
Regarding the impact, we found that it is not enough to make APIs available to the public. Many times some of the people who access work on certain types of data analytics applications such as Tableau, PowerBI, QGIS, QLIK or other commercial or non-commercial ones. So we considered, once we had already made the APIs available, to include connectors for all these types of applications that would facilitate the translation of data to these data analytics systems.
The impact of this instrumentation has been quite powerful because it has made it easier for administrations and private companies to reuse the information published via APIs. Thus, we can find many dashboards all over the Canary Islands that are using these connectors, especially in the tourism sector. As for local entities, for example, the Socioeconomic Observatory of the City Council of Santa Cruz de Tenerife has a Tableau dashboard that is updated with our APIs, with all the municipal indicators. Similarly, there are different experiences in the private sector. We believe that the ecosystem of APIs plus connectors, that tandem, is having an important impact to democratize access to ISTAC data by third parties, mainly for the public sector itself.
Una vez que ya habíamos puesto a disposición las API, nos planteamos incluir conectores para todo ese tipo de aplicaciones que facilitasen la traslación de los datos a esos sistemas de analítica de datos.
Once we had already made the APIs available, we considered including connectors for all these types of applications to facilitate the translation of data to these data analytics systems.
In general, we did not enter into the dilemma of whether downloading files is better than using APIs. For ISTAC, the download itself is an API method, since any dataset can be hot queried or requested for download. The question is not so much the method but the logic of need. For example, when we have the microdata files of a survey, does it make sense to serve it by API? It does, but the logical thing is not to consume it by this method but as a download, to upload it later to the environments in which the analysis of this microdata will be carried out. In this regard, we have in our roadmap to incorporate bulk systems, massive systems of automatic download of all the datasets linked to a given request.
5. In addition to the API, your open data platform has several types of query tools that facilitate access to and use of the data. What can you tell us about them?
As we mentioned earlier, our ultimate goal is to disseminate data. But this mission does not end when we include in a data catalog all the datasets we have, but when we provide citizens with a first approach of simple consultation to these results. In this sense, we have different viewers that make it possible. We have a general viewer that allows us to explore any type of dataset and more specific viewers: the ODS indicators, the Electoral Information System, the Statistical Atlas of the Canary Islands or the Municipal Data Sheets. For us it was and still is important to have a set of generalist or specialized tools for the population that is not a regular user of data analytics systems. These are simple tools, but more than simple table viewers, with which they can access a dataset and consult the most important findings that arise from that dataset.
6. Do you carry out any kind of monitoring of data use, and have you identified any specific use cases?
In planning the new website of the ISTAC there is a whole strategy for monitoring data usage, at least at three levels:
- That of the use of our APIs, which are not currently monitored. This would be the first element because, as we have already pointed out, everything that is going to be consumed will be through APIs.
- Traditional web analytics, consulting each of the pages.
- Citizen interaction with our applications to make hot usability analysis, so that we can distinguish how citizens use the ISTAC system, and from there, make decisions for improvement in that area or implement a system of recommendations.
7. What are the future plans of the ISTAC in terms of open data and reuse?
Regarding future plans in this area we have several lines of work. A first, very important for us is the cooperation with the data ecosystem of the Government of the Canary Islands. In this way, a data governance model is being configured, which is of a federated and cooperative nature, in which four Departments of the Government of the Canary Islands participate: the Directorate General of Modernization and Quality of Services, the Directorate General of Telecommunications and New Technologies, the Directorate General of Transparency and Citizen Participation, and the ISTAC.
In the area of open data, the co-participation with the General Directorates of Transparency and Telecommunications is fundamental. This has led us to accompany them in the semantic standardization of data for the opening of the Canary Islands portal. But the process goes further, we are initiating the assistance and the internal production of the whole API ecosystem of semantic standardization, so that the data sets managed within the Government of the Canary Islands use the same, in compliance with the National Interoperability Scheme, which in its article 10 establishes that the classifications and concepts used by the administrative projects have as a reference the concepts and classifications provided by the statistical system. For us it is important because it implies working already, from the origin, a good management of the semantic quality of the data for its later opening. It is a powerful plan for the future to try to have a better data quality.
We are working intensively on improving the website, on generating a new one aimed at facilitating the understanding of statistical information by the public.
We are working hard to improve the website, to generate a new one aimed at facilitating the understanding of statistical information by citizens.
We are also working on other noteworthy elements: on the one hand, we are going to put in the Open Data Catalog all the classifications and concepts we use, in a reusable format, so that anyone can benefit from this possibility. And on the other hand, we are going to open new APIs, including a very important one, which is the one we use for statistical georeferencing, so that any information can be georeferenced by third parties with the quality that the ISTAC has.
At the same time, we are working hard to improve the website, to generate a new one aimed at facilitating the understanding of statistical information by citizens, beyond disseminating a data catalog as we have done so far. Thus, for example, we will include problems or debates that are arising on a public scale and the corresponding discoveries based on data that we can provide. For example, it is currently being debated whether or not we have overpopulation in the Canary Islands. There, public statistics have a lot to say, but it must be presented in such a way that it is easily understandable. To this end, we are making an important investment, both in web technology and in the basis for the clear communication of statistical information.
Noticia
In recent months, the Canary Islands data initiative strategy has focused on centralization, with the aim of providing citizens with access to public information through a single access point. With this motive launched a new version of their open data portal, data.canarias.es, and have continued to develop projects that display data in a simple and unified way. An example is the Government Organizational Chart that they have recently published.
Interesting data on the organizational structure and policy makers in a single portal
The Organizational chart of the Government of the Canary Islands is a web portal that openly offers information of interest related to both the organic structure and the political representatives in the Government of the Canary Islands. Its launch has been carried out by the General Directorate of Transparency and Citizen Participation, dependent on the Ministry of Public Administrations, Justice and Security of the Government of the Canary Islands.
From the beginning, the Organization Chart has been designed with the opening of data by default, accessibility and usability in mind. The tool consumes data published on the Canary Islands open data portal, such as the salaries of public officials and temporary personnel, through its API. It also includes numerous sections with information on autonomous bodies, public entities, public business entities, commercial companies, public foundations, consortia or collegiate bodies, automatically extracted from the corporate toolDirectory of Administrative Units and Registry and Citizen Services Offices (DIRCAC).
All the content of the Organization Chart is published, in turn, in an automated and periodic way, on the Canary Islands open data portal. The Organizational Chart data is published on the Canary Islands open data portal, as well as the remuneration, the organic structure or the registry and citizen service offices. They are updated automatically, once a month, taking the data from the information systems and publishing them on the open data portal. This configuration is fully parameterizable and can be adapted to the frequency that is considered necessary.
From the organization chart itself, all data can be downloaded both in open and editable format (ODT) and in a format that allows it to be viewed on any device (PDF).
What information is available in the Organization Chart?
Thanks to the Organizational Chart, citizens can find out who is part of the regional government. The information appears divided into eleven main areas: Presidency and the ten ministries.
In the Organizational Chart, the resumes, salaries and declarations of assets of all the high positions that make up the Government are available, in addition to the temporary personnel who work with them. Likewise, the emails, the address of their offices and the web pages of each area are also displayed. All this information is constantly updated, reflecting any changes that occur.
Regarding the agendas for the transparency of public activity, which are accessible from each of the files of public positions in the Organizational Chart, it should be noted that, thanks to the efforts, it has been achieved:
- Update the application so that agendas can be managed from any device (mobile, tablet, PC,…), thereby improving their use by the responsible persons.
- Categorize the events that, in addition, are visually highlighted by a color code, thus facilitating their location by the public.
- Publish immediately, and automatically, all the changes that are made in the agendas in the Organization Chart.
- Incorporate more information, such as the location of the events or the data of the attendees.
- Download the data of the calendars in open formats such as CSV or JSON, or in ICAL format, which will allow adding these events to other calendars.
- Publish all the information of the agendas in the Canary Islands open data portal, including an API for direct consumption.
At the moment, the agendas of the members of the Governing Council, the Vice-counselors and the Vice-counselors have been published, but it is planned that the agendas of the rest of the public positions of the Government of the Canary Islands will be incorporated progressively.
The Organization Chart was presented at the International Congress on Transparency, held last September in Alicante, as an example not only of openness and reuse of data, but also of transparency and accountability. All this has been developed by a team of people committed to transparency, accountability and open data, all principles of Open Government, in order to offer better services to citizens.
Noticia
Local statistical data helps us better understand our environment and identify variations between regions. This is essential to be able to formulate local policies tailored to the specific needs of the local population, something that has even been highlighted by the UN in one of its reports. In this sense, in the datos.gob.es catalog you can find statistical information on different localities and regions, such as the population and housing census, administrative records or even economic indicators.
One of the latest additions to our catalog is the Canary Islands Statistics Institute (Istac), as part of the datos.canarias.es initiative. The institute is the new Canary Islands Open Data Portal that is positioned as the only point of access to open data on the island in collaboration with the rest of the regional public administrations.
At the end of January, datos.canarias.es federated with datos.gob.es, incorporating 7,460 new datasets from the Istac and other organizations on the Island.
What kinds of data sets are available?
The federated data are categorized according to the recommendations of the Application Guide of the Technical Standard for Interoperability for the Reuse of Information Resources and address a wide range of topics related to the territory, the environment, demographics, the economy, and living conditions or the public sector. Shared data is divided into the following categories:
Istac's commitment to open data
The Decree approving the Statistical Plan of the Canary Islands 2018-2022 (PEC-22), establishes that during its execution the reuse of statistical data will be promoted in accordance with the Law on reuse of public sector information. At the same time, it indicates that the Statistical Data and Metadata Infrastructure (eDatos) will be the support for the open and interoperable dissemination of the data published by the statistical activities of the PEC-22, becoming the only channel for the decentralized dissemination of statistics in the corporate websites of the Government of the Canary Islands.
To comply with the aforementioned guidelines, the Istac has made the open data portal of public statistics in the Canary Islands available to the public, which, under the principles of public statistics and data reuse, distributes the data generated in a manner free, in open formats and with licenses that allow its reuse for commercial and non-commercial purposes.
The portal integrates data and metadata based on standardized semantic assets, geographic information and services to promote their use; and it has programmable application interfaces (API) that facilitate the access and download of the information by third parties. In addition to these APIs, it also provides a series of query tools that allow both downloading the data (for example an Extension for QGIS or an R Package), and taking it to another web or application, such as Widgets, Tableau Public or Google Public Data Explorer.
The website also has a statistical indicator viewer. The user can select the information they want to view from a large number of categories, for example, births and deaths, or the workforce. You can also choose the geographic space (the community as a whole or any specific island or municipality), the type of data (annual, interperiodic variation, etc.) and the temporal range. With this information, the tool will generate the graph with the Istac data.
All these tools show the interest of the Istac and the Government of the Canary Islands not only to facilitate access to their data, but also to promote its reuse by developers who want to create value-added products. With its integration in datos.canarias.es, the visibility of the local statistical data of the Canary Islands is promoted, at the same time that access to the data of interest of the entire Autonomous Community is homogenized.
Noticia
The Canary Islands Government has launched the new Canary Islands Open Data Portal, hosted in the domain datos.canarias.es, with more than 7,500 data. This makes it the single access point with the most public information data registered in the whole of Spain. The new Canary Islands Open Data Portal replaces the previous opendata.gobiernodecanarias.org, created in 2015 and with a catalogue of around 190 data. This increase is due to the union in a single portal of data from the Government of the Canary Islands, the Canary Islands Statistics Institute (ISTAC) and the Territorial Information System of the Canary Islands (SITCAN).
The vast majority of these datasets have been federated with datos.gob.es. This means that they are now accessible from our platform and are thus automatically federated with the European Data Portal, boosting their visibility at national and international level. With this action, the Canary Islands has become the autonomous community that federates the most information in datos.gob.es. Specifically, 7,460 data have been added, which represents around 20% of the total available in the catalogue.
datos.canarias.es: a single point of access to island information
The Canary Islands Open Data Portal has been promoted by the Directorate General for Transparency and Citizen Participation, in collaboration with the Directorate General for Telecommunications and New Technologies, both dependent on the Regional Ministry of Public Administrations, Justice and Security; the ISTAC and the Canary Islands Cartographic Company (GRAFCAN).
The objective of datos.canarias.es is to become in the future the only access point to open data in the Canary Islands in collaboration with the rest of the public administrations of the Islands, this being one of the commitments made by the regional government in the IV Open Government Plan of Spain 2020-2024.
Likewise, the graphic identity itself has been renewed, creating a new graphic image as a brand associated with this project that helps to identify and promote the actions developed around the open data of all the public administrations of the Autonomous Community of the Canary Islands.
New functionalities
From datos.canarias.es it is possible to consult and download not only general information, but also statistical and territorial information related to the archipelago, which means that the Canary Islands Government complies with Directive (EU) 2019/1024 of the European Parliament and of the Council of 20 June 2019 on open data and the re-use of public sector information, which prioritises these two categories.
The Director General for Transparency and Citizen Participation of the Canary Islands Government, Marta Saavedra, explains that the new portal presents new features such as data visualisation, which publishes graphs or data views that help to understand and relate the data; the data history section, a small blog where stories will be created based on the information hosted on the portal; or the applications section, a section that shows resources created, and which will be created, such as the School Map, the Crop Map or the Canary Islands Meteorological Observation System, among others.
Another new feature is the presentation of the information organised by statistics, territories and classified into 22 categories. Likewise, the data catalogue section has also been created, where the different sets can be found. This sets are associated a series of metadata such as name, description, formats, licensing or update frequency, allowing the information to be located and understood; and the developers section, dedicated to reusers who work by extracting information from the data in an automated manner.
The Canary Islands has been singled out by the European Open Data maturity indicators as an exemplary government in the opening of data, specifically for the #OpenDataMujeresCanarias project in 2019, which aimed to promote the use of open data to raise awareness, promote gender equality and encourage a balance between free time and work life and an equal distribution of public and private responsibilities between men and women.
From datos.gob.es we invite you to visit the catalogue and discover for yourself all the data of the Government of the Canary Islands.
Evento
The government of the Canary Islands has initiated a project to address public policies on reconciliation and co-responsibility based on open data. Under the title of Open Data Canary Women, the objective is to raise awareness and improve gender equality, promoting the balance of work, family and leisure time, as well as the equitable distribution of public and private responsibilities between men and women.
This project consists of three actions:
The first phase, which took place in January 2019, consisted of a participatory event that brought together different profiles (both professionals and experts in the field and citizens interested in the subject) to explore and analyze the available data.
The objective of this phase is to create a visualization based on open data that reflects a reality or problem for women equality, related to conciliation and co-responsibility. The visualization must include at least one dataset published by a public institution of the Canary Islands (Government of the Canary Islands, Istac, Cabildos, Town Councils, etc.). It should be noted that the submitted works must be under Creative Commons BY license.
Those who wish to participate must form groups of 3 to 5 people, where at least 50% of the participants are residents of the Canary Islands. It is not necessary to be an expert in data, because there will be free training related to data reuse and visualization and mentoring programs for participants who need it.
To participate it is necessary to register through the following form. The deadline for presentation of the visualizations is March 19. On March 21, the creators of each visualization will defend their work in front of a jury made up of experts. There will be simultaneous presentations in Tenerife and Gran Canaria.
The three best works will be exposed in the project Virtual Exhibition, a website that will serve to make public all the work done. In this way, they seek to bring the most relevant data to everyone who wants to consult them.