Entrevista
In this new episode of our podcast, we'll focus on statistical open data. One of the categories of datasets considered to be of high value by the European Union. Today we are going to talk about how this type of data produced by public administrations can become a key tool to better understand reality, make decisions and create new services. We have two guests for this.
- María Santana Álvarez, deputy director general of dissemination and communication en ofthe National Institute of Statistics (INE).
- Alberto González Yanes, deputy director of eStatisticsand DataaAnalysis dat the Canary Islands Institute of Statistics (ISTAC).
Listen to the full podcast (only available in Spanish)
Summary / Transcript of the interview
1. Why is statistical data considered high-value data? What is its potential?
María Santana Álvarez: In this society in which we live, where data surrounds us and information flows so quickly, it is important that official statistics are known and recognized as high-quality and reliable data, and this is achieved by making them accessible to all of society in an open way. This information is useful for informed decision-making and, therefore, statistical data already has a lot of value, but its reuse increases that value and has a great impact on society.
In relation to the data produced by the INE, the statistical operations for which we are responsible cover topics as varied as demography, the economy, the labour market, the environment, the service sector, science and technology, and living conditions, among many other topics. I'm going to give you some Specific examples of statistical operations: Turnover Index, Statistics on R+D activities, Monthly Birth Estimate or the Time Use Survey, in addition to those commonly known as the Consumer Price Index, the Labour Force Survey or the Quarterly accounting. As you can see, official statistical data is of great value and its reuse is essential.
The definition of high-value datasets has reinforced this. These are data that have a great potential for the benefits for society, the environment, the economy and, in fact, one of the categories established in the Regulationsr. It is statistics, which includes sets related to national accounts, demography or inequality - as you can see, the topics I have mentioned above - and in this category most of the datasets are produced by the INE.
Alberto González Yanes: In this century – or this beginning of the new century in which we are living – so saturated with information and data, it is important to take into account the importance of statistics in itself within a democratic society and advanced democratic states. Statistics, as objective and transparent data, are important to be present in open formats, not only for the economy - so that new services can be built - but also to reinforce and continue to strengthen data-based decision-making by not only public administrations, but also by companies and citizens.
One important thing must be taken into account: that the official data, whether published by the INE or by regional institutes such as ISTAC, generates rights and duties. I always give the example of how official data such as the CPI, or the official population figures themselves, generate rights and duties for municipalities, local entities, councils, governments, etc. ,
This level of magnitude, of the importance of statistical data as a fundamental pillar of democratic states - and this is recognised by the United Nations - gives rise to the need for not only the catalogue of the open data set defined by the European Commission's Implementing Regulation to be of high value, but also for all the data produced by official statistics to be considered of high value. Because it is fundamental for democratic states.
2. Can you explain a little more about the role of ISTAC and the INE in the statistical open data ecosystem? What services based on open data do you offer to citizens?
Alberto González Yanes: The regional and state statistical systems are two legs that are coordinated. We have the great Coordination within the system, within the CITE (Interterritorial Statistics Committee). What the autonomous communities do is either reuse the INE's own information, or expand the information that it is not developed at the national level and that it is necessary for regional purposes. We, for example, are one of the major international benchmarks in the production of tourism statistics, in such a way that we even appear within the systems of World Tourism Organization Best Practices. We offer information at the municipal level on tourism that some states do not even have at the national level. The information we have is reused by all the tourist information systems of all public administrations, but also by hotel employers' associations. That includes the Statistics of a tourist accommodation, Survey on Tourism Expenditure, Statistics on Tourist Movements at Canary Islands Borders -which we also developed collaboratively with the National Institute of Statistics, expanding the sample for the case of the Canary Islands- and the Tourist Housing Occupancy Survey. These are the great stars of information in an autonomous community that has a GDP of almost 35% linked to tourism.
María Santana Álvarez: In the case of the INE, all our production is offered openly through the website, which is the main meeting point with our users. Proof of this is that last year, in 2025, it received more than 42 million visits. All the data we produce is disseminated according to the publication schedule of statistical operations, free of charge and under an open license.
I like to talk about this topic in such a pedagogical way, taking Tim Berners-Lee's five stars as a reference and making an analogy between the INE's dissemination system and how we are climbing the ladder in that system. The current INE dissemination system is the result of many years of evolution and in this evolution we have opted for the development of tools that make reuse effective.
Starting with Tim Berners-Lee's stars, one star is that you produce the data and disseminate it openly under a license that allows reuse, but that is not enough for reusers to be able to effectively and easily make use of it. Two stars would be to offer the aggregated data we produce in proprietary formats such as excel and pc-axis. The three stars would be csv, in flat formats. And we come to the fourth star, which is to make information accessible through URI. The URLs are URIs and in the case of the INE we have a JSON API for all the aggregated data we produce.
In relation to this, I do want to comment on the advantages of having a JSON API. In our case, access is provided to the metadata and aggregated data that we produce. This involves an automatic and direct exploitation of all the information we produce. The data is updated according to the calendar; Regardless of when a user accesses that web service, they will find the latest data that is available. Users who use this system can customize their queries and filter through the metadata that defines tables and series.
Nor have we forgotten the great R User Community in data science. That's why we've produced a package called INEapir, which incorporates all the functionalities of the JSON API and makes it easier for these reusers to work with our data in an environment that they already know, in systems and data structures to which they are accustomed.
In addition, soon, all the documentation related to the API, will not only be in the current format that we have on the website, but also in OpenAPI with Swagger. This will allow access to our API information in a more interactive and intuitive way for all those users who are used to using general APIs.
Alberto González Yanes: It is important to note, first of all, that all statistical data is public by nature, because state statistical regulations – Law 12/1989 – or regional regulations require it to do so. In our case, we have different initiatives that allow reuse. From an ecosystem of about 10 or 15 APIs supported by international standards such as SDMX (Statistical Data and Metadata Exchange), which allows you to take all the information we produce, including the entire open data catalog: management APIs, all the cartography... We have everything in that API ecosystem to which we obviously incorporate connectors, be it Python, or R, with different libraries or specific connectors for some market solutions, to facilitate reuse by third parties in dashboards.
For us it is also important, apart from opening the data, open the entire part of Semantic Assets. We manage concepts, classifications, registration designs... For us, the Reuse of the entire part of classifications and concepts, apart from all statistical data. One of the main reusers of this entire system is the Government of the Canary Islands itself, incorporating, from the base, from the electronic forms of the electronic administration - and this is sometimes little known - all the standardised classifications that we have. They are doing this through the API of services that we have.
Therefore, we have different proposals, not only for access to data, but also for data processing and normalization.
3. How do you work to ensure interoperability between your statistical systems, and also with international organizations, such as Eurostat?
María Santana Álvarez: Before, I have been using Tim Berners-Lee's system to tell our level of openness in the INE's dissemination system. I stayed at the fourth star, but in that system there are five stars. And precisely That fifth star guarantees interoperability. From the point of view of dissemination, data that are subject to a National or international classification, such as the National Classification of Economic Activities, from Education, or Occupations u other standards that have been approved by the INE, such as the codes of the Autonomous Communities, provinces and municipalities, will always be accompanied by this metadata. Therefore, The data produced by other actors in this national statistical system that use these same classifications, codes, etc., will be interoperable with each other. That is from the point of view of dissemination, but also from the point of view of production, because in this national statistical system of which the INE is part, we all have to transmit to Eurostat what data we collect and disseminate, aggregated data. This way of establishing interoperability begins long before dissemination, that is, when new statistical operations are established or grouped together, directives and regulations are developed in which methodologies and concepts are established that all Member States have to use. This ensures that when we transmit the microdata or the aggregated results to Eurostat, it is already known that we have taken those same concepts, those same standards as a basis.
As for the transmission we do, to make it even more standard, SDMX and DSD are used based on data structures and lists of standard codes to ensure comparability and consistency in official European statistics.
Alberto González Yanes: As María has said, interoperability is a key and fundamental issue within public statistics. He spoke of the standardization of SDMX, which is fundamental and has been a reference even for the W3C, to draw up interoperability standards and ontologies. He spoke of the creation of codes and classifications that are not only usable among us, but also usable by the rest of the public sector. And there I link it a lot with the competence that public statistics has in terms of semantic standardization, according to the National Interoperability Scheme in article 10.3.
In this sense, as we take them seriously, the Interterritorial Statistics Committee proposed the creation of a statistical interoperability node at the national level, which would facilitate not only the exchange of information between the different statistical bodies of the Spanish State, but also the transmission of administrative data for statistical purposes from the public administrations to the statistical system. It is a benchmark project at European level. It was funded by the European Commission and we hope that throughout 2026 we will begin to deploy the different actions for the development of the node as a reference element at European level.
4. What are the main current challenges in opening statistical data?
María Santana Álvarez: I have previously commented that all our production of aggregate data from statistical operations, and also certain Anonymized microdata, are published openly. However, the INE has much more information to offer, but given its nature it cannot be done openly. I am referring to the Sensitive microdata.
Let's see a little bit of legal basis in this matter because it is a very sensitive issue. In 2022 there was an amendment to the Public Statistical Function Law, through which statistical services can grant research entities access to confidential data. These data do not allow the direct identification of the units and can only be used to carry out scientific studies of public interest, in addition to the fact that certain requirements must be met to be able to access them. In fact, the statistical services evaluate whether it is possible to provide this information, that is, we are very rigorous in giving access to this data. To give you an idea, the INE managed more than 80 requests for this type of access to confidential microdata last year and a high percentage of these were considered viable.
In addition, the INE is the coordinator of a project called It is _DataLlab, arising from a agreement signed by the Tax Agency, Social Security, the Bank of Spain and the Public Employment Service. All these organizations are large producers of official statistics, but also holders of a large volume of administrative records. Es_DataLlAB offers researchers the access to sensitive microdata sets resulting from the combination of different databases of at least two of the agencies that we have signed this agreement, but this cannot be offered openly for reasons of confidentiality and statistical secrecy.
What challenge is on the horizon to be able to provide this type of data, that is, microdata at the level of the reporting unit in an open way, without posing a problem of confidentiality, of statistical secrecy? The solution would be synthetic populations. In fact, at the INE we are working on the construction of these synthetic populations: populations that reproduce the statistical characteristics of the real population, but the records do not correspond to a real reporting unit. It is something fictitious, but that, when statistical analyses are done, have the same characteristics as real populations. This would be a way to openly publish microdata at this level of detail, without having to go through the evaluation committees that we have right now and the restrictions that must be complied with by current legislation.
5. Finally, how do you see the evolution of open data in the coming years? What technological or methodological innovations do you think will transform public statistics?
Alberto González Yanes: I think that, in addition, - and we take out that reflection in the National Open Data Meeting when it was held here in Lanzarote – another challenge that we have ahead of us in public statistics is the issue of facilitate the reuse of protected private data by data owners. The Portability concept, which is restricted within public statistics. There is no such concept. While the right of access to confidential data for scientific purposes is included and strengthened by the European regulation, the right of portability is not included. It is true that this is a look beyond the concept of open data, which is assimilated with public data, with certain criteria to facilitate its reuse, but what better reuse than what a company can do, for example, of the data we have in the public statistics itself? That data we have could be put in their information systems. We must bear in mind that, many times, we have more data from companies than they do, especially in a business structure based on SMEs, such as in the Canary Islands, where companies do not have those gigantic analytical capabilities, or simply to link it with the concept of data economy and put that data on the market. and that profit can be generated from data that we have deposited in our databases. That would require, possibly, a longer-sighted action in ten or fifteen years.
Alberto González Yanes: We can't end this podcast without talking about artificial intelligence, which seems to be the buzzword in recent years and it's like that for a reason. I think there is a technological disruption in this regard. We have the great challenge of incorporating data and statistical information into generative AI systems, especially to avoid the hallucinations or bias that is occurring in many of them. In addition, as generative AI does not hesitate, but affirms, in some cases data is raised that is not true and can lead to reputational problems, because they say "INE source" or "ISTAC source" and it is not true. So we have the great challenge of accompanying or improving generative artificial intelligence systems to avoid this bias.
Another great challenge is also to teach citizens in the literacy of the use of these systems. Not only for data access, but also code and transformations are generated based on datasets that we provide and sometimes the calculations are also poorly done.
María Santana Álvarez: This same reflection is shared internationally and for this reason working groups have begun to be created for the construction of guides that read, interpret and respond appropriately with respect to the questions asked from official statistical data. This requires the use of internationally common metadata and the construction of technology that interprets it properly. Told in a summarized way, it seems little, but the challenge is important and the implementation is not trivial. Of course, it will be worth seeing how it develops and the impact it will have on society.
Meanwhile, at the INE we are committed to improving the description of web pages, the metadata of our time series, tables, etc., and creating components so that search engines can find our information in a more efficient and accurate way.
Interview clips
1. What open data services does the INE offer to the public?
2. What is ISTAC’s role in the open statistical data ecosystem? What is its relationship with the INE?
Application
This web application is designed for the interactive analysis of open data of general interest in Spain, published by official bodies. The information is organized by topic, and each dataset is presented using dashboards that facilitate the exploration, consultation, and visualization of data according to different variables and criteria.
The aim is to bring public data closer to citizens, researchers, and professionals, promoting transparency, informed decision-making, and the reuse of knowledge. All this is done with a visual and accessible approach that allows users to quickly and easily understand the main results of each topic.
This is a constantly evolving project: new topics and analyses are added periodically, and user comments and suggestions are taken into account to improve the experience and expand the scope of the content.
Blog
The year 2023 was undoubtedly the year of artificial intelligence. This has brought data, and therefore open data, back to the forefront, as it is the raw material that fuels this technology, which is key to value creation in our increasingly digital economy.
Perhaps that is why 2023 has also left us a number of new developments in terms of the drive to open data, many of which could lead to the creation of significant economic and social value through re-use. One of these developments is the obligation for public sector bodies to open in the first half of 2024 a number of high-value datasets, already specified in a regulation that was published in the last few days of 2022 in order to implement the provisions of open data directive (2019). Specifically, there are six high-value thematic categories: geospatial, earth observation and environmental, meteorology, statistics, companies and company ownership and mobility.
In order to comply with this obligation and with the rest of the obligations set out in Directive 2019/1024, in 2023, Spain has amended the Law 37/2007 on the re-use of public sector information has been amended in Spain in 2023. This amendment emphasises the duty to encourage the openness of high-value data published under an open data attribution licence (CC BY 4.0 or equivalent), in machine-readable format and accompanied by metadata describing the characteristics of the datasets.
The European Statistical System and the National Statistical Plan 2021-2024
Of the six thematic categories, number four, Statistics, is dedicated to statistical datasets, characterised by their broad definition and specification. It is based on the European Statistical System which ensures that European statistics produced in all Member States are reliable, following common criteria and definitions and treating data in an appropriate way, so that they are always comparable between EU countries. Specifically, the regulation defines 21 statistical datasets as high-value (it actually includes 22, but one of them is redundant as it is broken down into three components: population, fertility and mortality).
The National Statistical Institute] is part of the European Statistical System and is in charge of the production of the harmonised national statistics that Eurostat then compiles and analyses to provide comparable figures, so that Community policies can be defined, implemented and analysed.
In Spain, the National Statistical Plan is the main instrument that organises the statistical activity of the General State Administration, the backbone of statistics for state purposes. The current plan was published at the end of 2020, covering the 2021-2024 period.
The National Statistical Plan 2021-2024 includes new strategic lines such as the use of new sources of information, including, for example, Big Data and massive databases. It also promotes new production models, such as experimental statistics, and incorporates a special focus on the inclusion of gender, disability, age and nationality perspectives, as well as improvements in real estate market information, especially on rentals.
High-value statistical datasets
In these strategic lines, the plan does not yet contain any mention of high-value datasets. However, as the plan is developed and implemented through specific annual programmes detailing the statistical operations to be carried out, their objectives, the bodies involved, and the budget appropriations statistical operations to be carried out, their objectives, the bodies involved and the budget appropriations needed to finance them, it is possible to get an idea of which of these statistical operations are aligned with the 21 categories of high value Ssatistical datasets regulation.
The following table shows the possible equivalences:
| High-value statistical datasets | Equivalence in the Inventory of Statistical Operations (IOE) |
|---|---|
| Industrial production | IOE 30050 data sheet, Industrial Production Indices |
| Industrial producer price index breakdowns by activity | IOE 30051 data sheet , Industrial Price Indices |
| Volume of sales by activity | Partially covered by IOE 32092 data sheet Statistics on Sales, Employment and Wages in Large enterprises and SMEs and 32096 data sheet, Daily Domestic Sales. |
| EU International trade in goods statistics | There does not seem to be a clear correspondence in the plan, as the planned statistical operations on international trade are focused on services, while trade in goods is worked out in terms of trade between EU Member States. However, part of the specified data could be found in the IOE 30029 data sheet, Annual National Accounts of Spain: Main Aggregates, although perhaps at a higher level of aggregation than required. |
| Tourism flows in Europe | Many similarities with what is defined in the IOE 16028 data sheet, Statistics on Tourist Movements at Borders (FRONTUR) and 16023, Residents' Tourism Survey (ETR/FAMILITUR). |
| Harmonised Indices of consumer prices | IOE 30180 data sheet, Harmonised Index of Consumer Prices (HICP). |
| National Accounts - key indicators on GDP | IOE 30029 data sheet, Annual National Accounts of Spain: Main Aggregates. |
| National accounts - key indicators on corporations | |
| National accounts- key indicators on households | |
| Government expenditure and revenue | It is reflected in the three IOE data sheets on the settlement of budgets of the different levels of public administration: 31125 data sheet, Budget Settlement Statistics of the State and its Public Bodies, Companies and Foundations; 31030 datasheet Budgets Settlement of the Autonomous Communities (MHAC); and 31026 Budgets Settlement of Local Entities (MHAC). |
| Consolidated government gross debt | |
| Environmental accounts and statistics | It is reflected in the eight data sheet (from 30084 to 30095) of the inventory of statistical operations regarding Environmental Accounts. View listing here. |
| Population | IOE 30264 data sheet, Basic Demographic Indicators. |
| Fertility | |
| Mortality | IOE 30271 data sheet, Mortality Tables. |
| Current healthcare expenditure | IOE 54012 data sheet, Satellite Accounts of Public Health Expenditure |
| Poverty | IOE 30453 data sheet, Living Conditions Survey (LCS). |
| Inequality | |
| Employment | There are quite a few statistical operations that study the labor market, of which the IOE 0308 Labor Force Survey stands out. |
| Unemployment | |
| Potential labour force | IOE 30308 data sheet, Labor force Survey, which also contains worksheet 30309 data sheet, Community Labour Force Survey (CLFS). |
En definitiva, parece que la mayor parte de las variables clave que el reglamento europeo ha previsto para los conjuntos estadísticos de alto valor están ya produciéndose de acuerdo con el plan estadístico nacional vigente. El plan estadístico nacional, que sucederá al actualmente vigente, comenzará en 2025 y a buen seguro se publicará a lo largo de este 2024. Este año veremos en Europa un intenso trabajo para cumplir con las obligaciones del reglamento, ya que, además, la Comisión Europea ha publicado recientemente el informe "Identification of data themes for the extensions of public sector High-Value Datasets" donde se incluyen siete nuevas categorías que se estudia considerar como datos de alto valor y que previsiblemente acabarán siendo incluidas en el reglamento.
All in all, it seems that most of the key variables that the European regulation has foreseen for high value statistical datasets are already being produced according to the existing national statistical plan. The national statistical plan, which will succeed the current one, will start in 2025 and will most likely be published in the course of 2024. This year will see intense work in Europe to comply with the obligations of the regulation, as the European Commission has also recently published the report "Identification of data themes for the extensions of public sector High-Value Datasets" which includes seven new categories that are being considered as high-value datasets and are expected to be included in the regulation and which will foreseeably end up being included in the regulation.
Content prepared by Jose Luis Marín, Senior Consultant in Data, Strategy, Innovation & Digitalization. The contents and views reflected in this publication are the sole responsibility of the author.
Blog
Data is a valuable source of knowledge for society. Public commitment to achieving data openness, public-private collaboration on data, and the development of applications with open data are actions that are part of the data economy, which seeks the innovative, ethical, and practical use of data to improve social and economic development.
It is as important to achieve public access and use of data as it is to properly convey that valuable information. To choose the best chart for each type of data, it is necessary to identify the type of variables and the relationship between them.
When comparing data, we must ensure that the variables are of the same nature, i.e., quantitative or qualitative variables, in the same unit of measurement, and that their content is comparable.
We present below different visualizations, their usage rules, and the most appropriate situations to use each type. We address a series of examples, from the simplest ones like bar charts to less well-known charts like heat maps or stacked comparisons.
Bar charts
A visualization that represents data using two axes: one that collects qualitative or time data and another that shows quantitative values. It is also used to analyze trends because one of the axes can show temporal data. If the axes are flipped, a column chart is obtained.
Best practices:
- Display the axis value labels and reserve labels as tooltips for secondary data.
- Use it to represent less than 10 value points. When visualizing more value points, a line chart may be more appropriate.
- Clearly differentiate real data from estimates.
- Combine with a line chart to show trends or averages.
- Place the one with longer descriptions on the vertical axis, when no variable is temporal.
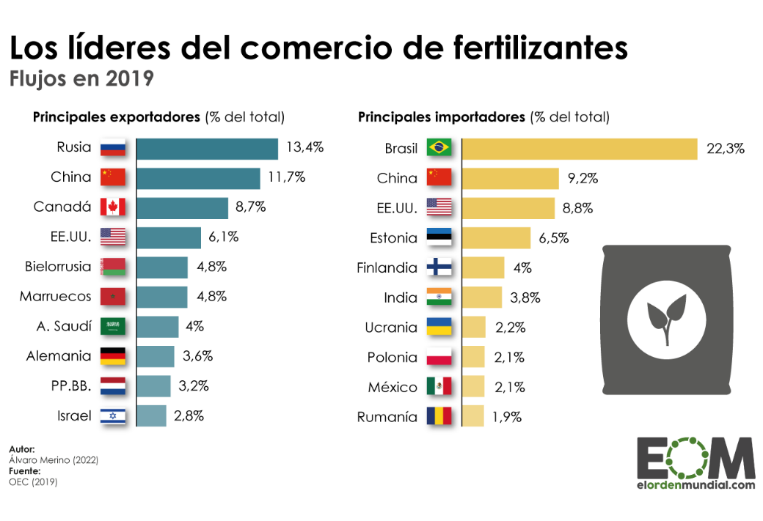
Source: El Orden Mundial https://elordenmundial.com/mapas-y-graficos/comercio-fertilizantes-mundo/
Clustered bar charts
A type of bar chart in which each data category is further divided into two or more subcategories. Therefore, the comparative scenario encompasses more factors.
Best practices
- Limit the number of categories to avoid showing too much information on the chart.
- Introduce a maximum of three or four subcategories within each category. In case more groupings need to be shown, the use of stacked bars or a set of charts can be considered.
- Choose contrasting colors to differentiate the bars of each subcategory.
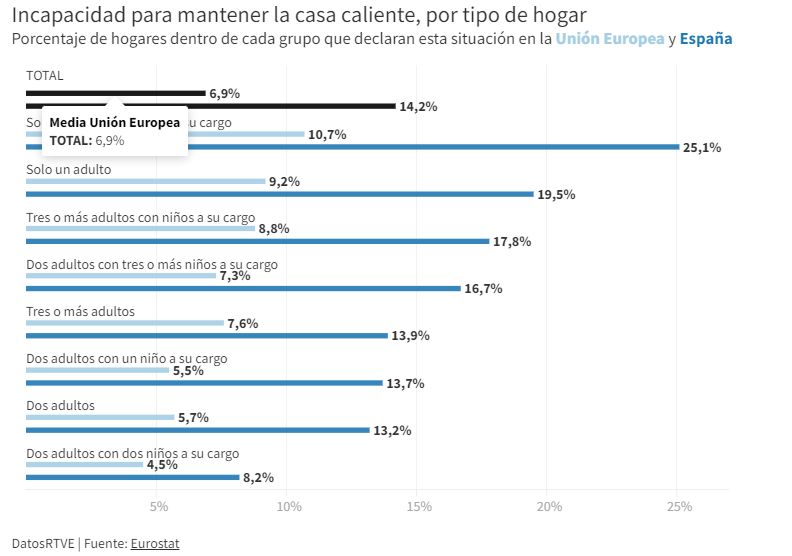
Source: RTVE https://www.rtve.es/noticias/20230126/pobreza-energetica-espana/2417050.shtml
Cumulative comparison charts
These charts display the composition of a category in a cumulative manner. In addition to providing a comparison between variables, these charts can show the segmentation of each category. They can be either stacked bar charts or cumulative area charts.
Best practices
- Avoid using stacked bar charts when comparing segments of each category to each other. In that case, it is better to use multiple charts.
- Limit the number of subcategories in stacked bar charts or segments in area charts.
- Apply contrast in colors between categories and adhere to accessibility principles.
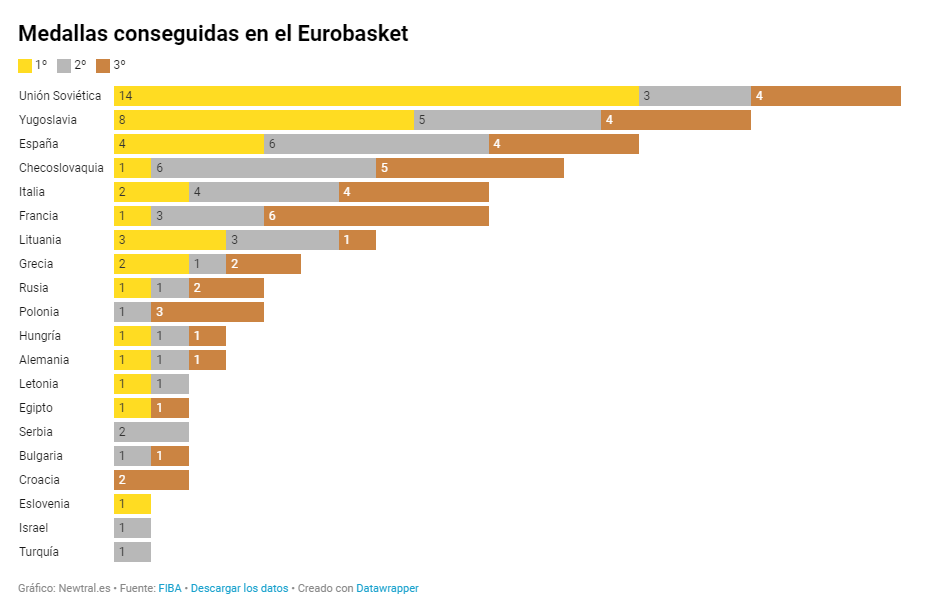
Source: Newtral https://www.newtral.es/medallas-espana-eurobasket/20220917/
Population pyramid
A combination of two horizontal bar charts that share a vertical axis representing the initial value and display two values that grow symmetrically on either side.
Best practices
- Define a common ordering criterion such as age.
- Represent the data in absolute numbers or percentages to take into account that the sum of the two values being compared represents the total.
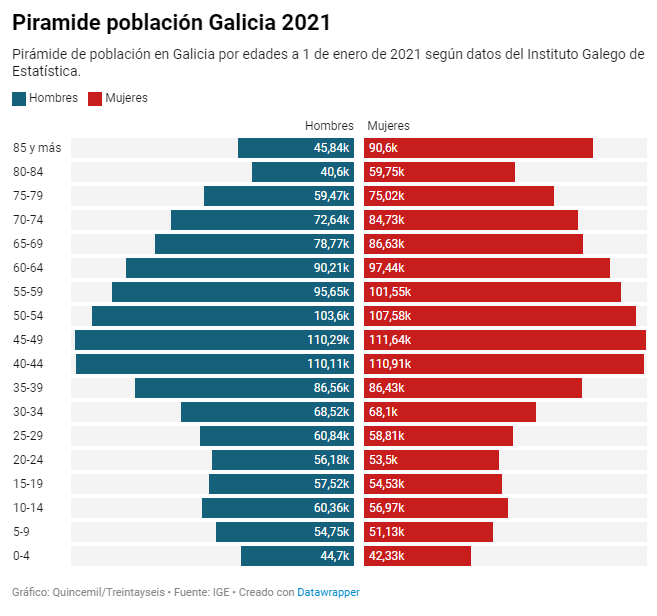
Source: El Español https://www.elespanol.com/quincemil/articulos/actualidad/asi-es-la-alarmante-piramide-de-poblacion-de-galicia-en-2021
Radar chart
Circular visualization formed by polar axes that are used to represent measurements with categories that are part of the same theme. From each category, radial axes converge at the central point of the chart.
Good practices:
- Keep numerical data within the same range of values to avoid distorting a chart.
- Limit the number of categories in data series. An appropriate number could be between four and seven categories.
- Group categories that are related or share a common hierarchy in one sector of the radar chart.
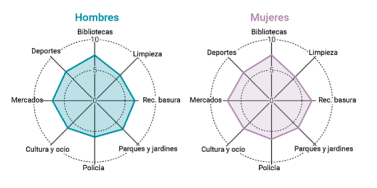
Source: Guía de visualización de datos para Entidades Locales https://redtransparenciayparticipacion.es/download/guia-de-visualizacion-de-datos-para-entidades-locales/
Heatmap
A graphical representation in table format that allows for the evaluation of two different dimensions differentiated by degrees of color intensity or traffic light codes.
Good practices:
- Indicate the value in each cell because color is only an indicative attribute. In interactive graphics, values can be identified with a pop-up label.
- Include a scheme or legend in the graphic to explain the meaning of the color scale.
- Use accessible colors for everyone and with recognizable semantics such as gradients, hot-cold, or traffic light colors.
- Limit or reduce the represented information as much as posible.

Source: eldiario.es https://www.eldiario.es/sociedad/clave-saturacion-primaria-ratios-mitad-medicos-asignados-1-500-pacientes_1_9879407.html
Bubble chart
A variation of the scatter plot that, in addition, represents an additional dimension through the size of the bubble. In this type of chart, it is possible to assign different colors to associate groups or separate categories. Besides being used to compare variables, the bubble chart is also useful for analyzing frequency distributions. This type of visualization is commonly found in infographics when it is not as important to know the exact data as it is to highlight the differences in the intensity of values.
Good practices:
- Avoid overlapping bubbles so that the information is clear.
- Display value labels whenever possible and the number of bubbles allows for it.
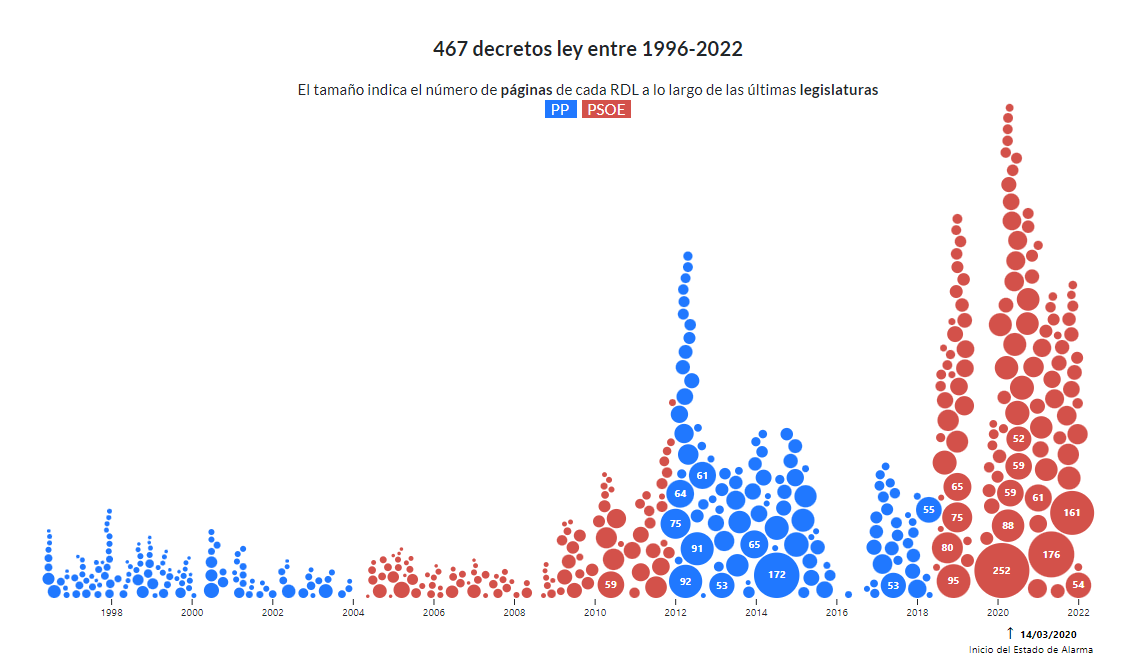
Source: Civio https://civio.es/el-boe-nuestro-de-cada-dia/2022/07/07/decretos-ley-desde-1996/
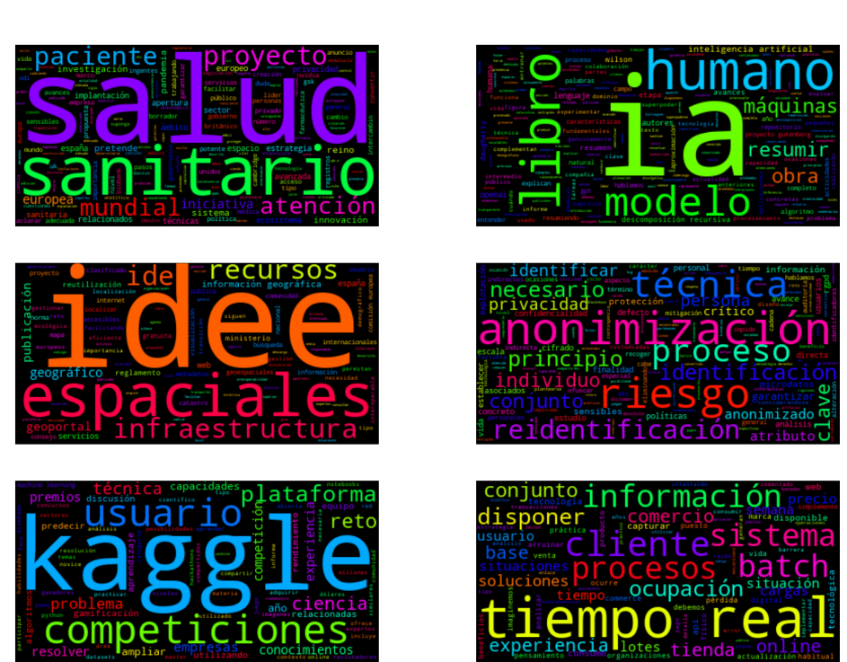
Word cloud
A visual graphic that displays words in varying sizes based on their frequency in a dataset. To develop this type of visualization, natural language processing (NLP) is used, which is a field of artificial intelligence that uses machine learning to interpret text and data.
Good practices:
- It is recommended to use this resource in infographics where showing the exact figure is not relevant but a visual approximation is.
- Try to make the length of the words similar to avoid affecting perception.
- Make it easier to read by showing the words horizontally.
- Present the words in a single color to maintain a neutral representation.
This graphic visualization, which we published in a step-by-step article, is a word cloud of several texts from datos.gob.es.
So far, we have explained the most common types of comparison charts, highlighting examples in media and reference sources. However, we can find more visualization models for comparing data in the Data Visualization Guide for Local Entities, which has served as a reference for creating this post and others that we will publish soon. This article is part of a series of posts on how to create different types of visualizations based on the relationship of the data and the objective of each exercise.
As the popular mantra goes, "a picture is worth a thousand words," which could be adapted to say that "a chart is worth a thousand numbers." Data visualization serves to make information understandable that, a priori, could be complex.
Entrevista
The Canary Islands Statistics Institute (ISTAC) is the central body of the autonomous statistical system and the official research center of the Government of the Canary Islands. It is in charge of providing statistical information of interest related to the autonomous community, taking into account the singularities of the territory. It also coordinates public statistical activity, facilitating its promotion and management.
Alberto González Yanes, Head of the Economic Statistics Service of the ISTAC, has talked to datos.gob.es to tell us how they work and what is the impact of the data they treasure.
Full interview:
1. Statistical data are considered high-value data by the EU. Moreover, the UN itself has highlighted the importance of having initiatives that generate data focused on local realities. Why do you consider this type of data to be so valuable? What is its potential impact?
Regarding the importance of statistical data, we have to take into account a not very well known issue: they generate duties and rights for citizens, but also for States. For example, we are seeing it right now with the CPI, which entails the duty to pay more rent and, in turn, the right to obtain a higher salary.
In addition, they are instruments with which the States are equipped to be able to know the reality in an objective and independent way. It is important to highlight this role of public statistics as opposed to any different role of other public data, which do not have the same value from the point of view that concerns us. It is not in vain that public statistics appear in the entire constitutional block, from the Magna Carta itself (with its own article), to the different Statutes of Autonomy. Our legislation establishes independent bodies for the production of statistical data and does so by means of a model that could be considered federal, in which there are at least eighteen systems, one for state purposes and seventeen for autonomous and local purposes.
Decentralization is a very important element because it allows support for data-based decision-making in each territory, while state production only reaches, in the best of cases, a provincial scale. If we want a society that generates rights and duties at the autonomous, provincial, island, municipal, and even submunicipal levels, it is essential to support them with reliable local data.
With respect to their impact, we have a current and very significant example. The ISTAC has just published the Registered Active Population Statistics (EPA-Reg), which produces data on the active population at the submunicipal level. This represents a qualitative leap with respect to the EPA, which only reaches a provincial or, at most, insular level for some indicators required by Eurostat and prepared by the Institute under agreement with the INE.
Decentralization is a very important element because it allows support for data-based decision making in each territory.
In EPA-Reg, we construct indicators that approximate the concepts offered by the International Labor Organization when measuring the population and its relationship with economic activity. In this way, information is provided for each neighborhood and each town in the Archipelago. And, undoubtedly, the Local Development Agents, the Employment Councils and the Canary Islands Employment Service itself need these data to make decisions and carry out a better intervention on a small scale.
Decentralization is a very important element because it allows support for data-driven decision making in each territory.
2. The ISTAC has been generating a large amount of statistical data for more than 30 years. How was the process of incorporating the open data philosophy into your daily activity? What challenges did you encounter and how did you overcome them?
Open data has two key elements: on the one hand, making data publicly available and, on the other hand, how to present it in an open format, easily reusable by third parties.
Regarding the first aspect, openness of data is in the genesis of public statistics at the international level. All statistical legislation contemplates the obligation to publish data: the European Statistics Regulation, Law 12/89 on the Public Statistical Function or Law 1/91 on Public Statistics of the Autonomous Community of the Canary Islands, as far as the ISTAC is concerned. But disseminating data is much more than an obligation, it is the reason to exist of statistics. Moreover, it must be done in an egalitarian way, planned in time, with a previously known calendar to guarantee transparency and confidence to the citizens, as well as the security of being able to use these results for decision making.
Another different issue is the formats in which these data were published, which were often closed: PDF, Excel and many others. It is true that statistical offices are used to working with a huge amount of data and this necessarily implies the need to metadocument them in order to try to manage them properly. But good management does not imply that all this information has to be open.
We want to facilitate the information we have, so semantic standardization is born from the beginning, all the data sets are well structured so that they can be reusable.
We have to keep in mind that the first reusers of the data we published were and still are ourselves. Many times, government departments, the ISTAC itself, suffered from format changes or, for example, from having to rescue information from a non-editable pdf, something unsustainable. So, in practice, and even from an egocentric perspective, it became clear to us the need to have open formats for better data management.
We want to facilitate the information we have, so semantic standardization is born from the beginning, all data sets are well structured so that they can be reusable.
And, while we were in that process, open data came to the international limelight, which fitted very well with the moment in which the ISTAC was, so it was decided to move forward on that path. Just as we needed to have good formats and an optimal organization of all the information, we had to offer the same advantages to the end users, to the citizens. Therefore, from the very beginning, in the redefinition of the Institute's entire dissemination strategy, this need was raised, which linked perfectly with the whole open data culture.
And so, around 2008, we proposed a whole public data management system that would allow good metadata management, which has led us, for example, to have 85 metadata for each dataset, of which only a part is disseminated externally. Similarly, at that stage we began to structurally metadata document the datasets, with a first semantic approach (classifications, codes, concepts, etc.). That was the genesis and, over time, through different projects we have achieved that the culture of data openness is incorporated from the design, from the moment the statistical product is being thought up until it is disseminated. We want to facilitate the information we have, so semantic standardization is born from the beginning, all data sets are well structured so that they can be reusable and we are always thinking about how the dissemination will be to facilitate, not only accessibility, but also usability by third parties.The main challenges, initially (2005 - 2006), were internal and technological. We did not have an organizational culture of data management or standardized metadocumentation. Nor were there enough standards or applications on the market to enable us to address the problem. So what we did, through various projects, several of them with European funding, was to set up a whole data infrastructure with different technologies. During this phase, we equipped ourselves with internal standards, adopting international standards such as SDMX (Statistical Data and Metadata eXchange) or DCAT-AP, among others. All in all, we were cooking and building the path we had to follow, which has led us to currently have a very powerful data management system.
3. What is your open data governance process like and what kind of profiles do you have in the team?
We are something like a data factory, which goes through its entire life cycle: capture, processing, i.e., cleaning, cleansing, imputation, integration, georeferencing, generation of information at microdata scale, anonymization, generation of data of all kinds (not only aggregated data in cubes, but also in dashboards, in dashboards, in geographic information...). Therefore, we cover the entire business spectrum within data governance which, as I said before, from start to finish is crossed by the culture of data openness. We know that what we are producing is to make it available to the citizenry. So we have many types of profiles within the organization:
- Surveyors, whose work, the work of all the staff who are in the field, is very important although we don't always emphasize it.
- Traditional profiles of statistical technicians.
- Those that have been incorporated in recent times, linked to data architecture, data engineering, data science and specialists in geographic information systems.
- And, recently, we are incorporating professionals linked to data communication because we have a huge production and dissemination of data, but we want to advance in a fundamental aspect, which is dissemination. The public has the right not only to access, but also to understand the information we produce, so we need to do important work in this regard.
4. The ISTAC is making a strong commitment to facilitate automated access to data through APIs. What impact is this strategy having in terms of data reuse? Do you consider that access via API in combination with downloading data files is the way forward for publishers of statistical data or is one of the two alternatives the preferred one for the type of user who consumes this category of data?
Regarding the use of APIs, from the very beginning, since we started planning our data technology structure, back in 2008, even before they were contemplated in the current Reuse Directive, we decided that all our information would be supported by an API ecosystem. And so it is, we have about eight public APIs, with different methods, and we are going to keep expanding them. We believe in this kind of strategy so much that our own applications are users of our APIs. That means that we don't put parallel APIs to the systems to be consumed by the public, but our systems are also consumers of those APIs. This is an important element, because since you are the first reuser of your APIs, it allows you to discover the limitations and problems of all kinds that may arise when disseminating data through them.
Regarding the impact, we found that it is not enough to make APIs available to the public. Many times some of the people who access work on certain types of data analytics applications such as Tableau, PowerBI, QGIS, QLIK or other commercial or non-commercial ones. So we considered, once we had already made the APIs available, to include connectors for all these types of applications that would facilitate the translation of data to these data analytics systems.
The impact of this instrumentation has been quite powerful because it has made it easier for administrations and private companies to reuse the information published via APIs. Thus, we can find many dashboards all over the Canary Islands that are using these connectors, especially in the tourism sector. As for local entities, for example, the Socioeconomic Observatory of the City Council of Santa Cruz de Tenerife has a Tableau dashboard that is updated with our APIs, with all the municipal indicators. Similarly, there are different experiences in the private sector. We believe that the ecosystem of APIs plus connectors, that tandem, is having an important impact to democratize access to ISTAC data by third parties, mainly for the public sector itself.
Una vez que ya habíamos puesto a disposición las API, nos planteamos incluir conectores para todo ese tipo de aplicaciones que facilitasen la traslación de los datos a esos sistemas de analítica de datos.
Once we had already made the APIs available, we considered including connectors for all these types of applications to facilitate the translation of data to these data analytics systems.
In general, we did not enter into the dilemma of whether downloading files is better than using APIs. For ISTAC, the download itself is an API method, since any dataset can be hot queried or requested for download. The question is not so much the method but the logic of need. For example, when we have the microdata files of a survey, does it make sense to serve it by API? It does, but the logical thing is not to consume it by this method but as a download, to upload it later to the environments in which the analysis of this microdata will be carried out. In this regard, we have in our roadmap to incorporate bulk systems, massive systems of automatic download of all the datasets linked to a given request.
5. In addition to the API, your open data platform has several types of query tools that facilitate access to and use of the data. What can you tell us about them?
As we mentioned earlier, our ultimate goal is to disseminate data. But this mission does not end when we include in a data catalog all the datasets we have, but when we provide citizens with a first approach of simple consultation to these results. In this sense, we have different viewers that make it possible. We have a general viewer that allows us to explore any type of dataset and more specific viewers: the ODS indicators, the Electoral Information System, the Statistical Atlas of the Canary Islands or the Municipal Data Sheets. For us it was and still is important to have a set of generalist or specialized tools for the population that is not a regular user of data analytics systems. These are simple tools, but more than simple table viewers, with which they can access a dataset and consult the most important findings that arise from that dataset.
6. Do you carry out any kind of monitoring of data use, and have you identified any specific use cases?
In planning the new website of the ISTAC there is a whole strategy for monitoring data usage, at least at three levels:
- That of the use of our APIs, which are not currently monitored. This would be the first element because, as we have already pointed out, everything that is going to be consumed will be through APIs.
- Traditional web analytics, consulting each of the pages.
- Citizen interaction with our applications to make hot usability analysis, so that we can distinguish how citizens use the ISTAC system, and from there, make decisions for improvement in that area or implement a system of recommendations.
7. What are the future plans of the ISTAC in terms of open data and reuse?
Regarding future plans in this area we have several lines of work. A first, very important for us is the cooperation with the data ecosystem of the Government of the Canary Islands. In this way, a data governance model is being configured, which is of a federated and cooperative nature, in which four Departments of the Government of the Canary Islands participate: the Directorate General of Modernization and Quality of Services, the Directorate General of Telecommunications and New Technologies, the Directorate General of Transparency and Citizen Participation, and the ISTAC.
In the area of open data, the co-participation with the General Directorates of Transparency and Telecommunications is fundamental. This has led us to accompany them in the semantic standardization of data for the opening of the Canary Islands portal. But the process goes further, we are initiating the assistance and the internal production of the whole API ecosystem of semantic standardization, so that the data sets managed within the Government of the Canary Islands use the same, in compliance with the National Interoperability Scheme, which in its article 10 establishes that the classifications and concepts used by the administrative projects have as a reference the concepts and classifications provided by the statistical system. For us it is important because it implies working already, from the origin, a good management of the semantic quality of the data for its later opening. It is a powerful plan for the future to try to have a better data quality.
We are working intensively on improving the website, on generating a new one aimed at facilitating the understanding of statistical information by the public.
We are working hard to improve the website, to generate a new one aimed at facilitating the understanding of statistical information by citizens.
We are also working on other noteworthy elements: on the one hand, we are going to put in the Open Data Catalog all the classifications and concepts we use, in a reusable format, so that anyone can benefit from this possibility. And on the other hand, we are going to open new APIs, including a very important one, which is the one we use for statistical georeferencing, so that any information can be georeferenced by third parties with the quality that the ISTAC has.
At the same time, we are working hard to improve the website, to generate a new one aimed at facilitating the understanding of statistical information by citizens, beyond disseminating a data catalog as we have done so far. Thus, for example, we will include problems or debates that are arising on a public scale and the corresponding discoveries based on data that we can provide. For example, it is currently being debated whether or not we have overpopulation in the Canary Islands. There, public statistics have a lot to say, but it must be presented in such a way that it is easily understandable. To this end, we are making an important investment, both in web technology and in the basis for the clear communication of statistical information.
Noticia
The Cantabrian Institute of Statistics (ICANE in its Spanish acronym) has been one of the latest additions to the National Catalogue of Open Data. From now on, users of datos.gob.es can access statistical information on the Autonomous Community in reusable formats from our portal.
ICANE, a commitment to open and linked statistical data
The ICANE is the public body in Cantabria responsible for the production and dissemination of statistics related to society and the economy in the region. On its website, we can find population figures, economic accounts or data related to education and health. These data are shown in tables and graphs, which are easy to understand but not always easy to reuse.
For this reason, the ICANE has also launched an open data space, where statistical information is offered in formats and structures that favour its reuse. This is a linked data portal, which offers data through dereferenceable URIs on the Web. The concepts are linked to other repositories such as Eurostat, DBpedia or Geonames. This provides users with more related and contextual information, which facilitates the creation of new knowledge.
Users can access the published data either manually, using a search engine or filtering by tags, or automatically from the list of datasets produced in CKAN, through its API, or through an RDF browser. ICANE also has a SPARQL Endpoint.
Indicators and statistics available to all re-users
The ICANE catalogue currently has more than 350 datasets, divided into different categories. The data linked to the economy (216) and with a regional component (211) stand out. Some examples of datasets offered in open access are the Annual Wage Structure Survey, the Living Conditions Survey (LCS) or the Environmental Indicators.
Both data and metadata are provided in six different formats (HTML, JSON, RDF, XLS, PC-AXIS and SDMX), oriented both to automated machine processing and direct human readability.
The conditions for re-use are set out in the Legal Notice of the Cantabrian Statistics Institute. Some of the conditions for its use are citing the source of the documents or not altering or suppressing the metadata related to the date of update and the conditions of reuse, among others.
ICANE's presence in datos.gob.es and other catalogues to increase its visibility
In June this year, ICANE began its harvest with datos.gob.es, so that its datasets are now accessible from the National Catalogue of Open Data. With this move, not only does it improve the visibility of its datasets nationally, but also internationally, as datos.gob.es automatically federates with the data.europe.eu. In this way, the initiatives that register in our portal see how their datasets are also accessible from the European portal, without the need to carry out any additional management.
To guarantee the quality of its data, ICANE carries out a two-stage publication process: the information is stored in a test databank to be checked against official sources before being published in production. The import of the datasets from ICANE's Web Data Bank and Metadata API into the Open Data Portal is a fully automated process and monitored on a daily basis.
In addition to datos.gob.es, ICANE has also registered its databank as a dataset in The Data Hub, the open catalogue promoted by Datopian and The Open Knowledge International.
Why is the publication of local statistical data important?
The value of open statistical data has been highlighted by a multitude of bodies. From the European Union, which highlights them as high-value datasets in its Directive on open data and re-use of public sector information, to the UN, which drives their openness through a specific working group, promoted by its Statistical Commission. Statistical data allow us to better understand our environment and to make informed decisions.
In our country, the main body that provides statistical information is the National Statistics Institute (INE, in its Spanish acronym), which has more than 8,000 datasets in our catalogue. Like the ICANE, the INE also has an open data space on its website where it shares the Inventory of Statistical Operations, statistical information compiled by itself and published in INEbase, anonymised microdata from surveys and the Electoral Census Street Map.
But just as important as national statistical information is local statistical information. As the UN stated in one of its reports, this type of data can provide more segmented information on specific geographical areas, which is of great value when it comes to understanding differences between regions and being able to formulate fairer local and national policies.
In this sense, regional statistical bodies such as ICANE or the Canary Islands Institute of Statistics (Istac), which also federates a large amount of useful data with datos.gob.es, are essential. We hope that in the future more local bodies will be encouraged to follow in the footsteps of these institutions and provide data of interest to society as a whole.
Noticia
Local statistical data helps us better understand our environment and identify variations between regions. This is essential to be able to formulate local policies tailored to the specific needs of the local population, something that has even been highlighted by the UN in one of its reports. In this sense, in the datos.gob.es catalog you can find statistical information on different localities and regions, such as the population and housing census, administrative records or even economic indicators.
One of the latest additions to our catalog is the Canary Islands Statistics Institute (Istac), as part of the datos.canarias.es initiative. The institute is the new Canary Islands Open Data Portal that is positioned as the only point of access to open data on the island in collaboration with the rest of the regional public administrations.
At the end of January, datos.canarias.es federated with datos.gob.es, incorporating 7,460 new datasets from the Istac and other organizations on the Island.
What kinds of data sets are available?
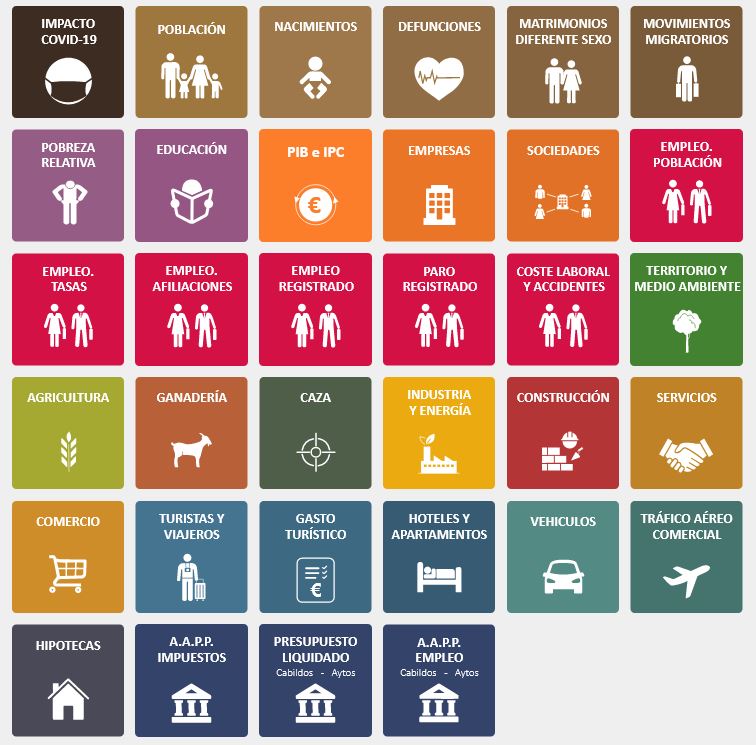
The federated data are categorized according to the recommendations of the Application Guide of the Technical Standard for Interoperability for the Reuse of Information Resources and address a wide range of topics related to the territory, the environment, demographics, the economy, and living conditions or the public sector. Shared data is divided into the following categories:
Istac's commitment to open data
The Decree approving the Statistical Plan of the Canary Islands 2018-2022 (PEC-22), establishes that during its execution the reuse of statistical data will be promoted in accordance with the Law on reuse of public sector information. At the same time, it indicates that the Statistical Data and Metadata Infrastructure (eDatos) will be the support for the open and interoperable dissemination of the data published by the statistical activities of the PEC-22, becoming the only channel for the decentralized dissemination of statistics in the corporate websites of the Government of the Canary Islands.
To comply with the aforementioned guidelines, the Istac has made the open data portal of public statistics in the Canary Islands available to the public, which, under the principles of public statistics and data reuse, distributes the data generated in a manner free, in open formats and with licenses that allow its reuse for commercial and non-commercial purposes.
The portal integrates data and metadata based on standardized semantic assets, geographic information and services to promote their use; and it has programmable application interfaces (API) that facilitate the access and download of the information by third parties. In addition to these APIs, it also provides a series of query tools that allow both downloading the data (for example an Extension for QGIS or an R Package), and taking it to another web or application, such as Widgets, Tableau Public or Google Public Data Explorer.
The website also has a statistical indicator viewer. The user can select the information they want to view from a large number of categories, for example, births and deaths, or the workforce. You can also choose the geographic space (the community as a whole or any specific island or municipality), the type of data (annual, interperiodic variation, etc.) and the temporal range. With this information, the tool will generate the graph with the Istac data.
All these tools show the interest of the Istac and the Government of the Canary Islands not only to facilitate access to their data, but also to promote its reuse by developers who want to create value-added products. With its integration in datos.canarias.es, the visibility of the local statistical data of the Canary Islands is promoted, at the same time that access to the data of interest of the entire Autonomous Community is homogenized.
Noticia
Statistical data is considered high-value data, due to its broad benefits to society, the environment, and the economy. Statistical data provides us with information on demographic and economic indicators (for example, data on GDP, educational level or population age), essential information when making decisions and formulating policies and strategies.
Such is its importance for society as a whole that the UN Statistical Commission created in 2018 an Working Group on Open Data, focused on providing support for the application of open data principles to statistical information, so that its universal and free access is provided. This working group is made up of representatives from different countries, international organizations and associations, such as the World Bank, Open Data Watch, the International Statistical Institute or representatives of the UN itself through agencies such as FAO.
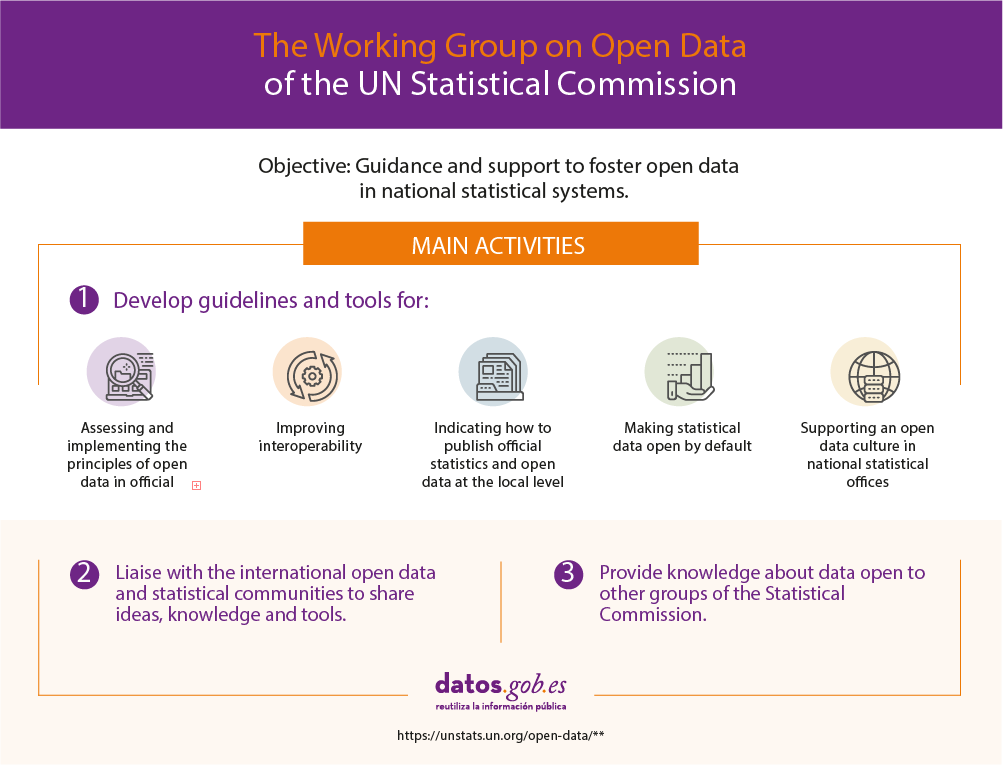
In early March, this group produced a report to guide national statistical offices on open data practices in the production of official statistics. This document is divided into two sections:
• A background document on the application of open data in national statistical offices
• A background document on local level statistics in the form of open data
Let's see the conclusions of each of them.
The application of open data in national statistical offices
The report offers guidelines in the following areas:
- Default open data: The document focuses on the legal aspects of default open data, emphasizing the need for open licensing standards. According to the “Open Data Inventory”, in the period 2018-2019 only 14 out of 180 analysed countries published all their data with an open license. There are many types of internationally recognized licenses. The most common are the Creative Commons and Open Data Commons, although many countries tend to customize them. The report recommends approving an international open license in its original form or preparing a custom license, but conforming to the guidelines formulated by Open Definition. In addition to open licenses, countries also need to have a legal framework with laws on access to information and accountability.
- User-centered designs: The report highlights the need to involve users in the development of platforms and the dissemination of data to ensure that their needs are met. Some of the mechanisms that can be used are conducting surveys, interviews or focus groups. It is also necessary to measure the use of data through website analysis in order to take decisions that increase its use. Given that all countries need to create user participation strategies, it would be advisable to encourage the exchange of templates and guidelines or the holding of joint workshops.
- National reporting platforms: Data platforms must be based on four principles: clarity, adequacy, sustainability and interoperability. For these principles to be fulfilled, it is necessary to promote coordination and cooperation within the national statistical system, and the national statistical office should take the lead.
- Correlation of the Generic Model of Statistical Institutional Processes with interoperability guidelines: To facilitate the different offices to share innovative approaches regarding the collection and dissemination of statistics, it is appropriate to have a framework that includes good practices and standardized terminology. The Generic Model of Statistical Institutional Processes describes the set of actions necessary to produce official statistics, guaranteeing constant improvement. These stages are: a) specify needs; b) design; c) build; d) collect; e) process; f) analyse; g) disseminate; and h) evaluate. In order to incorporate interoperability into the Model, the most relevant interoperability practices should be incorporated into the different design phases.
- Development of an open data culture: The adoption of open data principles in the daily life of statistical institutions can mean a change of mentality. Sometimes you have to "convince" about the need to open this type of information. For this reason, it is essential to carry out internal and external communication actions, analyse existing capacities and carry out training tasks accordingly, and establish responsibilities.
Local level statistics in the form of open data
In addition to having national statistical offices, it is advisable to launch local initiatives that can provide information on specific geographic spaces such as neighbourhoods, rural areas, or census and electoral districts. This information may show disparity between regions and help in the formulation of local policies. It is also useful for civil society, the private sector and NGOs to make better decisions.
In order for comparisons to be made, the report recommends that these data be produced and disseminated following the same guidelines across the country. In addition, it urges national offices to investigate which statistical content is of most interest to users and to provide a series of recommendations, ranging from disclosure mechanisms to the most useful visualization tools. The implementation could be carried out with a gradual approach, where interaction between the different actors involved is encouraged.
The report also refers to the background document presented at the fiftieth session of the Statistical Commission, which includes guidance on understanding open data practices in official statistics. A document worth reviewing when launching such an initiative.
In short, we are dealing with a type of data of great importance, which must be shared with society through an ecosystem of publishers and always respecting the balance between openness and privacy.