Noticia
What are the needs of European public institutions that reuse open data? This is the question posed by the European Commission, through the European open data initiative data.europa.eu, and which is the starting point of the report "Measuring data demand within the public sector", recently published by the initiative.
The report is part of a series of actions that data.europa.eu is undertaking to encourage the re-use of data by the public sector. It is a year-long campaign that will include a series of articles and a webinar. The campaign will culminate in a second report on the findings.
This first report lays the groundwork for the issues to be addressed, setting out 3 objectives:
- Clarify the importance of public institutions as data re-users.
- Identify methods and good practices for assessing the demand from public institutions.
- Stimulate debate on the most appropriate way to foster the re-use of open data by public institutions.
Ultimately, the aim is to foster a data-driven public sector that recognises data as an integral asset for policy formulation, service delivery, management and public innovation.
The benefits of open data re-use by public institutions
Traditionally, in the open data ecosystem, an approach has been followed where the roles were divided: the public sector was the provider of data and the private sector was the re-user. However, this is changing and more and more institutions are realising the benefits of harnessing the potential of open data.
The report highlights how the OECD has identified three areas where data re-use can improve the effectiveness of public institutions:
- Anticipating governance. Open data helps to predict trends and patterns in order to mitigate emerging risks and respond to developing crises. One example is the interactive dashboard developed by Eurostat with statistical, monthly and quarterly indicators. This dashboard is used by different countries to monitor the economic and social recovery linked to the COVID-19 pandemic.
- Policy and service design and delivery. Open data helps to understand issues, engage citizens and drive evidence-based policy making. The report gives the example of the Baltic Sea regions, where cross-border use of open government data is being applied to improve social services.
- Performance management. Open data can also have an impact on increased public sector productivity, more efficient use of resources and better policy evaluation. In this respect, the European Commission's agri-food data portal, which integrates data from multiple European institutions, facilitates the calculation of key indicators for the evaluation of agricultural policies in all countries.
Open data therefore helps to make public services and policies more efficient, but also more sustainable, inclusive and trustworthy, benefiting citizens and businesses. However, despite these advantages, we find that much data in public institutions still does not flow freely, but is siloed. There is a lack of incentive to share, but also a fear of loss of control, among other factors.
The report suggests that the solution lies in taking into account and measuring the demand for data from public institutions. Knowing the benefits of opening up certain data encourages other institutions to open up and reuse it. In this regard, the report highlights, among others, Spain's efforts in engaging with user communities and monitoring the re-use of public data through the Aporta Initiative.
Existing approaches to assessing public institutions' demand for data
After this first part focusing on the benefits, the report goes on to analyse the approaches and indicators that currently exist in the European landscape for assessing the needs of public institutions as data re-users, in order to determine which methods are the most appropriate.
The literature review and the analysis of international measurement frameworks show that demand measurement is not common. The approaches and indicators developed by EU institutions and Member States are few and far between, and focus on fostering demand for data that is already available, without determining the extent of actual re-use of publicly available data and the impact achieved with it. Moreover, they usually focus on re-users in general and on groups such as businesses, journalists, civil society, etc., while neglecting the public sector.
Among the most advanced countries in this area, the report mentions Spain, where a proactive strategy is adopted through challenges and hackathons, co-creation events, information sessions and regular training.
When it comes to measuring impact, a combination of quantitative and qualitative methods is recommended, for example:
- Analyse IP addresses and web statistics.
- Implement web crawling techniques (e.g. search APIs) to identify mentions of open data reuse.
- Quantitative analysis of Tweets mentioning open data.
- Conduct online questionnaires and interviews with re-users.
- Use of contact forms so that users can share use cases or rating systems so that they can rate datasets.
In Spain, quite a few initiatives have already implemented these mechanisms, along with additional ones.
The report also reviews some international indices and reports in search of indicators that measure demand. Many, such as the Global Open Data Index, the Open Data Barometer or the Open Data Inventory (ODIN) focus on data provision and do not include any indicators to calculate the demand for open data by or within public institutions. However, here too the situation is changing and we find other reports such as the European Open Data Maturity Assessment or the Open Data Readiness Assessment (ODRA) that do include this type of metric. Also the forthcoming Global Data Barometer, produced by the Latin American open data initiative ILDA and the Data for Development Network, will include demand indicators as part of the study.
In this sense, the report includes in the annex two tables, one with the overview of the frameworks examined and another one that groups the indicators included in these frameworks that can be used to analyse the demand for open data from public institutions.
Next steps
The paper concludes with a list of key questions emerging from the research, which will be used to trigger a debate among stakeholders on appropriate methods and indicators to measure the demand for data from public institutions, in the context of the data.europa.eu portal. Examples of such questions are: what are the appropriate activities to attract re-users in the public sector or how can automated metrics be leveraged to measure the demand for data from public institutions.
A webinar will take place on Tuesday 29 March to discuss this report. Speakers from different agencies will explain how they engage with data re-users in public institutions, measure their demand and incorporate data into their open data policies. You can register at this link.
Blog
Today, no one can deny that open data holds great economic power. The European Commission itself estimates that the turnover of open data in the EU27 could reach 334.2 billion in 2025, driven by its use in areas linked to disruptive technologies such as artificial intelligence, machine learning or language technologies.
But in addition to its economic impact, open data also has an important value for society: it provides information that makes social reality visible, driving informed decision-making for the common good.
There are thousands of areas where open data is essential, from refugee crises to the inclusion of people with disabilities, but in this article we will focus on the scourge of gender violence.
Where can I obtain data on the subject?
Globally, agencies such as the UN, the World Health Organization and the World Bank offer resources and statistics related to violence against women.
In our country, local, autonomous and state agencies publish related datasets. To facilitate unified access to them, the Government Delegation against Gender Violence has a statistical portal that includes in a single space data from various sources such as the Ministry of Finance and Public Administration, the General Council of the Judiciary or the Public Employment Service of the Ministry of Employment and Social Security. The user can cross-reference variables and create tables and graphs to facilitate the visualization of the information, as well as export the data sets in CSV or Excel format.
Projects to raise awareness and visibility
But data alone can be complicated to understand. Data need a context that gives them meaning and transforms them into information and knowledge. This is where different projects arise that seek to bring data to the public in a simple way.
There are many associations and organizations that take advantage of published data to create visualizations and stories with data that help to raise awareness about gender violence. As an example, the Barcelona Open Data Initiative is developing the "DatosXViolenciaXMujeres" project. It is a visual and interactive tour on the impact of gender violence in Spain and by Autonomous Communities during the period 2008-2020, although it is updated periodically. Using data storytelling techniques, it shows the evolution of gender violence within the couple, the judicial response (orders issued and final convictions), the public resources allocated, the impact of COVID-19 in this area and crimes of sexual violence. Each graph includes links to the original source and to places where the data can be downloaded so that they can be reused in other projects.
Another example is "Datos contra el ruido” (Data against noise), developed within the framework of GenderDataLab, a collaborative platform for the digital common good that has the support of various associations, such as Pyladies or Canodron, and the Barcelona City Council, among others. This association promotes the inclusion of the gender perspective in the collection of open data through various projects such as the aforementioned "Dotos contra el ruido", which makes visible and understandable the information published by the judicial system and the police on gender violence. Through data and visualizations, it provides information on the types of crimes or their geographical distribution throughout our country, among other issues. As with "DatosXViolenciaXMujeres", a link to the original source of the data and download spaces are included.
Tools and solutions to support victims
But in addition to providing visibility, open data can also give us information on the resources dedicated to helping victims, as we saw in some of the previous projects. Making this information available to victims in a quick and easy way is essential. Maps showing the location of help centers are of great help, such as this one from the SOL.NET project, with information on organizations that offer support and care services for victims of gender-based violence in Spain. Or this one with the centers and social services of the Valencian Community aimed at disadvantaged groups, including victims of gender violence, prepared by the public institution itself.
This information is also incorporated in applications aimed at victims, such as Anticípate. This app not only provides information and resources to women in vulnerable situations, but also has an emergency call button and allows access to legal, psychological or even self-defense advice, facilitating access to a social criminologist.
In short, we are facing a particularly sensitive issue, which we must continue to raise awareness and fight to put an end to. A task to which open data can make a significant contribution.
If you know of any other example that shows the power of open data in this field, we encourage you to share it in the comments section or send us an email to dinamizacion@datos.gob.es.
Content prepared by the datos.gob.es team.
Blog
Measuring the impact of open data is not always easy. As we saw a few weeks ago, there are several theoretical models that are not easy to implement, so we have to look for different approaches. In the Aporta Initiative we use a mixed approach, as explained here: a quantitative analysis through indicators on data publication and its characteristics, and a qualitative one through the collection of cases of data use.
This approach is also used by various local, regional and state initiatives in our country. In today's article, we will focus on concrete examples of mechanisms implemented by Spanish open data initiatives to monitor and measure the impact of the use of their data.
Quantitative analysis
One of the first steps in monitoring impact is to know quantitatively if users are accessing the published data. To do this we can use different tools.
Dashboards
Thanks to the incorporation of web analytics tools in open data platforms, such as Google Analytics or Motomo (which until 2018 was called PIWIK), a series of indicators can be set around data consumption variables, such as how many users visit the web, what is their origin, which data sets are most in demand or in what format they are downloaded. All of this information is of great value when it comes to making decisions that imply improvements to continue promoting the reuse of public information.
With this data, dashboards can be created so that users can also know this information. This is the case of the Castellón Provincial Council, the Madrid City Council, the Catalan Government, Renfe, the Basque Government or the datos.gob.es itself.
Conducting surveys and periodic studies
In addition, it is advisable to carry out frequent public consultations and studies that allow us to know directly the impact of our data. The ONTSI periodically carries out a characterization study of the sector, and an analysis of the Public Administrations as reusers of their own data and that of third parties. Another example is the report on the Infomediary Sector of ASEDIE, now in its 8th edition. This report measures the products and services based on open data that have been generated. Both reports use a stable methodology that allows comparisons between different years.
Qualitative analysis
It consists of the identification of use cases through different mechanisms, such as
Application and enterprise tracking
Thanks to the mapping of open data use cases, we can know what the impact of a certain data set is. In many open data platforms, whether local, regional or state, we can find a section of applications or companies with examples and reuse success stories that in turn serve as reference and inspiration for the creation of new value services. In the case of datos.gob.es, we have a form for companies or applications that wish to register their information, but we also carry out a proactive search, through contact with the main actors in the ecosystem and media alerts.
Other examples of portals that have applications sections are Andalusia, Castilla y Leon, Navarra, Barcelona, Santander, Malaga, Zaragoza, Valencia, Vitoria or Bilbao, although there are many more.
Implementation of data communities
In order to be aware of new developments in the field of reuse and to exchange knowledge and experiences to align the data publication strategy with the needs of reusers, some initiatives have opted for the implementation of communities. This is the case of the Basque Country, which has created a space to centralize everything that happens around the reuse of its data. This community has been especially useful to collect and measure the work that has been developed on COVID-19 using open data. Under its umbrella there are also activities and competitions that encourage reuse.
For its part, the Castellón Provincial Council has created a Provincial Council of Reusers, a mixed public-private body made up of technicians from the provincial institution itself, and people with recognized professional backgrounds in different economic sectors. These professionals meet once a quarter to hold a conversation to monitor use cases and which favours constant feedback and the enrichment of the Provincial Council's open data strategy.
The National Library of Spain is working along the same lines and has launched a collaborative work platform so that those citizens who wish to do so can participate in specific projects to enrich the Library's data, making it more accessible and easier to reuse.
In short, all these activities allow monitoring the activity of an open data initiative and its impact on society. They help us to know what challenges we are solving in fields as important for humanity as the environment, health or education. In this way, we will be able to know its evolution over time and easily detect trends and possible areas of improvement, which will lead us to distribute the efforts and resources available in a more effective way.
Content elaborated by datos.gob.es team.
Blog
The difficulties in adequately measuring the impact of open data initiatives are widely known, as it is a global debate that has been with us practically since the beginning of the first open data initiatives, more than ten years ago. The problem is that it is relatively easy to find isolated examples of how various benefits and improvements have been achieved through open data, but in general - and unless we are talking about very specific areas such as economic impact - it is not common to find complete and structured measurements of the impact that has been achieved through open data initiatives in order to demonstrate their full value.
A review of the various initiatives and methods that exist to measure the impact of open data also shows that there is no clear consensus among researchers on how best to capture the results and impact of these initiatives.
In view of this scenario, we share here the approach to impact measurement that we have been following from the Spanish Government's open data and public information reuse initiative and that is inspired by the recommendations provided by several guides that we consider to be reference in this aspect: the UNE 178301:2015 standard, the framework of common methods for the evaluation of open data, the guide for the empirical analysis of open government data initiatives and the taxonomy of the impact of open data.
Within our personal approach to the problem we must first clarify what we understand “impact” as – “any positive effect or benefit obtained directly or indirectly for individuals, communities or society as a whole, which occurs over a certain period of time and which results from the development of different activities in a given field characterized by the use of open data as a means to an end”.
Thus, the method we use to measure such impact is based on two main components: a quantitative analysis through indicators on data publication and its characteristics, and a qualitative one through the collection of data use cases.
Quantitative analysis
The objective of quantitative analysis is to offer a series of indicators in a quick and simple way that provide us with an overview of the data publication activity. In this way, we can track its evolution over time and easily detect trends and possible areas for improvement. This will help us to distribute available efforts and resources more effectively.
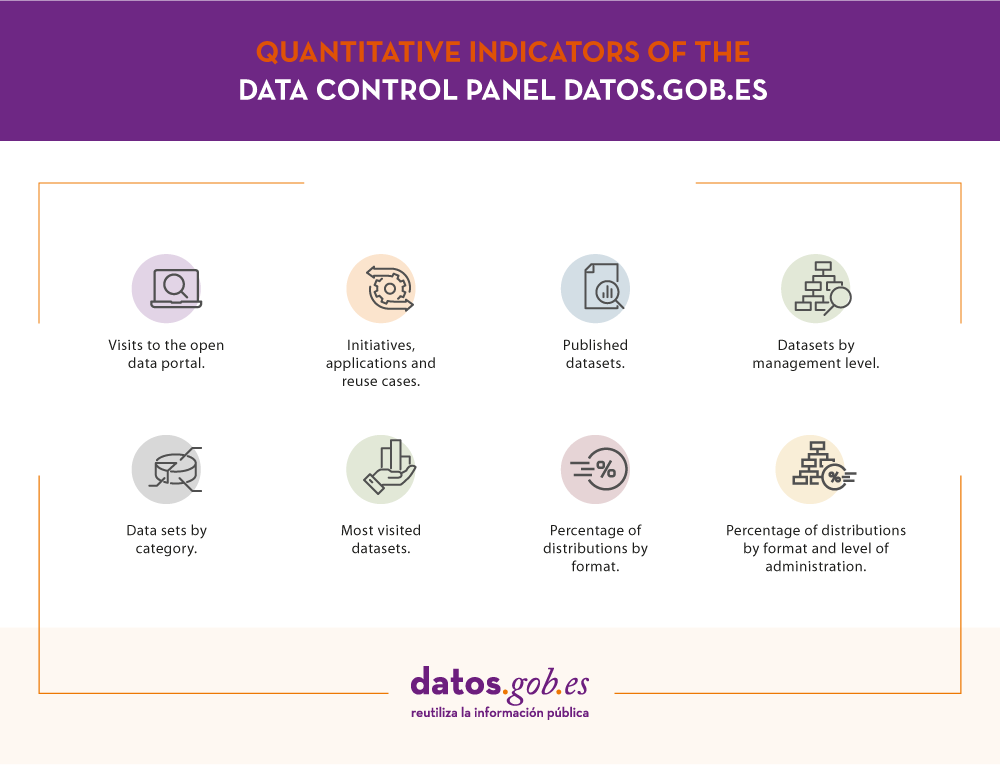
The datos.gob.es initiative has its own public control panel that provides quantitative indicators on the following aspects:
Qualitative analysis
Through the qualitative approach, use cases are identified from different sources that can include personalized interviews, content available online, information provided by different media or academic publications.
These use cases help us to understand the extent to which open data can be considered to have led to positive changes in three main areas described below:
Government level
Including the possible impact on the transparency and accountability of governments, as well as on improving their efficiency and effectiveness. Some of the issues that can be raised in this area are:
- How does openness of data help to improve government efficiency?
- How is data used to examine government resource use and improve existing public services?
- How is open data used to create new public services?
- How does open data contribute to increased transparency and accountability through public scrutiny?
Examples of measurements that are also useful in measuring the impact of open data actions in this area are:
- Increased collaboration between different government departments and agencies.
- Creation of platforms and applications that allow citizens to report on their experience in government services.
- Greater participation of citizens in the formulation of public policies.
- Improved public resource planning.
- Reduction in citizens' perception of corruption.
Social area
Including the environmental aspects and the improvements obtained in the inclusion of minority groups in society. Some of the issues that can be raised in this area are:
- What are the social benefits obtained through the use of open data?
- How is open data used to improve equality and direct public resources to the citizens who need them most at any given time?
- What are the benefits of open data in the area of the environment, climate change, pollution, or sustainability?
Examples of indicators that are also useful when measuring the impact of open data actions in this area are:
- Evidence of greater equality in terms of age, gender, race, social class, disability, geographical location or poverty level.
- Evidence of improvement in social policies.
- Number and effectiveness of sustainability programs implemented as a result of the open data
- Increased attention to environmental factors in project planning.
- Awareness and sensitization of citizens about their own environmental impacts.
Economic area
Through the influence of open data in supporting existing businesses or creating new business models. Some of the issues we address in this area are:
- What is the impact of open data on economic growth and innovation?
- How is open data used to reduce costs in companies and help them become more efficient?
- What new business models are being developed around open data?
Examples of indicators that are also useful when measuring the impact of data openness actions in this area are:
- Companies and/or jobs created from the new economy of data openness.
- New products or services using the open data.
- Contribution of open data to the growth of the economy in terms of better macroeconomic planning.
Future areas of improvement
While the method applied may not be perfect - as it may have limitations in terms of the ability to adequately capture desired changes -, in the absence of other reference methodologies, it allows us to explore the emerging impact of ongoing open data initiatives and provide some substantial evidence regarding their impact, at least.
Thus, it would also be desirable to explore new methods in the future that allow for evidence of impact obtained in a more systematic way through the measurement of specific goals and objectives with respect to the initial starting point, and that could also be replicated among the different initiatives, also considering the entire data value chain in the measurements carried out. Some interesting options to be able to put these objectives into practice could be the methods of outcome mapping or social return on investment (SROI) -both already proposed previously in the field of open data but with very limited or no acceptance so far, due most probably to the higher added cost that their implementation would imply.
Content prepared by Carlos Iglesias, Open data Researcher and consultan, World Wide Web Foundation.
Contents and points of view expressed in this publication are the exclusive responsibility of its author.