Blog
The carbon footprint is a key indicator for understanding the environmental impact of our actions. It measures the amount of greenhouse gas emissions released into the atmosphere as a result of human activities, most notably the burning of fossil fuels such as oil, natural gas and coal. These gases, which include carbon dioxide (CO2), methane (CH4) and nitrous oxide (N2O), contribute to global warming by trapping heat in the earth's atmosphere.
Many actions are being carried out by different organisations to try to reduce the carbon footprint. These include those included in the European Green Pact or the Sustainable Development Goals. But this is an area where every small action counts and, as citizens, we can also contribute to this goal through small changes in our lifestyles.
Moreover, this is an area where open data can have a major impact. In particular, the report "The economic impact of open data: opportunities for value creation in Europe (2020)" highlights how open data has saved the equivalent of 5.8 million tonnes of oil every year in the European Union by promoting greener energy sources. This include 79.6 billion in cost savings on energy bills.
This article reviews some solutions that help us measure our carbon footprint to raise awareness of the situation, as well as useful open data sources .
Calculators to know your carbon footprint
The European Union has a web application where everyone can analyse the life cycle of products and energy consumed in five specific areas (food, mobility, housing, household appliances and household goods), based on 16 environmental impact indicators. The user enters certain data, such as his energy expenditure or the details of his vehicle, and the solution calculates the level of impact. The website also offers recommendations for improving consumption patterns. It was compiled using data from Ecoinvent y Agrifoot-print, as well as different public reports detailed in its methodology.
The UN also launched a similar solution, but with a focus on consumer goods. It allows the creation of product value chains by mapping the materials, processes and transports that have been used for their manufacture and distribution, using a combination of company-specific activity data and secondary data. The emission factors and datasets for materials and processes come from a combination of data sources such as Ecoinvent, the Swedish Environment Institute, DEFRA (UK Department for Environment, Food and Rural Affairs), academic papers, etc. The calculator is also linked to the the Platform for carbon footprint offsetting of the United Nations. This allows users of the application to take immediate climate action by contributing to UN green projects.
Looking at Spain, the Ministry for Ecological Transition and the Demographic Challenge has several tools to facilitate the calculation of the carbon footprint aimed at different audiences: organisations, municipalities and farms. They take into account both direct emissions and indirect emissions from electricity consumption. Among other data sources, it uses information from National Greenhouse Gas Inventory. It also provides an estimate of the carbon dioxide removals generated by an emission reduction project.
Another tool linked to this ministry is ComidaAPrueba, launched by the Fundación Vida Sostenible and aimed at finding out the sustainability of citizens' diets. The mobile application, available for both iOs and Android, allows us to calculate the environmental footprint of our meals to make us aware of the impact of our actions. It also proposes healthy recipes that help us to reduce food waste.
But not all actions of this kind are driven by public bodies or non-profit associations. The fight against the deterioration of our environment is also a niche market offering business opportunities. Private companies also offer solutions for calculating the carbon footprint, such as climate Hero, which is based on multiple data sources.
Data sources to feed carbon footprint calculators
As we have seen, in order to make these calculations, these solutions need to be based on data that allow them to calculate the relationship between certain consumption habits and the emissions generated. To do this, they draw on a variety of data sources, many of which are open. In Spain, for example, we find:
- National Statistics Institute (INE). The INE provides data on atmospheric emissions by branch of activity, as well as for households. It can be filtered by gas type and its equivalence in thousands of tonnes of CO2. It also provides data on the historical evolution of the achievement of carbon footprint reduction targets, which are based on the National Inventories of Emissions to the Atmosphere, prepared by the Ministry for Ecological Transition and the Demographic Challenge.
- Autonomous Communities. Several regional governments carry out inventories of pollutant emissions into the atmosphere. This is the case of the Basque Country and the Community of Madrid. Some regions also publish open forecast data, such as the Canary Islands, which provides projections of climate change in tourism or drought situations.
Other international data services to consider are:
- EarthData. This service provides full and open access to NASA' s collection of Earth science data to understand and protect our planet. This web provides links to commonly used data on greenhouse gases, including carbon dioxide, methane, nitrous oxide, ozone, chlorofluorocarbons and water vapour, as well as information on their environmental impact.
- Eurostat. The Statistical Office of the European Commission regularly publishes estimates of quarterly greenhouse gas emissions in the European Union, broken down by economic activity. The estimates cover all quarters from 2010 to the present.
- Life Cycle Assessment (LCA). This platform is the EU's knowledge base on sustainable production and consumption. It provides a product life cycle inventory for supply chain analysis. Data from business associations and other sources related to energy carriers, transport and waste management are used.
- Our World in Data. One of the most widely used datasets of this portal contains information on CO2 and greenhouse gas emissions through key metrics. Various primary data sources such as the US Energy Information Agency and The Global Carbon Project have been used for its elaboration. All raw data and scripts are available in their GitHub repository.
These repositories are just a sample, but there are many more sources whit valuable data to help us become more aware of the climate situation we live in and the impact our small day-to-day actions have on our planet. Reducing our carbon footprint is crucial to preserving our environment and ensuring a sustainable future. And only together will we be able to achieve our goals.
Blog
Aspects as relevant to our society as environmental sustainability, climate change mitigation or energy security have led to the energy transition taking on a very important role in the daily lives of nations, private and public organisations, and even in our daily lives as citizens of the world. The energy transition refers to the transformation of our energy production and consumption patterns towards less dependence on fossil fuels through low or zero carbon sources, such as renewable sources.
The measures needed to achieve a real transition are far-reaching and therefore complex. In this process, open data initiatives can contribute enormously by facilitating public awareness, improving the standardisation of metrics and mechanisms to measure the impact of measures taken to mitigate climate change globally, promoting the transparency of governments and companies in terms ofCO2emission reductions, or increasing the participation of citizens in the process citizen and scientific and scientific participation for the creation of new digital solutions, as well as the advancement of knowledge and innovation.
What initiatives are providing guidance?
The best way to understand how open data helps us to observe the effects of highCO2 emissions as well as the impact of different measures taken by all kinds of actors in favour of the energy transition is by looking at real examples.
The Energy Institute (IE), an organisation dedicated to accelerating the energy transition, publishes its annual World Energy Statistical Review, which in its latest version includes up to 80 datasets, some dating back as far as 1965, describing the behaviour of different energy sources as well as the use of key minerals in the transition to sustainability. Using its own online reporting tool to represent those variables we want to analyse, we can see how, despite the exponential growth of renewable energy generation in recent years (figure 1), there is still an increasing trend inCO2emissions (figure 2), although not as drastic as in the first decade of the 2000s.
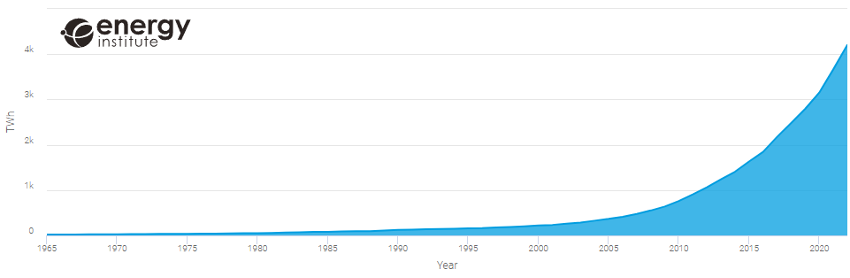
Figure 1: Evolution of global renewable generation in TWh.
Source: Energy Institute Statistical Review 2023
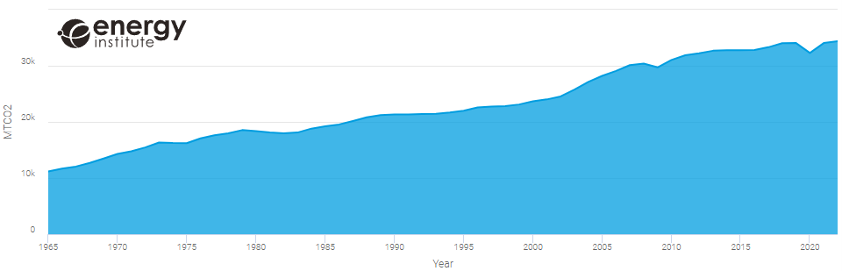
Figure 2: Evolution of global CO2 emissions in MTCO2
Source: Energy Institute Statistical Review 2023
Another international energy transition driver that offers an interesting catalogue of data is the International Energy Agency (IEA). In this case we can find more than 70 data sets, not all of them open without subscription, which include both historical energy data and future projections in order to reach the Net Zero 2050targets. The following is an example of this data taken from their library of graphical displays, in particular the expected evolution of energy generation to reach the Net Zero targets in 2050. In Figure 3 we can examine how, in order to achieve these targets, two main simultaneous processes must occur: reducing the total annual energy demand and progressively moving to lowerCO2emitting generation sources.
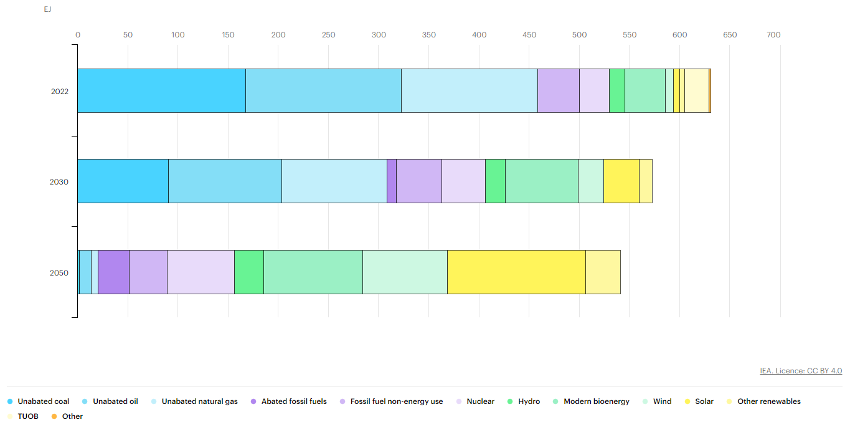
Figure 3: Energy generation 2020-2050 to achieve Net Zero emissions targets in Exajulios.
Source: IEA, Total energy supply by source in the Net Zero Scenario, 2022-2050, IEA, Paris, IEA. Licence: CC BY 4.0
To analyse in more detail how these two processes must happen in order to achieve the Net Zero objectives, IEA offers another very relevant visualisation (figure 4). In it, we can see how, in order to achieve the reduction of the total annual energy demand, it is necessary to make accelerated progress in the decade 2025-2035, thanks to measures such as electrification, technical improvements in the efficiency of energy systems or demand reduction. In this way, a reduction of close to 100EJs per year should be achieved by 2035, which should then be maintained throughout the rest of the period analysed. To try to understand the significance of these measures and taking as a reference the average electricity consumption of Spanish households, some 3,500kWh/year, the desired annual reduction would be equivalent to avoiding the consumption of some 7,937,000,000 households or, in other words, to avoiding in one year the electricity consumption that all Spanish households would consume for 418 years.
ith respect to the transition to lower emission sources, we can see in this figure how the expectation is that solar energy will be the leader in growth, ahead of wind energy, while unabated coal (energy from burning coal without usingCO2capture systems) is the source whose use is expected to be reduced the most.
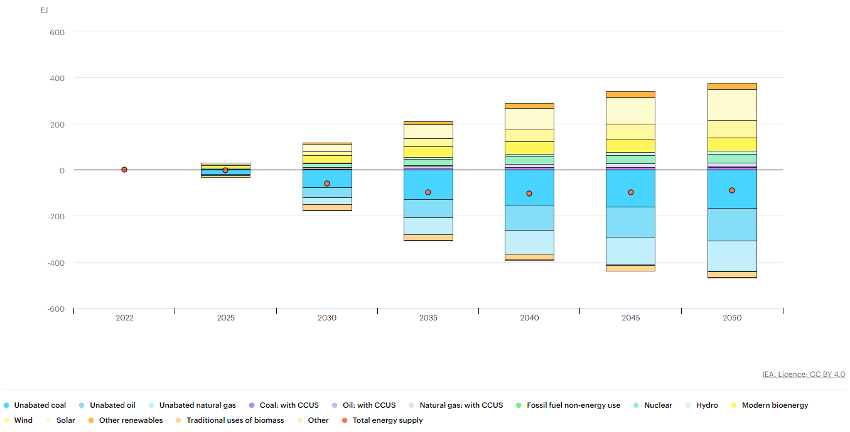
Figure 4: Changes in energy generation 2020-2050 to achieve Net Zero emissions targets in Exajulios.
Source: IEA, Changes in total energy supply by source in the Net Zero Scenario, 2022-2050, IEA, Paris, IEA. Licence: CC BY 4.0
Other interesting open data initiatives from an energy transition perspective are the catalogues of the European Commission (more than 1.5 million datasets) and of the Spanish Government through datos.gob.es (more than 70 thousand datasets). Both provide open datasets on topics such as environment, energy or transport.
In both portals, we can find a wide variety of information, such as energy consumption of cities and companies, authorised projects for the construction of renewable generation facilities or the evolution of hydrocarbon prices.
Finally, the REDatainitiative of Red Eléctrica Española (REE)offers a data area with a wide range of information related to the Spanish electricity system. Among others, information related to electricity generation, markets or the daily behaviour of the system.
Figure 5: Sections of information provided from REData
Source: El sistema eléctrico: Guía de uso de REData, November 2022. Red Eléctrica Española.
The website also offers an interactive viewer for consulting and downloading data, as shown below for electricity generation, as well as a programmatic interface (API - Application Programming Interface) for consulting the data repository provided by this entity.

Figure 6: REE REData Platform
Source: https://www.ree.es/es/datos/aldia
What conclusions can we draw from this movement?
As we have been able to observe, the enormous concern about the energy transition has motivated multiple organisations of different types to make data openly available for analysis and use by other organisations and the general public. Entities as varied as the Energy Institute, the International Energy Agency, the European Commission, the Spanish Government and Red Eléctrica Española publish valuable information through their data portals in search of greater transparency and awareness.
In this short article we have been able to examine how these data have been of great help to better understand the historical evolution ofCO2emissions, the installed wind power capacity or the expectations of energy demand to reach the Net Zero targets. Open data is a very good tool to improve the understanding of the need and depth of the energy transition, as well as the progress of the measures that are progressively being taken by multiple entities around the world, and we expect to see an increasing number of initiatives along these lines.
Content prepared by Juan Benavente, senior industrial engineer and expert in technologies linked to the data economy. The contents and points of view reflected in this publication are the sole responsibility of the author.
Blog
As in other industries, digital transformation is helping to change the way the agriculture and forestry sector operates. Combining technologies such as geolocation or artificial intelligence and using open datasets to develop new precision tools is transforming agriculture into an increasingly technological and analytical activity.
Along these lines, the administrations are also making progress to improve management and decision-making in the face of the challenges we are facing. Thus, the Ministry of Agriculture, Fisheries and Food and the Ministry for Ecological Transition and the Demographic Challenge have designed two digital tools that use open data: Fruktia (crop forecasting related to fruit trees) and Arbaria (fire management), respectively.
Predicting harvests to better manage crises
Fruktia is a predictive tool developed by the Ministry of Agriculture to foresee oversupply situations in the stone fruit and citrus fruit sector before the traditional systems of knowledge of forecasts or gauges. After the price crises suffered in 2017 in stone fruit and in 2019 in citrus fruit due to a supervening oversupply, it became clear that decision-making to manage these crises based on traditional forecasting systems came too late and that it was necessary to anticipate in order to adopt more effective measures by the administration and even by the sector itself that would prevent prices from falling.
In response to this critical situation, the Ministry of Agriculture decided to develop a tool capable of predicting harvests based on weather and production data from previous years. This tool would be used internally by the Ministry and its analysis would be seen at the working tables with the sector, but would not be public under any circumstances, thus avoiding its possible influence on the markets in a way that could not be controlled.
Fruktia exists thanks to the fact that the Ministry has managed to combine information from two main sources: open data and the knowledge of sector experts. These data sources are collected by Artificial Intelligence which, using Machine Learning and Deep Learning technology, analyses the information to make specific forecasts.
The open datasets used come from:
- Information from weather stations of the Spanish Meteorological Agency (AEMET).
- Information from agro-climatic stations.
With the above data and statistical data from crop estimates of past campaigns (Production Advances and Yearbooks of the Ministry of Agriculture, Fisheries and Food) together with sector-specific information, Fruktia makes two types of crop predictions: at regional level (province model) and at farm level (enclosure model).
The provincial model is used to make predictions at provincial level (as its name suggests) and to analyse the results of previous harvests in order to:
- Anticipate excess production.
- Anticipate crises in the sector, improving decision-making to manage them.
- Study the evolution of each product by province.
This model, although already developed, continues to be improved to achieve the best adaptation to reality regardless of the weather conditions.
On the other hand, the model of enclosures (still under development) aims to:
- Production forecasts with a greater level of detail and for more products (for example, it will be possible to know production forecasts for stone fruit crops such as paraguayo or platerina for which we currently do not have information from statistical sources yet).
- Knowing how crops are affected by specific weather phenomena in different regions.
The model of enclosures is still being designed, and when it is fully operational it will also contribute to:
- Improve marketing planning.
- Anticipate excess production at a more local level or for a specific type of product.
- Predict crises before they occur in order to anticipate their effects and avoid a situation of falling prices.
- Locate areas or precincts with problems in specific campaigns.
In other words, the ultimate aim of Fruktia is to achieve the simulation of different types of scenarios that serve to anticipate the problems of each harvest long before they occur in order to adopt the appropriate decisions from the administrations.
Arbaria: data science to prevent forest fires
A year before the birth of Fruktia, in 2019, the Ministry of Agriculture, Fisheries and Food designed a digital tool for the prediction of forest fires which, in turn, is coordinated from the forestry point of view by the Ministry for Ecological Transition and the Demographic Challenge.
Under the name of Arbaria, this initiative of the Executive seeks to analyse and predict the risk of fires occurring in specific temporal and territorial areas of the Spanish territory. In particular, thanks to the analysis of the data used, it is able to analyse the socio-economic influence on the occurrence of forest fires at the municipal level and anticipate the risk of fire in the summer season at the provincial level, thus improving access to the resources needed to tackle it.
The tool uses historical data from open information sources such as the AEMET or the INE, and the records of the General Forest Fire Statistics (EGIF). To do so, Artificial Intelligence techniques related to Deep and Machine Learning are used, as well as Amazon Web Services cloud technology.
However, the level of precision offered by a tool such as Arbaria is not only due to the technology with which it has been designed, but also to the quality of the open data selected.
Considering the demographic reality of each municipality as another variable to be taken into account is important when determining fire risk. In other words, knowing the number of companies based in a locality, the economic activity carried out there, the number of inhabitants registered or the number of agricultural or livestock farms present is relevant to be able to anticipate the risk and create preventive campaigns aimed at specific sectors.
In addition, the historical data on forest fires gathered in the General Forest Fire Statistics is one of the most complete in the world. There is a general register of fires since 1968 and another particularly exhaustive one from the 1990s to the present day, which includes data such as the location and characteristics of the surface of the fire, means used to extinguish it, extinguishing time, causes of the fire or damage to the area, among others.
Initiatives such as Fruktia or Arbaria serve to demonstrate the economic and social potential that can be extracted from open datasets. Being able to predict, for example, the amount of peaches that fruit trees in a municipality in Almeria will yield helps not only to plan job creation in an area, but also to ensure that sales and consumption in an area remain stable.
Likewise, being able to predict the risk of fires provides the tools for better fire prevention and extinction planning.
Content written by the datos.gob.es team
Noticia
The Cross-Forest project combines two areas of great interest to Europe, as set out in the Green Deal. On the one hand, the care and protection of the environment - in particular our forests-. On the other hand, the promotion of an interoperable European digital ecosystem.
The project started in 2018 and ended on 23 June, resulting in different tools and resources, as we will see below.
What is Cross-Forest?
Cross-Forest is a project co-funded by the European Commission through the CEF (Connecting Europe Facility) programme, which seeks to publish and combine open and linked datasets of forest inventories and forest maps, in order to promote models that facilitate forest management and protection.
The project has been carried out by a consortium formed by the Tragsa Public Group, the University of Valladolid and Scayle Supercomputacion of Castilla y León, with the institutional support of the Ministry for Ecological Transition and the Demographic Challenge (MITECO, in Spanish acronyms). On the Portuguese side, the Direção-Geral do Território of Portugal has participated.
The project has developed:
- A Digital Services Infrastructure (DSI) for open forest data, oriented towards modelling forest evolution at country level, as well as predicting forest fire behaviour and spread. Data on fuel materials, forest maps and spread models have been used. High Performance Computing (HPC) resources have been used for their execution, due to the complexity of the models and the need for numerous simulations.
- An ontological model of forest data common to public administrations and academic institutions in Portugal and Spain, for the publication of linked open data. Specifically, a set of eleven ontologies has been created. These ontologies, which are aligned with the INSPIRE Directive, interrelate with each other and are enriched by linking to external ontologies. Although they have been created with a focus on these two countries, the idea is that any other territory can use them to publish their forest data, in an open and standard format.
The different datasets used in the project are published separately, so that users can use the ones they want. All the data, which are published under CC BY 4.0 licence, can be accessed through this Cross-Forest Github repository and the IEPNB Data Catalogue.
4 flagship projects in Linked Open Data format
Thanks to Cross-Forest, a large part of the information of 4 flagship projects of the General Directorate of Biodiversity, Forests and Desertification of the Ministry for Ecological Transition and the Demographic Challenge has been published in linked open data format:
- National Forest Inventory (IFN-3). It includes more than 100 indicators of the state and evolution of the forests. These indicators range from their surface area or the tree and shrub species that inhabit them, to data related to regeneration and biodiversity. It also incorporates the value in monetary terms of the environmental, recreational and productive aspects of forest systems, among other aspects. It has more than 90,000 plots. Two databases corresponding to a subset of the NFI indicators have been published openly.
- Forest Map of Spain (Scale 1:50.000). It consists of the mapping of the situation of forest stands, following a conceptual model of hierarchical land uses.
- National Soil Erosion Inventory (INES). This is a study that detects, quantifies and cartographically reflects the main erosion processes affecting the Spanish territory, both forest and agricultural. Its objective is to know its evolution over time thanks to continuous data collection and it has more than 20,000 plots.
- General Forest Fire Statistics. It includes the information collected in the Fire Reports that are completed by the Autonomous Communities for each of the forest fires that take place in Spain.
These datasets, along with others from this Ministry, have been federated with datos.gob.es, so that they are also available through our data catalogue. Like any other dataset that is published on datos.gob.es, they will automatically be federated with the European portal as well.
The predecessor of this project was CrossNature. This project resulted in the Eidos database, which includes linked data on wild species of fauna and flora in Spain and Portugal. It is also available on datos.gob.es and is reflected in the European portal.
Both projects are an example of innovation and collaboration between countries, with the aim of achieving more harmonised and interoperable data, facilitating to compare indicators and improve actions, in this case, in the field of forest protection.