Documentación
This report published by the European Data Portal explores the so-called Citizen Generated Data (CGD). This category of data refers to those generated by citizens. There is a lack of this type of data within European open data portals, mainly due to the lack of publication and management of CGDs by public administrations.
The document analyzes various open data portals, whose main objective is to provide a vision of the CGDs that can be part of these portals and how to include them by public administrations. It should be noted that during the analysis, a framework is established for the description, reference, and characterization of the CGDs.
Finally, based on the conclusions of the previous analysis, the document offers a series of recommendations and guidelines for data publishers. The objective is to increase and improve the presence of CGDs in the publication of open data, involving citizens in the design of policy, processes and governance.
This report is available at the following link: "Data.europa.eu and citizen-generated data"
Documentación
This report published by the European Data Portal (EDP) aims to help open data users in harnessing the potential of the data generated by the Copernicus program.
The Copernicus project generates high-value satellite data, generating a large amount of Earth observation data, this is in line with the European Data Portal's objective of increasing the accessibility and value of open data.
The report addresses the following questions, What can I do with Copernicus data? How can I access the data?, and What tools do I need to use the data? using the information found in the European Data Portal, specialized catalogues and examining practical examples of applications using Copernicus data.
This report is available at this link: "Copernicus data for the open data community"
Documentación
This report published by the European Data Portal (EDP) covers the following topics.
What are the needs of open data re-users of public sector institutions in Europe? This question is key to facilitate the publication of open data and support for re-users of EU institutions and Member States' public authorities based on their needs for policy-making, service delivery and organizational management.
This discussion paper provides an overview of the state of existing methods and indicators in the European open data landscape to assess the needs of public institutions as data re-users.
This overview serves as a basis for a discussion with public sector stakeholders on appropriate methods and indicators for measuring the demand for data from public institutions to encourage the publication of demand-driven data.
The report is available at this link: "Measuring Data Demand Within the Public Sector"
Documentación
This report published by the European Data Portal (EDP) explores existing and emerging developments and initiatives around data sharing using data spaces.
The objective is twofold: to identify the owners of open data involved in the implementation of data spaces and to reflect on the role that open data portals (with special attention to data.europa.eu) could play in this implementation.
After documentary research and interviews with the promoters of data spaces, it is analyzed how data.europa.eu could be positioned in the common European data spaces that are emerging.
The report is available at this link: "Data.europa.eu y los espacios comunes de datos europeos: un informe sobre retos y oportunidades"
Documentación
Data are fundamental to solving the social and economic challenges we face today. It allows us to understand the causes behind a given situation and the factors that influence it, to estimate how it is evolving and to make informed decisions for change.
The problem is that solving such challenges often requires a combination of data from different sources:
- Data provided by the public sector
- Data from multiple private sector companies
- Citizen-generated data
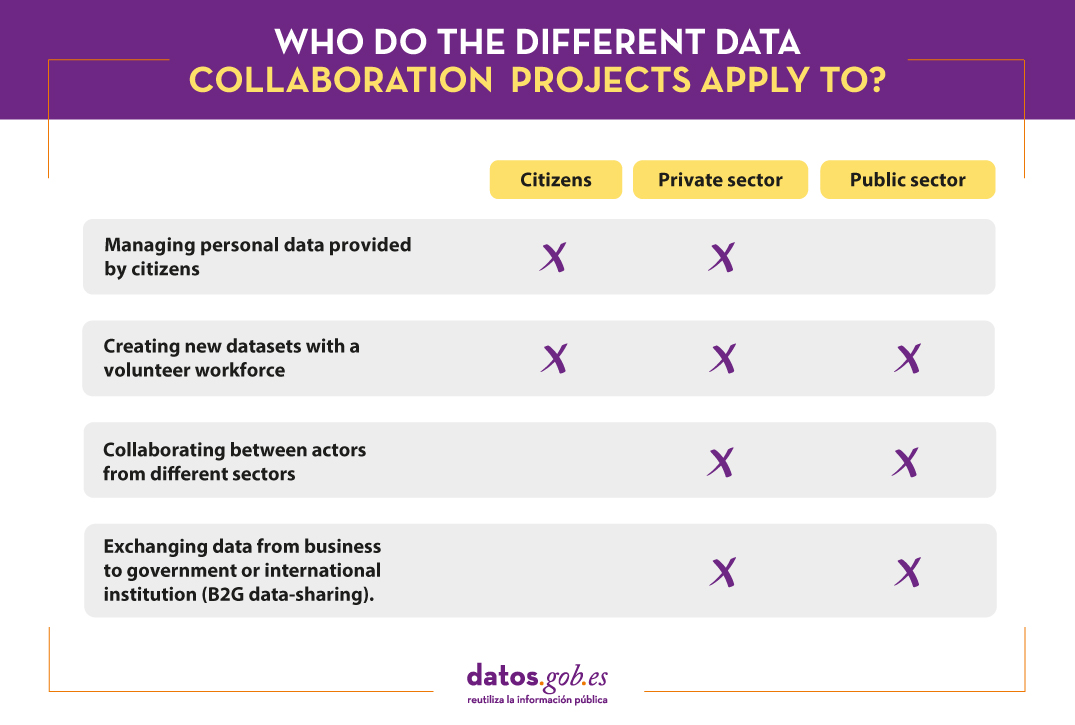
But how can such collaboration be achieved? This is the question posed in the report "How to facilitate data collaboration to solve societal problems", written by Jose Luis Marín in the framework of the Aporta Initiative.
The report begins with a brief introduction outlining the current state of data openness in the public and private sectors, as well as in the citizenry. Then, it discusses the main barriers to data sharing by companies and citizens, the individual and collective benefits that can motivate these practices in the public interest, and the policies that can be put in place by public administrations to compensate and encourage collaboration.
Once the context is clear, it is time to look at some of the existing mechanisms for collaboration in data collection, sharing or processing to address a societal challenge. Although there are no systematised analyses of ideal forms of governance, four formulas have been identified for this report:
In order to illustrate and better understand each formula, the report includes multiple examples of international success stories, such as the Accelerating Medicines Partnership (AMP), which focuses on transforming the current model of developing new diagnostics and treatments, or the Open Apparel Registry (OAR), which aims to contribute to improving human rights and environmental conditions around factories.
The report concludes with a series of resources to help organisations collaborate successfully and reduce barriers, including collaboration networks, collaboration frameworks, courses and trainings.
Below, you can download the report, as well as access the complementary materials (executive summary, video-interview and summary presentation). The report is translated into English, but additional materials are available in Spanish version only.
Documentación
Discover which are the strategic frameworks that mark the publication and use of open data, as well as the most outstanding datasets at local, regional, national and international level through the various infographics that we will publish periodically.
European Health Data Space: objectives and approach
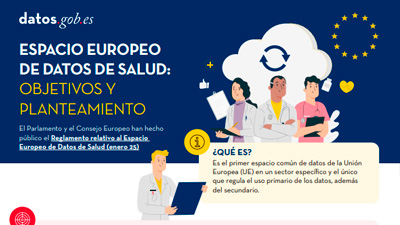 |
Published: February 2025 In this infographic we tell you the keys to the EU''s first common European data space in a specific sector and the only one that regulates primary, as well as secondary data use. Discover the areas of action, related projects and next steps. |
Data and its governance in the European Artificial Intelligence Regulation
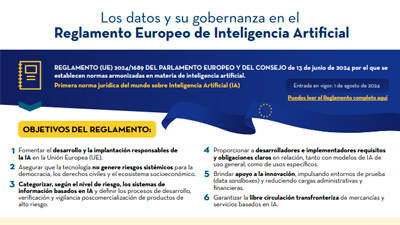 |
Published: October 2024 The European Regulation on Artificial Intelligence seeks to constitute a reference framework for the development of any system and to inspire codes of good practice, technical standards and certification schemes. In this infographic we tell you about its keys. |
Examples of open datasets published by local entities
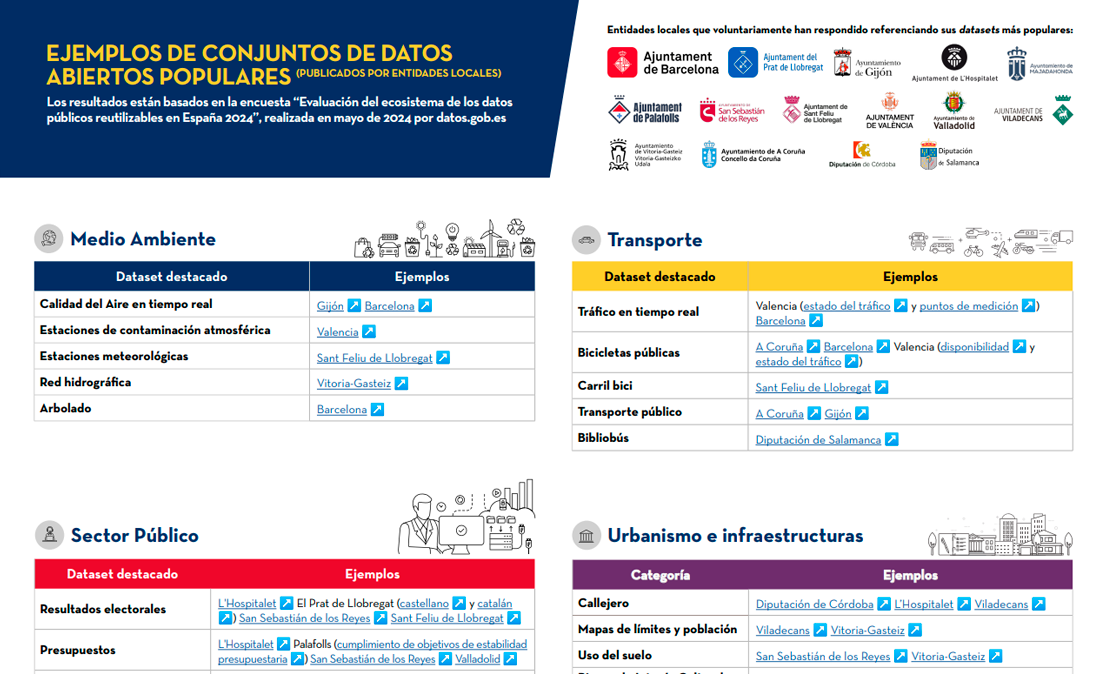 |
Published: September 2024 In order to learn about their open data activities, a survey was conducted last May in which representatives of local entities participated. This infographic collects examples of the most popular datasets from their portals. |
European Declaration on Digital Rights and Principles
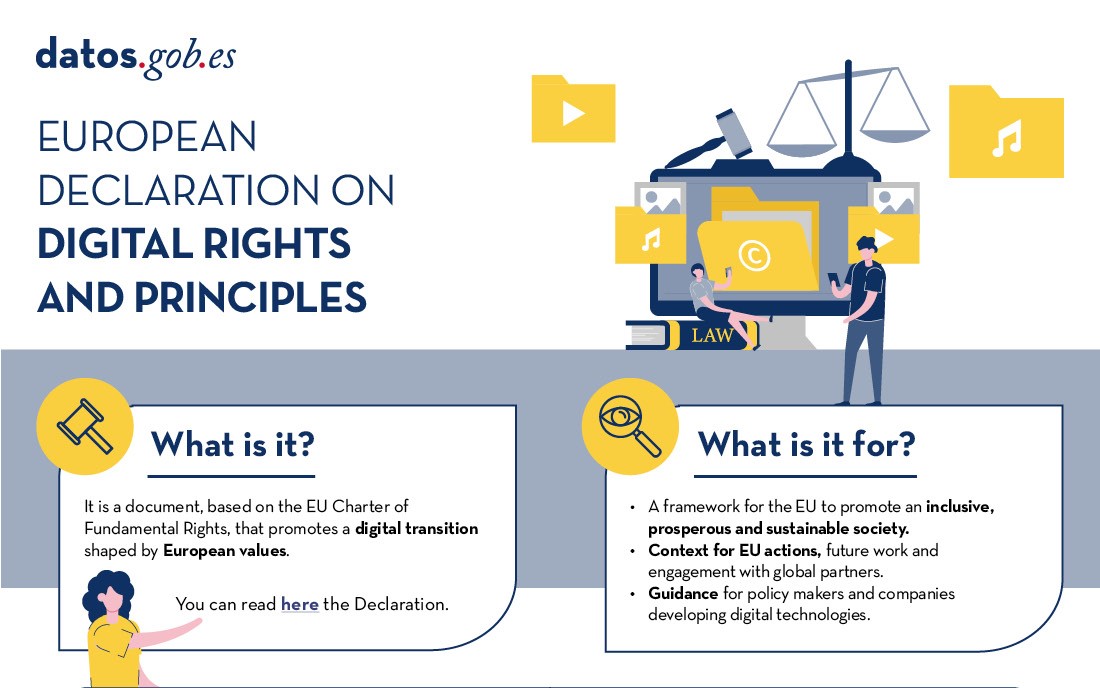 |
Published: August 2024 The Declaration is based on the EU Charter of Fundamental Rights, which promotes a digital transition shaped by European values. In this infographic, the principles that shape it and the opinion of European citizenship for each of them are presented. |
Artificial intelligence strategy 2024
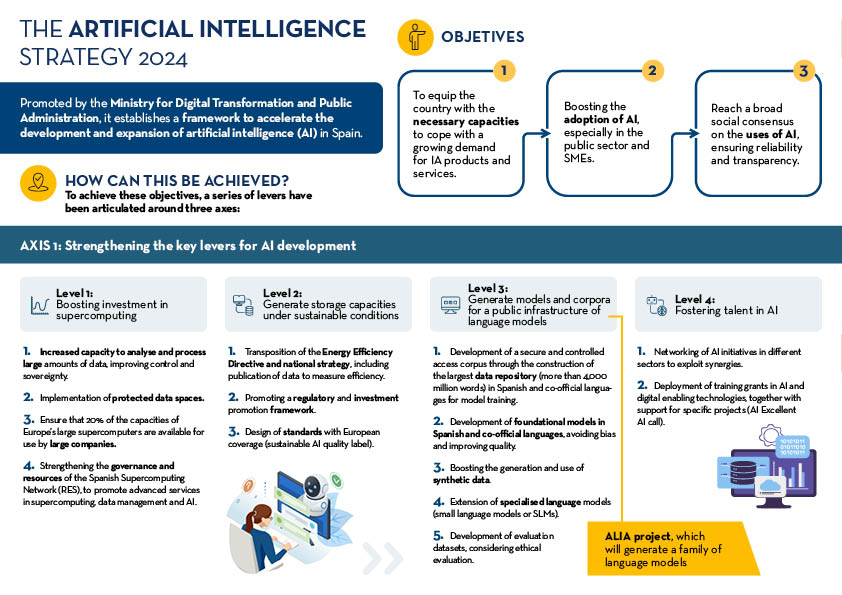 |
Published: July 2024 The new artificial intelligence strategy 2024 establishes a framework to accelerate the development and expansion of AI in Spain. It is articulated around three main axes developed through eight lines of action, which are detailed in this infographic. |
High value datasets
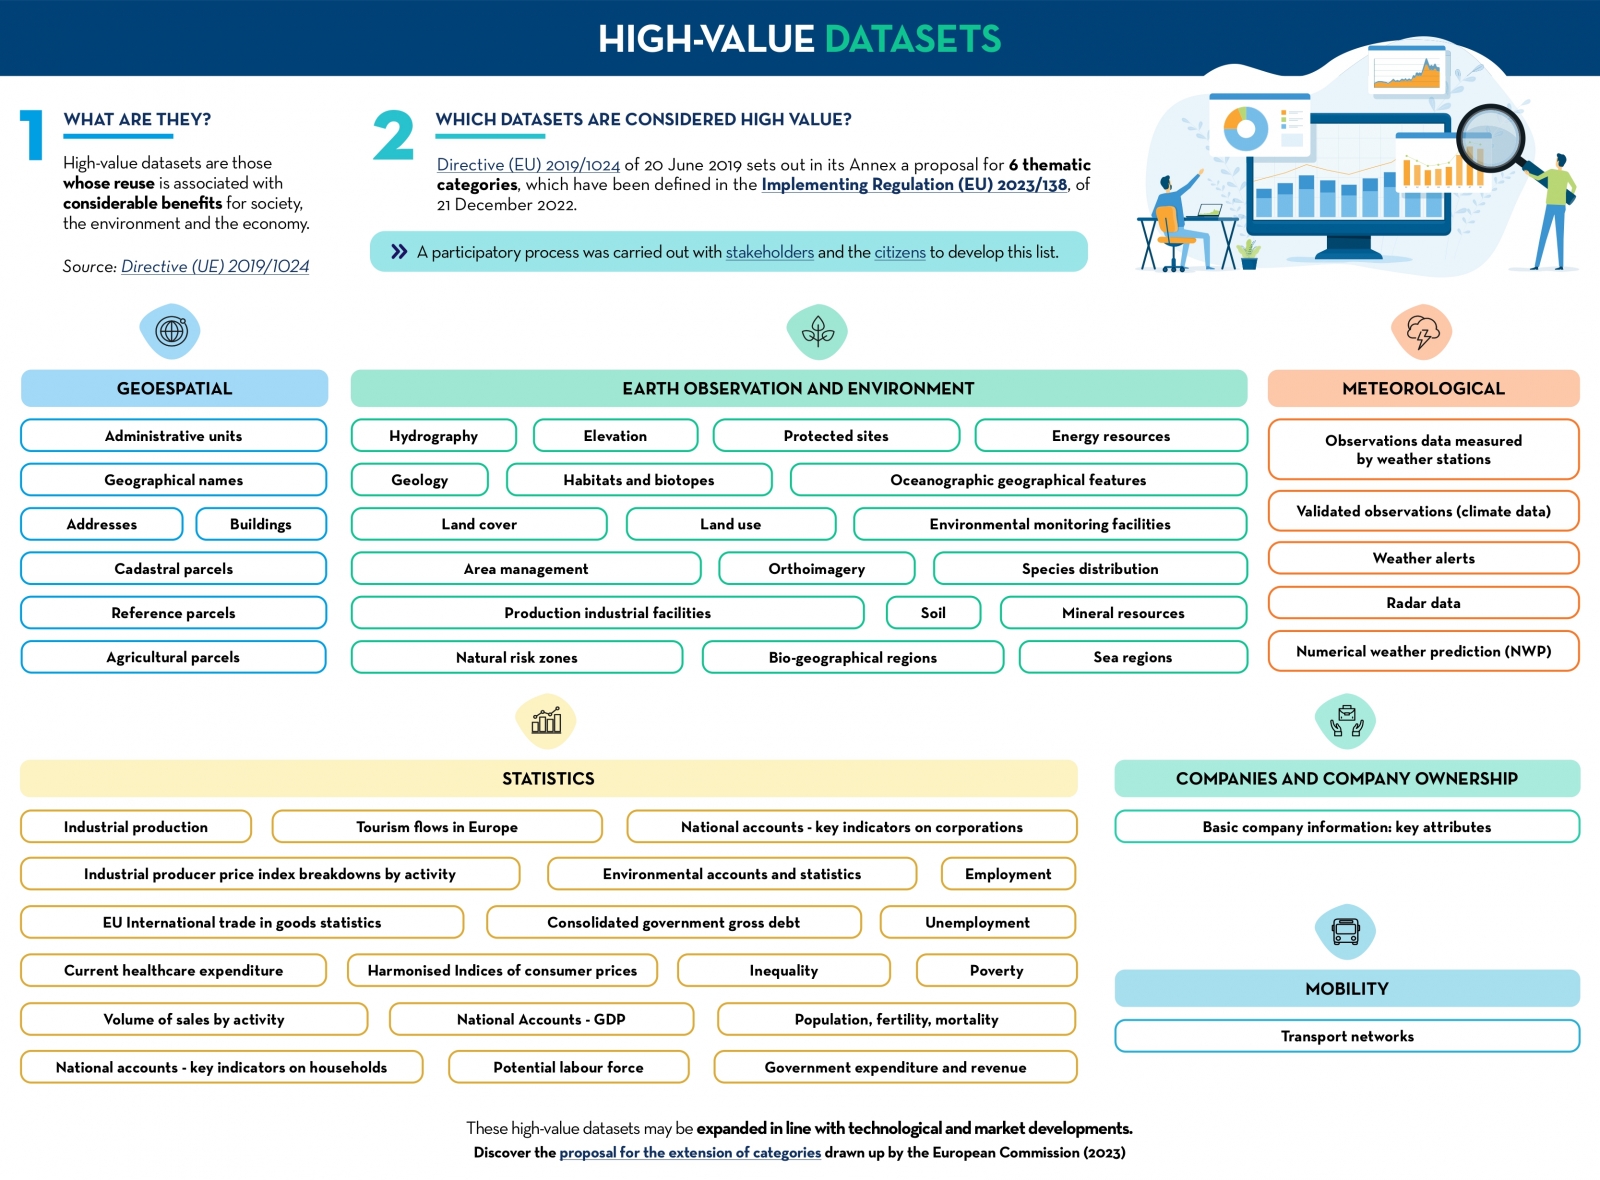 |
Published: March 2024 This infographic shows the high-value data categories defined in Implementing Regulation (EU) 2023/138 of 21 December 2022. Find out what these categories are and how the datasets linked to them should be published. A one-page version has also been created to facilitate printing: click here. |
Gaia-X and European data spaces
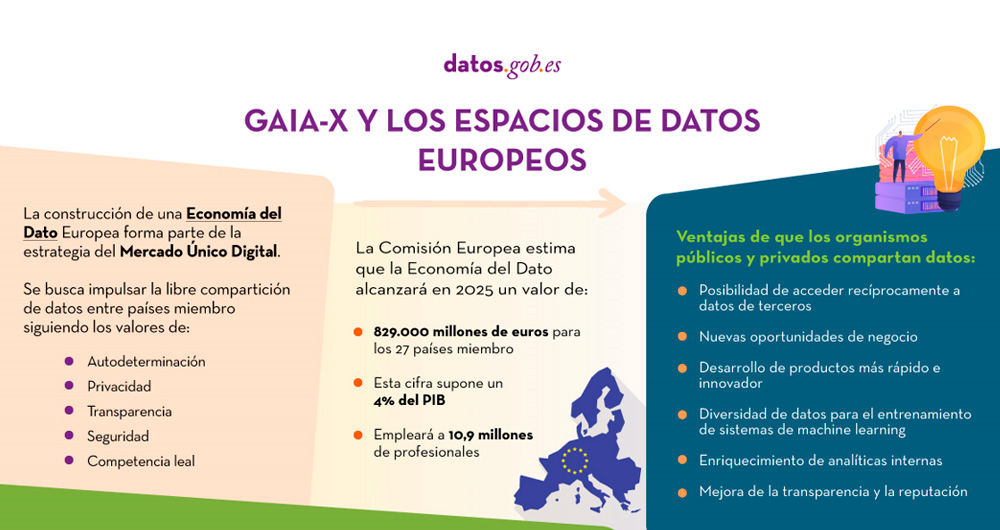 |
Published: April 2022 This infographic shows the context driving the development of data spaces, focusing on some related European initiatives such as Gaia-X and ISDA. |
Trends in open data around the world
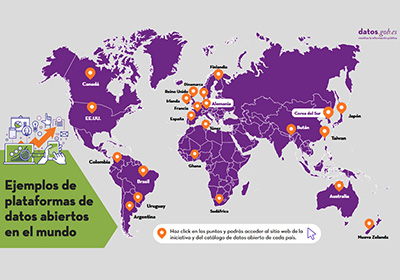 |
Published: November 2021 Through this interactive infographic you can easily access the open data platforms and datasets of several leading countries. The infographic is accompanied by a post which briefly analyzes the strategies and next steps to be taken by these initiatives, showing what are the main trends worldwide. |
The most demanded datasets published by local entities
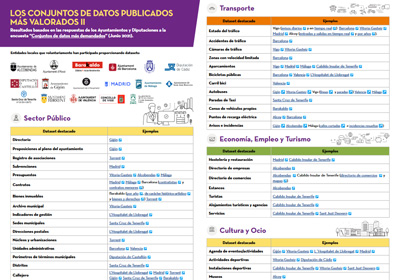 |
Published: July 2021 17 local entities, including city councils, provincial councils and an island council, share with the users of datos.gob.es which are their most demanded datasets, among all those published under standards that favour their reuse. The datasets are segmented by thematic categories, highlighting transport, environment and public sector data. |
The Open Government and Public Data Strategies of the Autonomous Communities
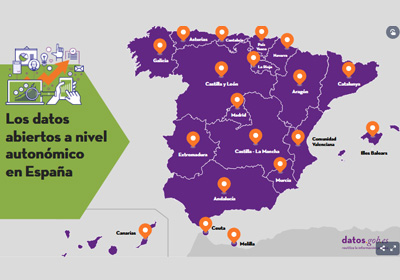 |
Published: June 2021 An interactive map shows the open data initiatives at regional level in Spain, including in each case the url to its portal and the main documents detailing its strategic framework. The infographic is accompanied by an article which addresses the commitments made by each Autonomous Region in the IV Open Government Plan of Spain. |
What are the most demanded datasets?
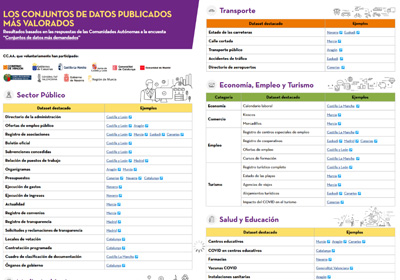 |
Published: May 2021 This infographic compiles some 100 datasets published by regional organizations, which are offered in open format according to standards that facilitate their reuse. The datasets are shown divided by thematic categories, highlighting those related to the public sector, the economy, employment and tourism, and the environment. |
The data-related strategies that will mark 2021
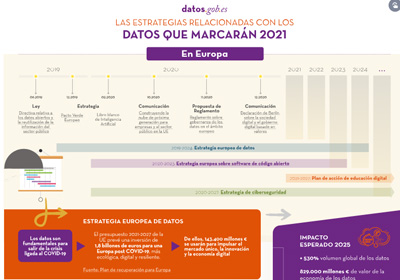 |
Published: January 2021 This interactive infographic shows the strategic, regulatory and political situation affecting the world of open data in Spain and Europe. It includes the main points of the European Data Strategy, the Regulation on Data Governance in Europe or the Spain Digital 2025 plan, among others. |
Documentación
Thanks to these infographics you can learn a little more about the activity of datos.gob.es and the functionalities of the platform. New contents will be published periodically.
What is datos.gob.es?
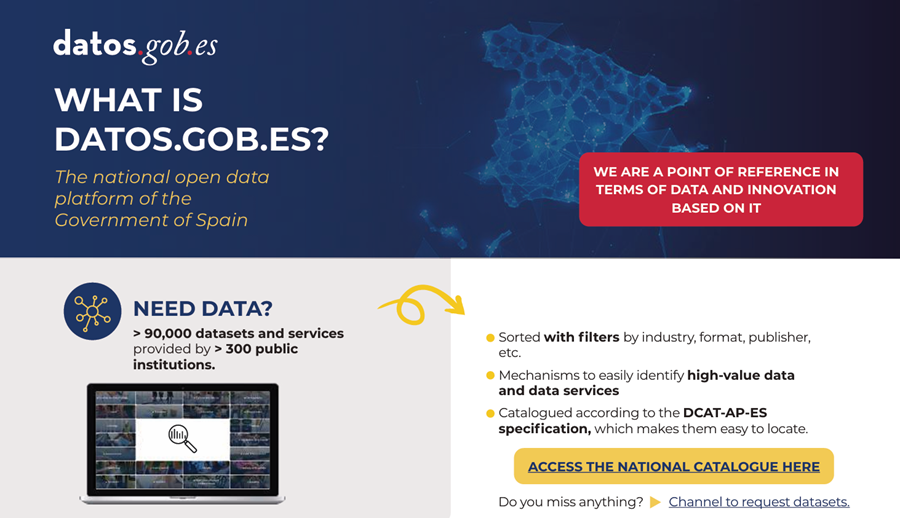 |
Published: September 2025 In this infographic, we have summarized the main resources you can find on our platform. Datos.gob.es not only hosts the National Open Data Catalog (with nearly 100,000 data sets and services), but also offers a wealth of content to keep you up to date with the latest news and trends and learn about data. A brochure with further information about datos.gob.es is also available. |
Dissemination of the data culture
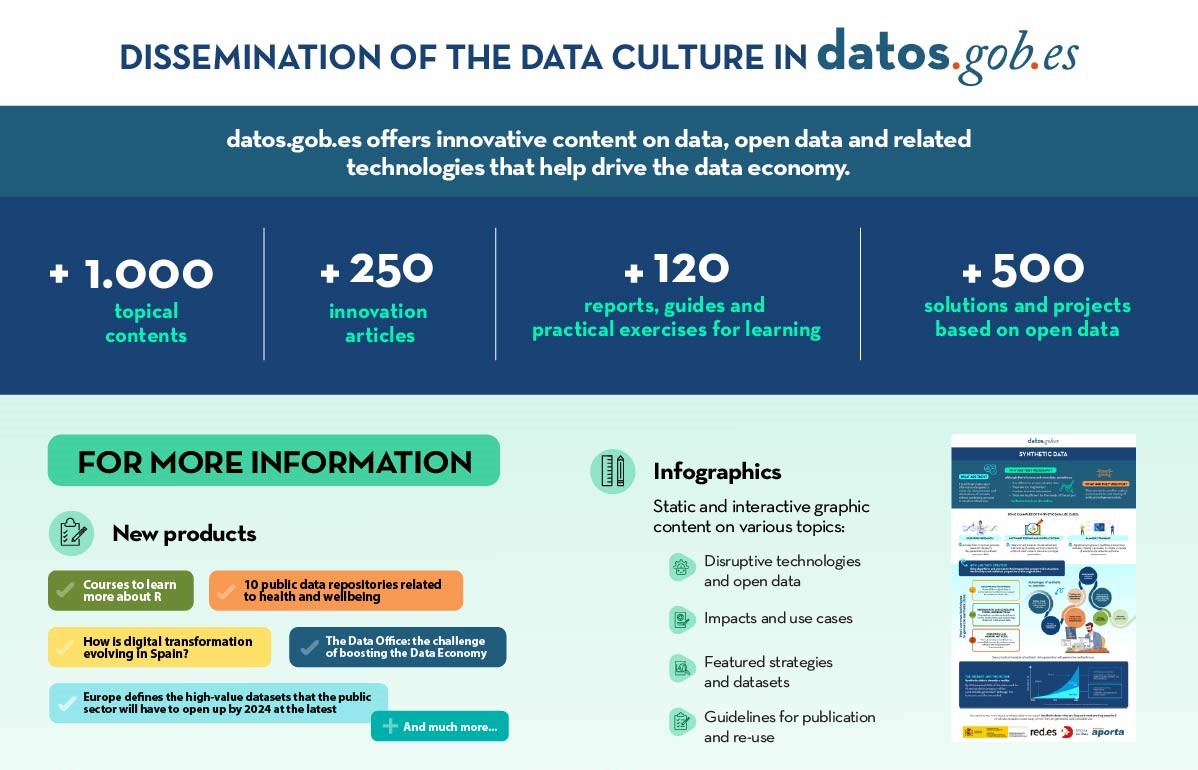 |
Published: January 2023 datos.gob.es offers innovative content on data, open data and related technologies that help drive the data economy. In this infographic you can find out what they are and some impact figures. |
About the Aporta initiative
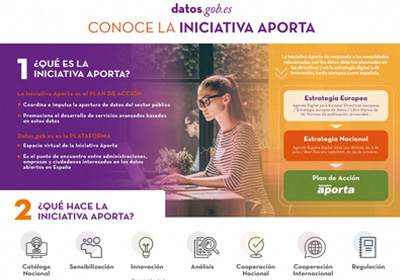 |
Published: October 2020 Do you know the difference between the Aporta Initiative and datos.gob.es? In this infographic we explain it to you. Discover also the seven lines of action of the project and the actors that collaborate with us. |
How to publish data in datos.gob.es catalogue?
 |
Published: July 2020 Publishing organizations have two ways of registering their data in the National Open Data Catalog, hosted in datos.gob.es: federated and manual. This interactive infographic shows both processes in a simple way, as well as the mechanisms used to ensure that the metadata meet the quality standards. |
Documentación
At the end of each year, at datos.gob.es we take an overview of the activity carried out during the last 365 days. In these infographics you will find a summary of the actions carried out and the achievements. New content will be published periodically.
- Balance of the Aporta Initiative 2025
- Balance of the Aporta Initiative 2024
- Balance of the Aporta Initiative 2023
- Balance of the Aporta Initiative 2022
- Balance of the Aporta Initiative 2021
- Balance of the Aporta Initiative 2020
- Balance of the Aporta Initiative 2019
- Balance of the Aporta Initiative 2018
- Balance of the Aporta Initiative 2017
Documentación
"Information and data are more valuable when they are shared and the opening of government data could allow [...] to examine and use public information in a more transparent, collaborative, efficient and productive way". This was, in general terms, the idea that revolutionized more than ten years ago a society for which the opening of government data was a totally unknown action. It is from this moment that different trends began to emerge that will mark the evolution of the open data movement around the world.
This report, written by Carlos Iglesias, analyzes the main trends in the still incipient history of global open data, paying special attention to open data within public administrations. To this end, this analysis reflects the main problems and opportunities that have arisen over the years, as well as the trends that will help to continue driving the movement forward:
For the preparation of this report, we have used as a reference the report "“The Emergence of a Third Wave of Open Data”, which analyses the new stage that is opening up in the world of open data, published by the Open Data Policy Lab. This analysis serves as a reference to present both the current trends and the most important challenges associated with open data.
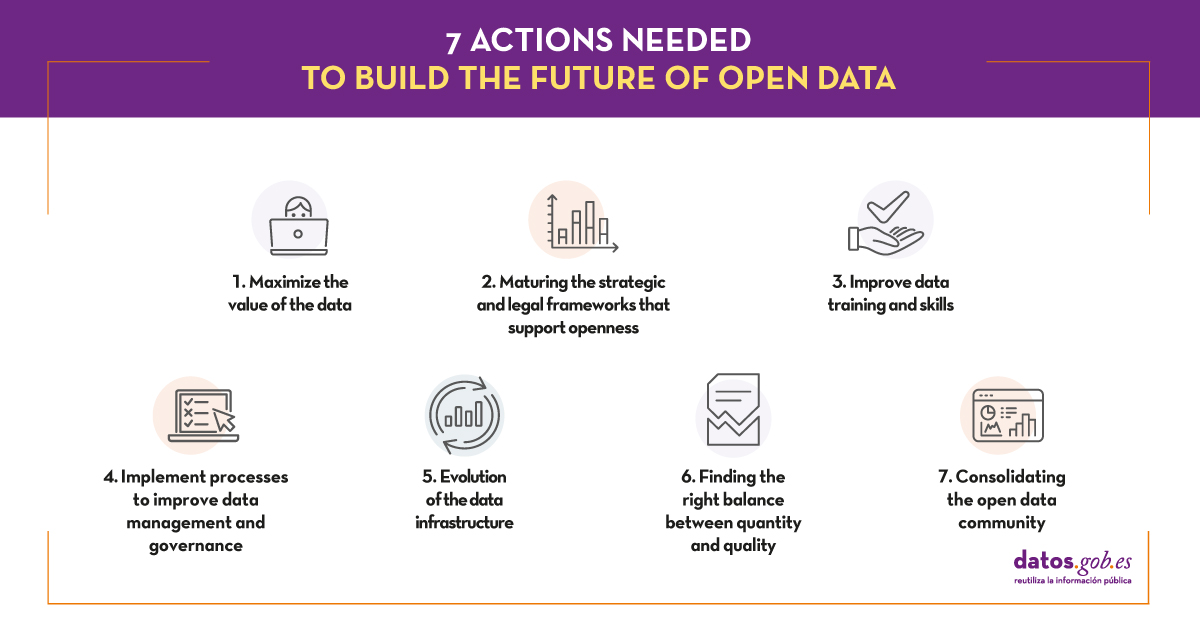
The final part of this report presents some of the actions that will play a key role in strengthening and consolidating the future of open data over the next ten years. These actions have been adapted to the European Union environment, and specifically to Spain (including its regulatory framework).
Below, you can download the full report, as well as its executive summary and a summary presentation in power point format.
Documentación
A large number of different data sources with different contents and formats coexist in an open data portal. It is therefore necessary to provide each file, resource or content on the network with a context or definition that allows people, and also machines, to interpret its meaning. This is where the concept of Linked data comes in.
Linked Data allows the web to be used as a single large global database. Following this publishing paradigm, data is available in context and interconnected for reuse. Linked Data emerged from the Semantic Web project inspired by Tim Berners-Lee, the father of the Web, from the need to introduce contextual information in the form of metadata on the Web.
The document "LinkedData as an open data model" briefly explains the basic concepts to understand how the semantic web and linked data works, such as the case of URIs or unique resource identifiers, ontologies or vocabularies that allow the description of relationships between them, to focus on how Aragon has implemented these technologies to develop different services, such as:
- The Interoperable Information Structure (EI2A), an ontology that homogenises structures, vocabularies and characteristics to respond to the diversity and heterogeneity of existing data within the Administration, within the framework of Aragon Open Data. The document explains some of the ontologies and vocabularies used for the development.
- The European Legislation Identifier (ELI), which allows online access to legislation in a formalised format that facilitates its reuse.
- The semantic infrastructure in Aragon Open Data, where the use of the Virtuoso tool for the storage of linked data stands out. The document explains the characteristics of this universal server, whose architecture allows the persistence of data in RDF-XML formats, among others. In addition, it explains how the bank that stores triplets in a native way for resources relationships works and shows examples of services of Aragon Open data that exploit these triplets of data as Aragopedia and Aragon Open Data Pool.
You can then download the full document (only available in Spanish).
This document is part of the series of educational materials and technological articles that Aragón open Data is producing in order to explain how they have deployed different solutions to respond to the needs for location, access and reuse of the different sets of data. You can complete your reading with another volume in the series: "How to implement CKAN: real case of the Aragon Open Data portal".