Blog
Like every other year, the EU Open Data Portal has just published the results of its report Open Data Maturity 2022. It is a study that assesses the maturity of European countries in the field of open data and it provides an overview of the good practices followed in Europe, which can be transferred to other national and local contexts. Both the member states of the European Union (EU-27) and other countries in the region have participated in the study.
Spain has achieved a score of 92%, thirteen points above the EU27 average. With this score, it is in the leading group. France secured first place, followed by Ukraine and Poland.
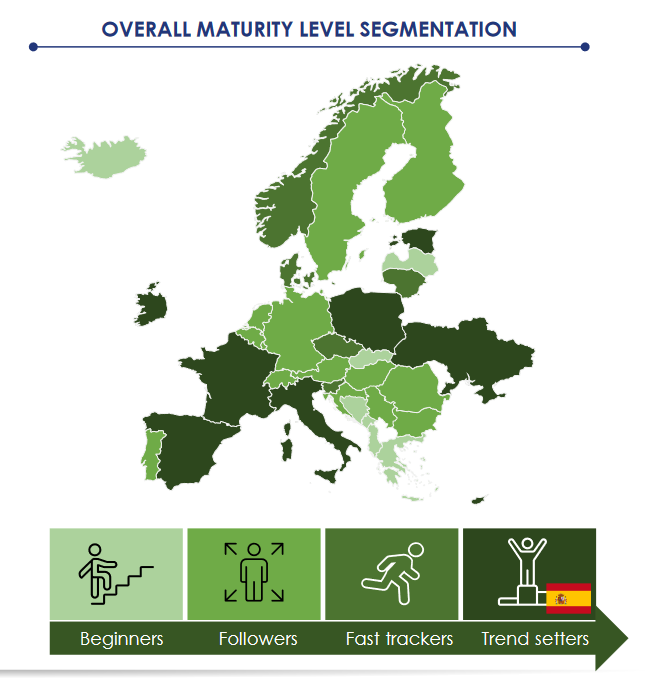
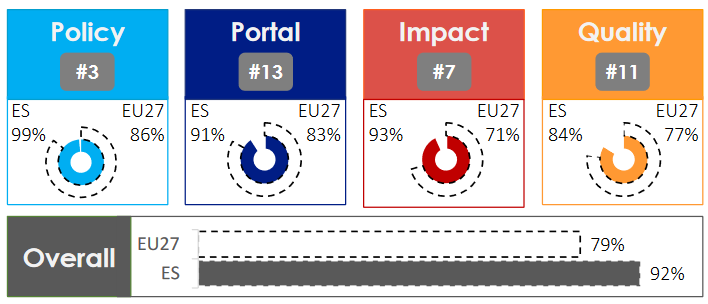
Spain is above the European average for the 4 indicators analysed
The report measures maturity in relation to four aspects of open data:
- Policy, focused on the open data strategies of the different countries.
- Impact, which analyses the activities carried out to monitor and measure the reuse of open data and their impact.
- Portal, focused on evaluating the functions and characteristics of the national platform that allows users to access open data and promote interaction within the community.
- Quality, which examines mechanisms to ensure the quality of (meta)data.
In all four categories, Spain is ahead of the EU27 average, particularly standing out in the policy section. Some of the aspects that the report highlights in Spain are the open mechanisms for communicating and interacting from datos.gob.es with the open data community, the use of dashboards to monitor the use of datasets or some specific examples of use cases such as Climate change scenario viewer or Gijón in a click.
With this score, Spain falls within the so-called trendsetter group. The countries that belong to this group stand out for their strong commitment to open data, borne out by an advanced strategy, more mature platforms and an active methodology for measuring the impact of open data.

3 key trends in Europe
This year's analysis highlights three trends at European level:
- EU Member States are preparing for the implementation of the high-value datasets regulation. Directive 2019/1024 highlighted, amongst other issues, a specific regime for the so-called high-value data, in other words, those whose reuse is associated with considerable benefits for society, the environment and the economy. Although their implementing regulation has not yet been made public, 96% of EU Member States are already working on the identification of high-value data, especially in the categories of statistical, geospatial, Earth observation, environmental and meteorological data. In addition, 85% are already prepared to monitor and measure their level of reuse and 63% to ensure their interoperability with available data sets from other countries. Spain is no exception and it is one of the most advanced countries in this regard.
- Measuring the impact of open data is a priority for EU Member States, but it is a major challenge too. Countries are still interested in understanding and capturing open data reuse and value creation, but compiling data on the impact created remains challenging, especially in the economic area.
- In a post-pandemic world, European countries face new and old common challenges. The impact of the war in Ukraine has affected all countries, both socially and economically. Open data have proven to serve as a mechanism to help refugees or improve energy management. Other common challenges highlighted in the report are the lack of resources and qualified personnel or the difficulty in coordinating between the different levels of the administration, inter alia.
Recommendations to keep moving ahead in the field of open data
The report ends with a series of recommendations by groups of countries. In the case of open data trendsetters, the group to which Spain belongs, the report recommends focusing on maintaining the current ecosystem, experimenting and sharing knowledge.
To be precise, the focus should be placed on improving and consolidating open data ecosystems through the development of thematic communities of providers and reusers. It is also recommended to collaborate with data.europa.eu, other national data teams, universities and research institutions to develop an experimental impact evaluation framework.
High-value data sets stand out as one of the areas to prioritise, based on that which was previously indicated in Directive 2019/1024. In addition to preparing for the Data Governance Regulation, evaluating the existing options to expand the portals and assuming the role of public registry for those organisations linked to the altruistic transfer of data.
You can read the full report via this link.
Documentación
Este informe, que publica el Portal de Datos Europeo, analiza el potencial de reutilización de los datos en tiempo real. Los datos en tiempo real ofrecen información con alta frecuencia de actualización sobre el entorno que nos rodea (por ejemplo, información sobre el tráfico, datos meteorológicos, mediciones de la contaminación ambiental, información sobre riesgos naturales, etc.).
El documento resume los resultados y conclusiones de un seminario web organizado por el equipo del Portal de Datos Europeo celebrado el pasado 5 de abril de 2022, donde se explicaron diferentes formas de compartir datos en tiempo real desde plataformas de datos abiertos.
En primer lugar, el informe hace un repaso sobre el fundamento de los datos en tiempo real e incluye ejemplos que justifican el valor que aporta este tipo de datos para, a continuación, describir dos enfoques tecnológicos sobre cómo compartir datos en tiempo real del ámbito de IoT y el transporte. Incluye, además, un bloque que resume las principales conclusiones de las preguntas y comentarios de los participantes que giran, principalmente, en torno a difentes necesidades de fuentes de datos y funcionalidades requeridas para su reutilización.
Para terminar, basándose en el feedback y la discusión generada, se proporciona un conjunto de recomendaciones y acciones a corto y medio plazo sobre cómo mejorar la capacidad para localizar fuentes de datos en tiempo real a través del Portal de Datos Europeo.
Este informe se encuentra disponible en el siguiente enlace: "Datos en tiempo real: Enfoques para integrar fuentes de datos en tiempo real en data.europa.eu"
Noticia
Measuring the impact of open data is one of the challenges facing open data initiatives. Ther are a variety of methods, most of which combine quantitative and qualitative analysis in order to understand the value of specific datasets.
In this context, data.europa.eu, the European Open Data Portal, has launched a Use Case Observatory. This is a research project on the economic, governmental, social and environmental impact of open data.
What is the Use Case Observatory?
For three years, from 2022 to 2025, the European Data Portal will monitor 30 cases of re-use of open data. The aim is to:
- Assess how the impact of open data is created.
- Share the challenges and achievements of the analysed re-use cases
- Contribute to the debate on the methodology to be used to measure such impact.
The analysed use cases refer to four areas of impact:
- Economic impact: includes reuse cases related to business creation and (re)training of workers, among others. For example, solutions that help identify public tenders or apply for jobs are included.
- Governmental impact: This refers to reuse cases that drive e-government, transparency and accountability.
- Social impact: includes cases of re-use in the fields of healthcare, welfare and tackling inequality.
- Environmental impact: This is limited to cases of re-use that promote sustainability and energy reduction, including solutions related to air quality control or forest preservation.
To select the use cases, an inventory was made based on three sources: the examples collected in the maturity studies carried out each year by the European portal, the solutions participating in the EU Datathon and the examples of reuse available in the repository of use cases on data.europa.eu. Only projects developed in Europe were taken into account, trying to maintain a balance between the different countries. In addition, projects that had won an award or were aligned with the European Commission's priorities for 2019 to 2024 were highlighted. To finalise the selection process, data.europa.eu conducted interviews with representatives of the use cases that met the requirements and were interested in participating in the project.
Three Spanish projects among the use cases analysed
The selected use cases are shown in the following image:
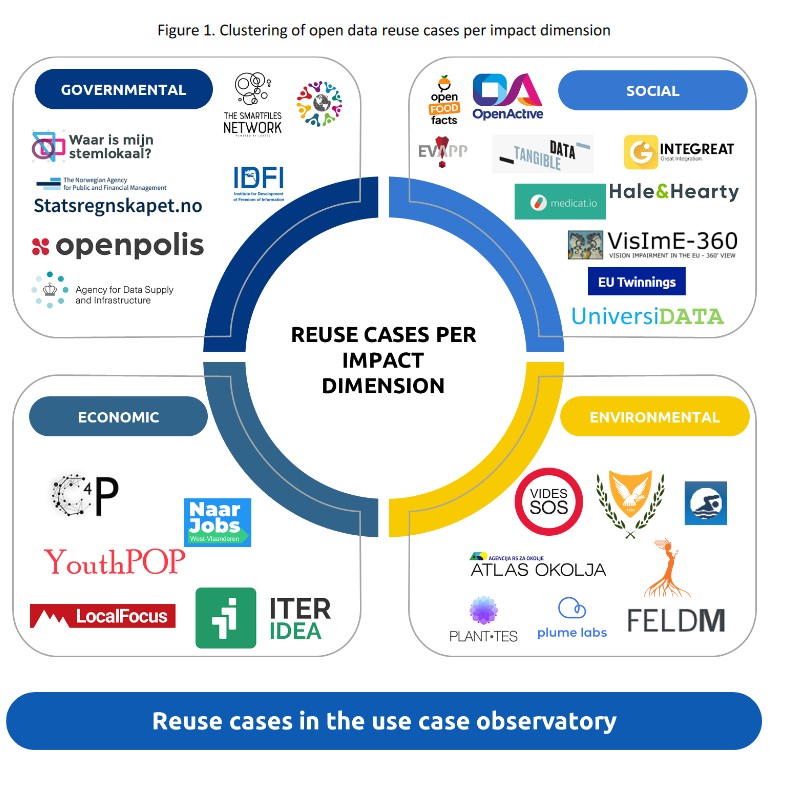
Among them, there are three Spaniards:
- In the Social Impact category is UniversiDATA-Lab, a public portal for the advanced and automatic analysis of datasets published by universities. This project, which won the first prize in the III Desafío Aporta, was conceived by the team that created UniversiData, a collaborative initiative oriented and driven by public universities with the aim of promoting open data in the higher education sector in Spain in a harmonised way. You can learn more about these projects in this interview.
- In the same category we also find Tangible data, a project focused on the creation of sculptures based on data, to bring them closer to non-technical people. Among other data sources, it uses datasets from NASA or Our World in Data.
- In the environment category is Planttes. This is a citizen science project designed to report on the presence of allergenic plants in our environment and the level of allergy risk depending on their condition. This project is promoted by the Aerobiological Information Point (PIA) of the Institute of Environmental Science and Technology (ICTA-UAB) and the Department of Animal Biology, Plant Biology and Ecology (BABVE), in collaboration with the Computer Vision Centre (CVC) and the Library Living Lab, all of them at the Autonomous University of Barcelona (UAB).
First report now available
As a result of the analysis carried out, three reports will be developed. The first report, which has just been published, presents the methodology and the 30 selected cases of re-use. It includes information on the services they offer, the (open) data they use and their impact at the time of writing. The report ends with a summary of the general conclusions and lessons learned from this first part of the research project, giving an overview of the next steps of the observatory.
The second and third reports, to be released in 2024 and 2025, will assess the progress of the same use cases and expand on the findings of this first volume. The reports will focus on identifying achievements and challenges over a three-year period, allowing concrete ideas to be extrapolated to improve methodologies for assessing the impact of open data.
The project was presented in a webinar on 7 October, a recording of which is available, together with the presentation used. Representatives from 4 of the use cases were invited to participate in the webinar: Openpolis, Integreat, ANP, and OpenFoodFacts.
Documentación
This report published by the European Data Portal explores the so-called Citizen Generated Data (CGD). This category of data refers to those generated by citizens. There is a lack of this type of data within European open data portals, mainly due to the lack of publication and management of CGDs by public administrations.
The document analyzes various open data portals, whose main objective is to provide a vision of the CGDs that can be part of these portals and how to include them by public administrations. It should be noted that during the analysis, a framework is established for the description, reference, and characterization of the CGDs.
Finally, based on the conclusions of the previous analysis, the document offers a series of recommendations and guidelines for data publishers. The objective is to increase and improve the presence of CGDs in the publication of open data, involving citizens in the design of policy, processes and governance.
This report is available at the following link: "Data.europa.eu and citizen-generated data"
Noticia
The European Directive 2019/1024 on open data and re-use of public sector information emphasises, among many other aspects, the importance of publishing data in real time. In fact, the document talks about dynamic data, which it defines as "documents in digital format, subject to frequent or real-time updates due to their volatility or rapid obsolescence". According to the Directive, public bodies must make this data available for re-use by citizens immediately after collection, through appropriate APIs and, where possible, as a bulk download.
To explore this further, the European Data Portal, Data.europa.eu, has published the report “Real-time data 2022: Approaches to integrating real-time data sources in data.europa.eu” which analyses the potential of real-time data. It draws on the results of a webinar held by data.europa.eu on 5 April 2022, a recording of which is available on its website.
In addition to detailing the conclusions of the event, the report provides a brief summary of the information and technologies presented at the event, which are useful for real-time data sharing.
The importance of real-time data
The report begins by explaining what real-time data are: data that are frequently updated and delivered immediately after collection, as mentioned above. These data can be of a very heterogeneous nature. The following table gives some examples:
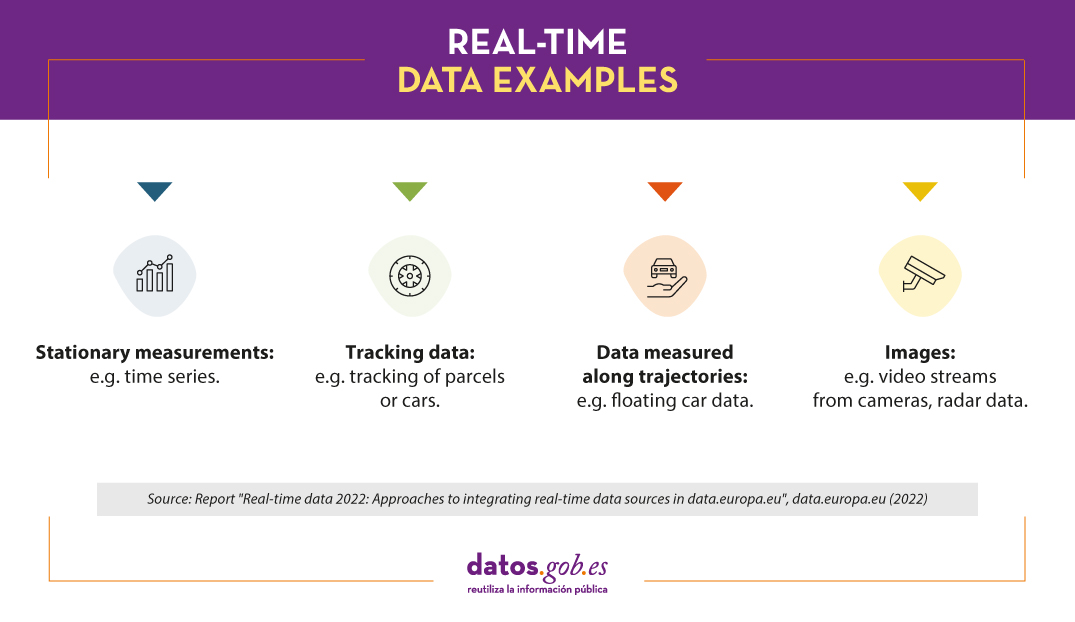
This type of data is widely used to shape applications that report traffic, energy prices, weather forecasts or flows of people in certain spaces. You can find out more about the value of real-time data in this other article.
Real-time data sharing standards
La interoperabilidad es uno de los factores más importantes a tener en cuenta a la hora de seleccionar la tecnología más adecuada para el intercambio de datos en tiempo real. Se precisa un lenguaje común, es decir, formatos de datos comunes e interfaces de acceso a datos que permitan el flujo de datos en tiempo real. Dos estándares que ya son muy utilizados en el ámbito del Internet de las cosas (IoT en sus siglas en inglés) y que pueden ayudar en este sentido son:
SensorThings API (STA)
SensorThings API, from the Open Geospatial Consortium, emerged in 2016 and has been considered a best practice for data sharing in compliance with the INSPIRE Directive.
This standard provides an open and unified framework for encoding and providing access to sensor-generated data streams. It is based on REST and JSON specifications and follows the principles of the OData (OASIS Open Data Protocol) standard.
STA provides common functionalities for creating, reading, updating and deleting sensor resources. It enables the formulation of complex queries tailored to the underlying data model, allowing more direct access to the specific data the user needs. Query options include filtering by time period, observed parameters or resource properties to reduce the volume of data downloaded. It also allows sorting the content of a result by user-specified criteria and provides direct integration with the MQTT standard, which is explained below.
Message Queuing Telemetry Transport (MQTT)
MQTT was invented by Dr. Andy Stanford-Clark of IBM and Arlen Nipper of Arcom (now Eurotech) in 1999. Like STA, it is also an OASIS standard.
The MQTT protocol allows the exchange of messages according to the publish/subscribe principle. The central element of MQTT is the use of brokers, which take incoming messages from publishers and distribute them to all users who have a subscription for that type of data. In this type of environment, data is organised by topics, which are freely defined and allow messages to be grouped into thematic channels to which users subscribe.
The advantages of this system include reduced latency, simplicity and agility, which facilitates its implementation and use in constrained environments (e.g. with limited bandwidth or connectivity).
In the case of the European portal, users can already find real-time datasets based on MQTT. However, there is not yet a common approach to providing metadata on brokers and the topics they offer, and work is still ongoing.
Other conclusions of the report
As mentioned at the beginning, the webinar on 5 April also served to gather participants' views on the use of real-time data, current challenges in data availability and needs for future improvements. These views are also reflected in this report.
Among the most valued categories of real-time data, users highlighted traffic information and weather data. Data on air pollution, allergens, flood monitoring and stock market information were also mentioned. In this respect, more and more detailed data were requested, especially in the field of mobility and energy in order to be able to compare commodity prices. Users also highlighted some drawbacks in locating real-time data on the European portal, including the heterogeneity of the information, which requires the use of common standards and formats across countries.
Finally, the report provides a set of recommendations on how to improve the ability to locate real-time data sources through data.europa.eu. To this end, a series of short and medium-term actions have been established, including the collection of use cases, support for data providers and the development of best practices to unify metadata.
You can read the full report here.
Documentación
This report published by the European Data Portal (EDP) aims to help open data users in harnessing the potential of the data generated by the Copernicus program.
The Copernicus project generates high-value satellite data, generating a large amount of Earth observation data, this is in line with the European Data Portal's objective of increasing the accessibility and value of open data.
The report addresses the following questions, What can I do with Copernicus data? How can I access the data?, and What tools do I need to use the data? using the information found in the European Data Portal, specialized catalogues and examining practical examples of applications using Copernicus data.
This report is available at this link: "Copernicus data for the open data community"
Documentación
This report published by the European Data Portal (EDP) covers the following topics.
What are the needs of open data re-users of public sector institutions in Europe? This question is key to facilitate the publication of open data and support for re-users of EU institutions and Member States' public authorities based on their needs for policy-making, service delivery and organizational management.
This discussion paper provides an overview of the state of existing methods and indicators in the European open data landscape to assess the needs of public institutions as data re-users.
This overview serves as a basis for a discussion with public sector stakeholders on appropriate methods and indicators for measuring the demand for data from public institutions to encourage the publication of demand-driven data.
The report is available at this link: "Measuring Data Demand Within the Public Sector"
Documentación
This report published by the European Data Portal (EDP) covers the following topics.
Making data available as open data in all EU Member States is vital to harnessing its potential for European society and economy. In order to increase impact effectively, efforts must target the datasets that have the greatest potential in society and the economy.
In the regulation on open data and re-use of public sector information, the European Commission is mandated to adopt an implementing regulation specifying high-value datasets.
The line of argument developed in this report parallels what the Commission has done during the first quarter of 2021, to prepare the implementing regulation that includes a list of high-value datasets. This report reviews relevant literature, policy decisions and national initiatives to enable a deeper understanding of the situation around assessing the value of datasets.
The report is available at this link: "High-Value Datasets: Understanding the Data Providers' Perspective"
Documentación
This report published by the European Data Portal (EDP) explores existing and emerging developments and initiatives around data sharing using data spaces.
The objective is twofold: to identify the owners of open data involved in the implementation of data spaces and to reflect on the role that open data portals (with special attention to data.europa.eu) could play in this implementation.
After documentary research and interviews with the promoters of data spaces, it is analyzed how data.europa.eu could be positioned in the common European data spaces that are emerging.
The report is available at this link: "Data.europa.eu y los espacios comunes de datos europeos: un informe sobre retos y oportunidades"
Documentación
This report published by the European Data Portal (EDP) aims to advance the debate on the medium and long-term sustainability of open data portal infrastructures.
It provides recommendations to open data publishers and data publishers on how to make open data available and how to promote its reuse. It is based on the previous work done by the data.europa.eu team, on research on open data management, and on the interaction between humans and data.
Considering the conclusions, 10 recommendations are proposed for increasing the reuse of data.
The report is available at this link: " Principles and recommendations to make data.europa.eu data more reusable: A strategy mapping report "