Blog
The Open Data Maturity Report is an annual evaluation that since 2015 has analysed the development and evolution of open data initiatives in the European Union. Coordinated by the European Data Portal (data.europa.eu) and carried out in collaboration with the European Commission, this report assesses 36 participating countries: the 27 EU Member States, 3 European Free Trade Association countries (Iceland, Norway and Switzerland) and 6 candidate countries.
The report assesses four key dimensions:
- Policy (strategies and regulatory frameworks)
- Portal (functionalities and usability)
- Quality (metadata and data standards)
- Impact (reuse and benefits generated)
In the 2025 edition, Spain stood out with a score of 100% in the impact block compared to the European average of 82.1%. In general terms, it occupies the fifth position among the countries of the European Union with a total score of 95.6%, forming part of the group of countries that prescribe trends.
A differential aspect of this edition of the report is the incorporation of a descriptive and contextual approach that complements the traditional regulatory model, creating clusters of countries to allow fairer comparisons. These clusters group countries with similar economic, social, political, and digital characteristics, and are based on profiles that explain how open data policies are implemented, not just what results are obtained. The aim is to invite countries to look at their peers , learn from comparable experiences and promote more effective peer-to-peer learning than based solely on general rankings.
In addition to quantifying it, the report includes use cases and good practices carried out by countries to open and reuse public sector data. In this post, we highlight some of them that can serve as inspiration to continue improving our open data ecosystem.
Croatia's inclusive and coordinated governance
One of the most noteworthy aspects of the 2025 report is how some countries have managed to establish strong governance structures that ensure coordination between different levels of administration and multi-stakeholder participation.
Croatia stands out for having established in 2025 the Coordination for the Implementation of the Open Data Policy, a multisectoral body that monitors regulatory compliance, improves data accessibility, and supports authorities. This model ensures broad participation and ensures that national and local initiatives are aligned. The national portal functions as a central hub, complemented by local portals such as the one for the city of Zagreb. In addition, knowledge exchanges are encouraged through coordination meetings, regular updates and collaborations with universities, such as the Faculty of Electrical and Computer Engineering at the University of Zagreb.
France's complete data governance structure
This country leads the ranking of the Open Data Maturity Report thanks, among others, to its comprehensive governance model that integrates open data roles at all administrative levels. At the national level, the General Data Administrator coordinates public data policy and oversees a network of chief data officers in each ministry. Etalab, the national open data and digital innovation unit, manages this network and provides technical support.
At the ministerial level, each data controller manages the data policy (openness, quality and reuse), supported by Etalab. Some ministries also appoint specific open data officers and data stewards who handle technical and organizational aspects of the publication. At the local level, each regional representative (préfet) designates a referent for data, algorithms and source codes. The Digital Inter-Ministerial Directorate also coordinates a network of API managers to enable dynamic access to data. They also ensure compliance with DCAT-AP in their metadata, as we do in Spain.
Effective implementation: from strategy to action in Italy
Italian public administrations are obliged to adopt data publication plans, following national guidelines, which prioritise high-value datasets, dynamic data and user-requested information. The implementation is supported by a robust monitoring system. The Agency for Digital Italy (AgID) tracks progress through its Digital Transformation Dashboard, which reports the growth of datasets in dati.gov.it.
Policies are updated regularly: the latest three-year plan (2024-2026) was adopted in December 2024. To assist data holders and officials, AgID provides guidance, conducts webinars, and launched the AgID Academy to strengthen digital competencies.
Culture of reuse in Poland and Ukraine
A crucial aspect of encouraging open data is to provide practical resources to guide public organizations throughout the process. Poland stands out for its open data manual, the second edition of which was published by the Ministry of Digital Affairs.
This updated handbook introduces new categories of data, explains how regulations shape open data policies, and introduces the Poland Data Portal.
The handbook functions as a checklist for offices, guiding them through their responsibilities to open data and foster a culture of reuse and include tools such as an openness checklist for compliance.
In this regard, Ukraine has also adopted an approach towards reuse and the generation of resources that incentivise this reuse of data. The Ministry of Digital Transformation has developed a comprehensive set of resources and tools including detailed technical documentation and templates to help prepare and publish datasets aligned with national standards, covering metadata structuring, licensing, and compliance with the DCAT-AP standard.
The national portal includes functionalities for tracking the publication and reuse of datasets. Suppliers receive feedback on the quality and completeness of their metadata, helping them identify areas for improvement. In addition, regular training sessions and workshops are organized to develop the skills of publishers, promoting a shared understanding of open data principles and technical requirements.
Albania: comprehensive redesign of the portal
This country exemplifies the maturity improvements that can be achieved through a comprehensive update of the national open data portal. The large-scale revamp of the portal improved usability, transparency, and user engagement.
The updated portal now features a dataset rating system (1-5 stars), a dedicated news section on open data topics , and multiple notification options, including RSS and Atom feeds, and email. Users can track the progress of their data requests, which are actively monitored and responses summarized in publicly available reports.
To better understand and respond to user needs, the portal team tracks search keywords, analyzes traffic, and conducts user surveys and workshops.
Lithuania: official monitoring methodology
One of the key practices highlighted in the report is the adoption of formal frameworks and structured methodologies that provide a systematic way to assess the impact of open data. Lithuania excels with a comprehensive approach because it defines how institutions should report on open data activities, ensuring consistency, accountability, and compliance across the public sector.
In addition, the Ministry of Economy and Innovation made calculations to estimate the economic impact of open data. This analysis provides quantifiable evidence of the contribution of open data to innovation, productivity and job creation. The results show that open data in Lithuania creates a market value of approximately €566 billion (around 1.2% of GDP) and supports close to 8,000 value-added jobs.
Germany: systematic funding for collaboration
Germany's mFund initiative provides structured financial support for mobility-related data projects, fostering partnerships beyond government.
An example is the miki (mobil im Kiez) project, which develops navigation and orientation solutions for people with limited mobility through the active engagement of civil society. The team created a national prototype with visualizations for cities such as Cologne, Kassel, Munich, Potsdam and Saarbrücken, showing building barriers and road surfaces. These visualizations will be integrated into Wheelmap.org, helping individuals with mobility disabilities.
Conclusion
In conclusion, the Open Data Maturity Report 2025 demonstrates that the most open data mature European countries share common characteristics: inclusive and well-structured governance, effective implementation supported by planning and monitoring, practical support to data publishers, continuous technical innovation in portals and, crucially, systematic impact measurement.
The good practices highlighted here are transferable and adaptable. We invite Spanish public administrations to explore these experiences, adapt them to their local contexts and share their own innovations, thus contributing to an increasingly robust and impact-oriented European open data ecosystem.
Noticia
Spain once again stands out in the European open data landscape. The Open Data Maturity 2025 report places our country among the leaders in the opening and reuse of public sector information, consolidating an upward trajectory in digital innovation.
The report, produced annually by the European data portal, data.europa.eu, assesses the degree of maturity of open data in Europe. To do this, it analyzes several indicators, grouped into four dimensions: policy, portal, quality and impact. This year's edition has involved 36 countries, including the 27 Member States of the European Union (EU), three European Free Trade Association countries (Iceland, Norway and Switzerland) and six candidate countries (Albania, Bosnia and Herzegovina, Montenegro, North Macedonia, Serbia and Ukraine).
This year, Spain is in fifth position among the countries of the European Union and sixth out of the total number of countries analysed, tied with Italy. Specifically, a total score of 95.6% was obtained, well above the average of the countries analysed (81.1%). With this data, Spain improves its score compared to 2024, when it obtained 94.8%.
Spain, among the European leaders
With this position, Spain is once again among the countries that prescribe open data (trendsetters), i.e. those that set trends and serve as an example of good practices to other States. Spain shares a group with France, Lithuania, Poland, Ukraine, Ireland, the aforementioned Italy, Slovakia, Cyprus, Portugal, Estonia and the Czech Republic.
The countries in this group have advanced open data policies, aligned with the technical and political progress of the European Union, including the publication of high-value datasets. In addition, there is strong coordination of open data initiatives at all levels of government. Its national portals offer comprehensive features and quality metadata, with few limitations on publication or use. This means that published data can be more easily reused for multiple purposes, helping to generate a positive impact in different areas.
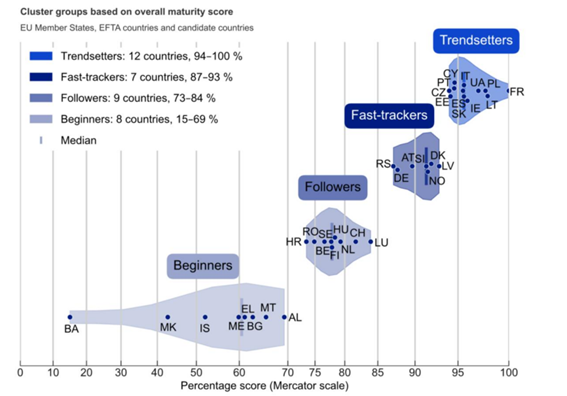
Figure 1. Member countries of the different clusters.
The keys to Spain's progress
According to the report, Spain strengthened its leadership in open data through strategic policy development, technical modernization, and reuse-driven innovation. In particular, improvements in the political sphere are what have boosted Spain's growth:
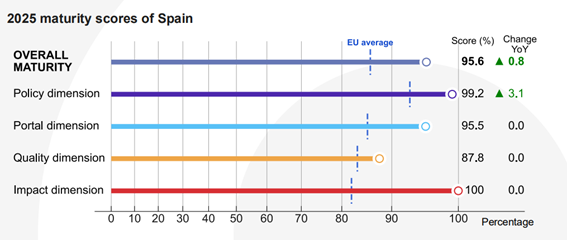
Figure 2. Spain's score in the different dimensions together with growth over the previous year.
As shown in the image, the political dimension has reached a score of 99.2% compared to 96% last year, standing out from the European average of 93.1%. The reason for this growth is the progress in the regulatory framework. In this regard, the report highlights the configuration of the V Open Government Plan, developed through a co-creation process in which all stakeholders participated. This plan has introduced new initiatives related to the governance and reuse of open data. Another noteworthy issue is that Spain promoted the publication of high-value datasets, in line with Implementing Regulation (EU) 2023/138.
The rest of the dimensions remain stable, all of them with scores above the European average: in the portal dimension, 95.5% has been obtained compared to 85.45% in Europe, while the quality dimension has been valued with 87.8% compared to 83.4% in the rest of the countries analysed. The Impact block continues to be our great asset, with 100% compared to 82.1% in Europe. In this dimension, we continue to position ourselves as great leaders, thanks to a clear definition of reuse, the systematic measurement of data use and the existence of examples of impact in the governmental, social, environmental and economic spheres.
Although there have not been major movements in the score of these dimensions, the report does highlight milestones in Spain in all areas. For example, the datos.gob.es platform underwent a major redesign, including adjustments to the DCAT-AP-ES metadata profile, in order to improve quality and interoperability. In this regard, a specific implementation guide was published and a learning and development community was consolidated through GitHub. In addition, the portal's search engine and monitoring tools were improved, including tracking external reuse through GitHub references and rich analytics through interactive dashboards.
The involvement of the infomediary sector has been key in strengthening Spain's leadership in open data. The report highlights the importance of activities such as the National Open Data Meeting, with challenges that are worked on jointly by a multidisciplinary team with representatives of public, private and academic institutions, edition after edition. In addition, the Spanish Federation of Municipalities and Provinces identified 80 essential data sets on which local governments should focus when advancing in the opening of information, promoting coherence and reuse at the municipal level.
The following image shows the specific score for each of the subdimensions analyzed:
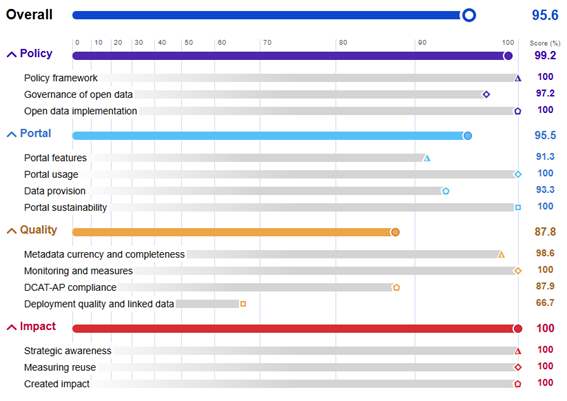
Figure 3. Spain's score in the different dimensions and subcategories.
You can see the details of the report for Spain on the website of the European portal.
Next steps and common challenges
The report concludes with a series of specific recommendations for each group of countries. For the group of trendsetters, in which Spain is located, the recommendations are not so much focused on reaching maturity – already achieved – but on deepening and expanding their role as European benchmarks. Some of the recommendations are:
- Consolidate thematic ecosystems (supplier and reuser communities) and prioritize high-value data in a systematic way.
- Align local action with the national strategy, enabling "data-driven" policies.
- Cooperate with data.europa.eu and other countries to implement and adapt an impact assessment framework with domain-by-domain metrics.
- Develop user profiles and allow their contributions to the national portal.
- Improve data and metadata quality and localization through validation tools, artificial intelligence, and user-centric flows.
- Apply domain-specific standards to harmonize datasets and maximize interoperability, quality, and reusability.
- Offer advanced and certified training in regulations and data literacy.
- Collaborate internationally on reusable solutions, such as shared or open source software.
Spain is already working on many of these points to continue improving its open data offer. The aim is for more and more reusers to be able to easily take advantage of the potential of public information to generate services and solutions that generate a positive impact on society as a whole.
The position achieved by Spain in this European ranking is the result of the work of all public initiatives, companies, user communities and reusers linked to open data, which promote an ecosystem that does not stop growing. Thank you for the effort!
Noticia
The European data portal, data.europa.eu, has published the Open Data Maturity Index 2024, an annual report that assesses the level of open data maturity of European countries.
The 34 participating countries, including the 27 EU Member States, four candidate countries (Bosnia and Herzegovina, Albania, Serbia and Ukraine) and three European Free Trade Association countries (Iceland, Norway and Switzerland) were surveyed.
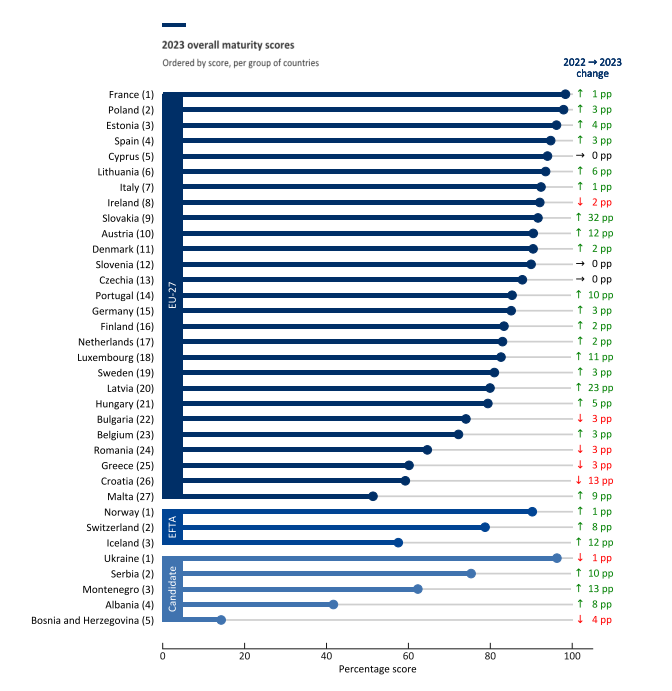
In this year's edition, Spain obtains an overall rating of 95% out of 100%. This places it in sixth place overall. As reflected in the following image, for yet another year, Spain is in the group of so-called trendsetter countries (trendsetter) , which are those with the best scores in the ranking, and which also include France, Poland, Ukraine, Slovakia, Ireland, Lithuania, Czech Republic, Italy, Estonia and Cyprus.

Figure 1: Groups of participating countries according to their overall open data maturity score.
Above the EU27 average in all four dimensions analysed
The Policy Dimension, focusing on open data policies in different countries, analyses the existence of national governance models for open data management and the measures that have been put in place to implement existing strategies. In these aspects, Spain scored 96% compared to the European average of 91%. The most positive aspects identified are:
- Alignment with European policies: The report highlights that Spain is fully aligned with the European Open Data Directive, among other recent data-related regulations that have come into force.
- Well-defined action plans: It highlights the strategies deployed in different public administrations focused on incentivising the publication and re-use of data generated in real time and data from citizens.
- Strengthening competences: It focuses on how Spain has developed training programmes to improve the skills of civil servants in managing and publishing open data, ensuring quality standards and fostering a data culture in public administration.
The Impact Dimension analyses the activities carried out to monitor and measure both the re-use of open data, and the impact created as a result of this re-use. Year after year, this has been the least mature dimension in Europe. Thus, compared to an EU average of 80%, Spain obtains a score of 100% for the development of numerous actions, among which the following stand out:
- Multi-sectoral collaboration: The report highlights how our country is presented as an example of interaction between public administrations, private companies and civil society, materialized in examples such as the close ties between the public sector and the Multisectoral Association of Information (ASEDIE), which produces year after year the ASEDIE report on the reuse of public sector information.
- Examples of re-use in key sectors: It shows how Spain has promoted numerous cases of open data reuse in strategic areas such as the environment, mobility and energy.
- Innovation in communication: The document highlights the effort invested in innovative communication strategies to raise public awareness of the value of data, and especially young audiences. Also noteworthy is the production of podcasts featuring interviews with open data experts, accompanied by short promotional videos.
The Portal Dimension focuses on analysing the functionalities of the national platform to enableusers to access open data and interact within the community. With 96% compared to 82% in the EU27, Spain is positioned as one of the European benchmarks in improving user experience and optimising national portals. The highlights of the report are:
- Sustainability and continuous improvement: According to the report, Spain has demonstrated a strong commitment to the sustainability of the national open data platform (datos.gob.es) and its adaptation to new technological demands.
- Interaction with users: One of the great strengths is the active promotion from the platform of the datasets available and of the channels through which users can request data that are not available in the National Catalogue.
Finally, the Quality Dimension examines the mechanisms for ensuring the quality of (meta)data. Here Spain scores 88% compared to 79% in the EU. Spain continues to stand out with initiatives that ensure the reliability, accessibility and standardisation of open data. Some of the strengths highlighted in the report are:
- Metadata automation: It highlights the use of advanced techniques for automatic metadata collection, reducing reliance on manual processes and improving accuracy and real-time updating.
- Guidelines for data and metadata quality: Spain provides many practical guidelines to improve the publication and quality of open data, including anonymisation techniques, publication in tabular formats (CSV) and the use of APIs.
Continuing to innovate to maintain Spain's advanced position in open data maturity
While Spain continues to stand out in the EU thanks to its open data ecosystem, efforts must continue. To this end, the same report identifies lines of work for countries, such as Spain, that seek to maintain their advanced position in open data maturity and to continue innovating. Among others, the following recommendations are made:
- Consolidating open data ecosystems: Strengthen thematic communities of providers and re-users by prioritising High Value Datasets (HVDs) in their development and promotion.
- Promoting coordination: Align the national strategy with the needs of agencies and local authorities.
- Develop country-specific impact metrics: Collaborate with universities, research institutions and others to develop impact assessment frameworks.
- Measure and disseminate the impact of open data: Conduct regular (annual or biannual) assessments of the economic, environmental and social impact of open data, promoting the results to generate political support.
- Facilitate the participation of the open data community: Ensure that providers improve the publication of data based on user feedback and ratings.
- Increase the quality of data and metadata: Use automated tools and validations to improve publication standards, including adopting artificial intelligence technology to optimise metadata quality.
- Promote successful reuse cases: Publish and promote success stories in the use of open data, interact with providers and users to identify innovative needs and applications.
Overall, the report shows good progress on open data across Europe. Although there are areas for improvement, the European open data landscape is consolidating, with Spain at the top of the table. Read here the complete Open Data Maturity Index 2024.
Blog
Open data should be inherently accessible, meaning it must be available for free and without barriers that could restrict access and reuse. Accessibility is a fundamental and complex issue because it means that these data sets should not only be available in reusable formats but also that anyone should be able to access and interpret them.
To ensure that access to open data is democratic, it must meet fundamental accessibility criteria that affect both the platform (web) and the way its content is displayed (e.g., through visualizations). In this context, this post delves into the essential principles to ensure that open data is inclusive and useful for a diverse audience. Discover recommendations aimed at improving the accessibility of open data portals and platforms, as well as best practices for data visualization, with a focus on the importance of inclusive design that considers the needs of all users.
Levels of Web Accessibility
When focusing on the platform, open data portals can refer to the web accessibility specifications identified by the World Wide Web Consortium (W3C), the leading international organization for web standardization, which sets guidelines for web accessibility that a website should meet.
-
Perceivable: Information and user interface components must be presented to users in ways they can perceive, regardless of any physical or cognitive disabilities they might have.
-
Operable: User interface components and navigation must be operable. Therefore, users who use the keyboard instead of the mouse must be able to interact correctly with a webpage; no time limit should be imposed on users to complete interactions, and there should be ways to navigate and find content easily.
-
Understandable: Text must be clear and easy to understand, the user interface and navigation must be consistent and predictable, and webpages must help users when they make mistakes filling out a form, for example.
- Robust: Content must be robust enough to be reliably interpreted by a variety of web browsers and other software, such as screen readers.
Each guideline has compliance criteria that can be tested. These criteria are classified into three levels: A, AA, AAA. The levels, from least to most, are:
- A (Minimum): All non-text content like images and videos must have textual alternatives; videos and audios must have subtitles; navigation should be possible using only the keyboard; the page must have a clear title and assigned language.
- AA (Acceptable): In addition to all level A requirements, other functionalities are added, such as live videos also having subtitles; the contrast ratio between text and background must be at least 4.5:1; text must be resizable up to 200% without losing content or functionality; text images should not be used.
- AAA (Optimal): This level requires all the features of levels A and AA, along with other requirements such as sign language interpretation for videos or a contrast ratio between text and background of at least 7:1.
Accessible Open Data Websites and Visualizations
Considering the conditions and recommendations set by W3C, the European Open Data Portal offers a Data Visualization Guide that includes best practices for accessibility in data visualization. Following the guidelines of this Guide, to respect inclusivity from the design stage, a good data visualization must meet three conditions: it must be perceivable, understandable, and adaptable.
-
Perceivable: Colors must be adapted for people with vision problems, and the font size and contrast must be adequate.
-
Understandable: The interface must be user-friendly and intuitive. Whenever possible, the graphic should be understandable regardless of the user's background.
- Adaptable: The visualization must be responsive, meaning it adapts to the dimensions of each electronic device, flexible, editable, or with viewing options for people with cognitive disabilities.
Once these three conditions are identified, we can analyze if our graphic meets them by paying attention to issues such as the use of an appropriate color palette for people with vision problems, good contrast, and understandable titles and text. It is also advisable to include alternative text (adapted for people with intellectual disabilities) and, when necessary, a visualization guide to understand the graphic.
Tools to Improve Accessibility
To apply accessibility principles in data visualization, we can use three resources:
-
Accessibility Audit Tools: Conducting accessibility audits is a good practice, for example, using Chartability which analyzes websites considering all aspects related to inclusion.
-
HTML: The fundamental web markup language was developed with accessibility in mind, so using its elements semantically correctly is a simple way to ensure a basic level of accessibility. This applies to the context of a visualization (which should use elements like headers and paragraphs correctly, for example), interactive elements (like links, buttons, and inputs), and the elements of a visualization itself. It is better to offer a visualization in HTML than in image format (jpg or png) whenever possible. When not possible, it is necessary to provide an accessible alternative (an alternative text, as mentioned earlier).
- SVG: Scalable Vector Graphics (SVG) is a format for two-dimensional vector graphics, both static and animated, in Extensible Markup Language (XML) format, meaning it is composed of code and its specification is an open standard developed by W3C to generate accessible graphics.
- Datawrapper: Among many data visualization tools, Datawrapper offers the possibility to test accessible color palettes and write alternative descriptions, among other accessibility-related functions.
In summary, data visualization is a method to make a data set and its visualizations more accessible. Taking these accessibility tips into account and incorporating them by default into the design when presenting a data set visually will enrich the result and reach a wider audience.
Content developed based on the Data Visualization Guide from the European Open Data Portal: https://data.europa.eu/apps/data-visualisation-guide/accessibility-of-data-visualisation
Noticia
The Use Case Observatory is an initiative led by data.europa.eu, the European Open Data Portal. This is a research project on the economic, governmental, social and environmental impact of open data. The project will run for three years, from 2022 to 2025, during which the European Data Portal will monitor 30 cases of open data re-use and publish findings in regular deliverables.
In 2022 it made a first report and now, in April 2024, it has presented volume 2 of the exploratory analysis on the use of open data. In this second instalment, he analyses thirteen of the initial use cases that remain under study, three of them Spanish, and draws the following conclusions:
- The paper first of all underlines the high potential of open data re-use.
- It stresses that many organisations and applications owe their very existence to open data.
- It also points to the need to unlock more broadly the potential impact of open data on the economy, society and the environment.
- To achieve the above point, it points to continued support for the reuse community as crucial to identifying opportunities for financial growth.
The three Spanish cases: UniversiDATA-Lab, Tangible Data and Planttes
To select the use cases, the Use Case Observatory conducted an inventory based on three sources: the examples collected in the European portal's annual maturity studies , the solutions participating in the EU Datathon and the reuse examples available in the data.europa.eu use case repository. Only projects developed in Europe were taken into account, trying to maintain a balance between the different countries.
In addition, projects that had won an award or were aligned with the European Commission's priorities for 2019 to 2024 were highlighted. To finalise the selection, data.europa.eu conducted interviews with representatives of eligible use cases interested in participating in the project.
On this second occasion, the new report reviews one project in the economic impact area, three in the governmental area, six in the social area and four in the environmental area.
In both the first volume and this one, he highlights three Spanish cases: UniversiDATA-Lab and Tangible Data in the social field and Planttes in the environmental category.
UniversiDATA-Lab, the union of six universities around open data
In the case of UniversiDATA-Lab it is focused on higher education. It is a public portal for the advanced and automatic analysis of datasets published by the six Spanish universities that are part of the UniversiDATAportal: the Autonomous University of Madrid (UAM), the Carlos III University of Madrid, the Complutense University of Madrid (UCM), the University of Huelva, the University of Valladolid (UVa) and the Juan Carlos I University.
The aim of UniversiDATA-Lab is to transform the static analyses of the portal section into dynamic results. The Observatory's report notes that this project "encourages the use of shared resources" between the different university centres. Another notable impact is the implementation of dynamic web applications that read the UniversiDATA catalogue in real time, retrieve all available data and perform online data analysis.
Regarding the previous report, it praises its "considerable effort to convert intricate data into user-friendly information", and notes that this project provides detailed documentation to help users understand the nature of the data analysed.
Tangible Data, making spatial data understandable
Tangible Data is a project that transforms data from its digital context into a physical context by creating data sculptures in public space. These data sculptures help people who lack certain digital skills to understand them. It uses data from international agencies (e.g. NASA, World Bank) and other similar platforms as data sources.
In this second volume, they highlight its "significant" evolution, as since last year the project has moved from minimum viable product testing to the delivery of integral projects. This has allowed them to "explore commercial and educational opportunities, such as exhibitions, workshops, etc.", as extrapolated from the interviews conducted. In addition, the four key processes (design, creation, delivery and measurement) have been standardised and have made the project globally accessible and rapidly deployable.
Planttes, an environmental initiative that is making its way into the Observatory
The third Spanish example, Planttes, is a citizen science app that informs users about which plants are in flower and whether this can affect people allergic to pollen. It uses open data from the Aerobiology Information Point (PIA-UAB), among others, which it complements with data provided by users to create personalised maps.
Of this project, the Observatory notes that, by harnessing community involvement and technology, "the initiative has made significant progress in understanding and mitigating the impact of pollen allergies with a commitment to furthering awareness and education in the years to come".
Regarding the work developed, he points out that Planttes has evolved from a mobile application to a web application in order to improve accessibility. The aim of this transition is to make it easier for users to use the platform without the limitations of mobile applications.
The Use Case Observatory will deliver its third volume in 2025. Its raison d'être goes beyond analysing and outlining achievements and challenges. As this is an ongoing project over three years, it will allow for the extrapolation of concrete ideas for improving open data impact assessment methodologies.
Blog
The Big Data Test Infrastructure (BDTI) is a tool funded by the European Digital Agenda, which enables public administrations to perform analysis with open data and open source tools in order to drive innovation.
This free-to-use, cloud-based tool was created in 2019 to accelerate digital and social transformation. With this approach and also following the European Open Data Directive, the European Commission concluded that in order to achieve a digital and economic boost, the power of public administrations' data should be harnessed, i.e. its availability, quality and usability should be increased. This is how BDTI was born, with the purpose of encouraging the reuse of this information by providing a free analysis test environment that allows public administrations to prototype solutions in the cloud before implementing them in the production environment of their own facilities.
What tools does BDTI offer?
Big Data Test Infrastructure offers European public administrations a set of standard open source tools for storing, processing and analysing their data. The platform consists of virtual machines, analysis clusters, storage and network facilities. The tools it offers are:
- Databases: to store data and perform queries on the stored data. The BDTI currently includes a relational database(PostgreSQL), a document-oriented database(MongoDB) and a graph database(Virtuoso).
- Data lake: for storing large amounts of structured and unstructured data (MinIO). Unstructured raw data can be processed with deployed configurations of other building blocks (BDTI components) and stored in a more structured format within the data lake solution.
- Development environments: provide the computing capabilities and tools necessary to perform standard data analysis activities on data from external sources, such as data lakes and databases.
- JupyterLab, an interactive, online development environment for creating Jupyter notebooks, code and data.
- Rstudio, an integrated development environment for R, a programming language for statistical computing and graphics.
- KNIME, an open source data integration, reporting and analytics platform with machine learning and data mining components, can be used for the entire data science lifecycle.
- H2O.ai, an open sourcemachine learning ( ML) and artificial intelligence (AI) platform designed to simplify and accelerate the creation, operation and innovation with ML and AI in any environment.
- Advanced processing: clusters and tools can also be created to process large volumes of data and perform real-time search operations(Apache Spark, Elasticsearch and Kibana)
- Display: BDTI also offers data visualisation applications such as Apache Superset, capable of handling petabyte-scale data, or Metabase.
- Orchestration: for the automation of data-driven processes throughout their lifecycle, from preparing data to making data-driven decisions and taking actions based on those decisions, is offered:
- Apache Airflow, an open source workflow management platform that allows complex data pipelines to be easily scheduled and executed.
Through these cloud-based tools, public workers in EU countries can create their own pilot projects to demonstrate the value that data can bring to innovation. Once the project is completed, users have the possibility to download the source code and data to continue the work themselves, using environments of their choice. In addition, civil society, academia and the private sector can participate in these pilot projects, as long as there is a public entity involved in the use case.
Success stories
These resources have enabled the creation of various projects in different EU countries. Some examples of use cases can be found on the BDTI website. For example, Eurostat carried out a pilot project using open data from internet job advertisements to map the situation of European labour markets. Other success stories included the optimisation of public procurement by the Norwegian Agency for Digitisation, data sharing efforts by the European Blood Alliance and work to facilitate understanding of the impact of COVID-19 on the city of Florence .
In Spain, BDTI enabled a data mining project atthe Conselleria de Sanitat de la Comunidad Valenciana. Thanks to BDTI, knowledge could be extracted from the enormous amount of scientific clinical articles, a task that supported clinicians and managers in their clinical practices and daily work.

Courses, newsletter and other resources
In addition to publishing use cases, theBig Data Test Infrastructure website offers an free online course to learn how to get the most out of BDTI. This course focuses on a highly practical use case: analysing the financing of green projects and initiatives in polluted regions of the EU, using open data from data.europa.eu and other open sources.
In addition, a monthly newsletter on the latest BDTI news, best practices and data analytics opportunities for the public sector has recently been launched .
In short, the re-use of public sector data (RISP) is a priority for the European Commission and BDTI(Big Data Test Infrastructure) is one of the tools contributing to its development. If you work in the public administration and you are interested in using BDTI register here.
Documentación
In order to comply with Directive (EU) 2019/1024 and its subsequent implementing regulation, EU member states are working on making available so-called high-value datasets (HVD). The aim is to enable citizens and businesses to access such data under technical requirements that favour its re-use and its positive impact on society, the economy and the environment.
Opening up these datasets is a major challenge for public administrations in all EU countries. Although much of this data is already available tousers, countries need to identify it in order to be able to report on it and resolve the high heterogeneity in formats, structures and semantics. In particular, from February 2025, Member States will have to report to the Commission every two years on available high-value datasets, including links to licence conditions and APIs.
To assist in this task, the European Data Portal has published the report "Report on Data Homogenisation for High-value Datasets" where it proposes a methodological approach to facilitate the identification and homogenisation of HVD. Among other issues, the report provides examples of standards that help to achieve greater interoperability not only between data, but also between the applications that use them.
A method for identification and homogenisation
The report describes a methodological approach based on three steps:
- The identification of HVDs in existing data portals. Although there are some guidelines for HVD publication, like these for applying DCAT-AP, the naming of already published datasets is not uniform, which makes it difficult to find them. The report proposes a protocol that consists of defining keywords, based on the datasets and their associated attributes, contained in Annex I of the Implementing Regulation. The idea is to use these keywords to search the various existing data portals. The report explains how the identification protocol has been tested with datasets from the categories of business registers, statistical data and transport network data, including tables with the keywords used.
- Localisation or development of data models, ontologies, controlled vocabularies and/or common APIs. In this section, the report describes some useful resources, which are summarised in the following table:
| Resource | DESCRIPTION | Category of data in which they can help the most, according to the report |
|---|---|---|
| Inspire Directive | Characteristics that spatial information and its metadata must have. |
|
|
Inspire Directive data specifications (data specifications) |
Models, schemes and coding rules for different spatial data thematic areas.
|
|
| Inspire network services (network services) | A set of common interfaces for web services that enable the discovery, visualisation, downloading and transformation of spatial data. |
|
|
Technical guidelines for Inspire metadata (Inspire technical guidelines for metadata) |
Technical guidelines for metadata, with the minimum elements to be included as defined in Commission Regulation 1205/2008 . |
|
| Geo-DCATAP | Extension of the DCAT application profile to describe geospatial datasets. |
|
| Core Location Vocabulary | A simplified data model that includes the fundamental characteristics of a location, represented as an address or geographic name, or through geometry. |
|
| General Multilingual Environmental Thesaurus (GEMET). | Controlled vocabulary specialised in environmental information. It has a section on concepts linked to the spatial data categories included in Inspire. |
|
| Semantic Sensor Network | W3C recommendation for describing sensors and their observations. |
|
| Quantity, unit, dimension and type (QUDT). | A set of ontologies defining basic classes, properties and constraints used to model physical quantities, units of measurement and their dimensions in various measurement systems. |
|
| List of Eurostat statistical classifications | Statistical classifications maintained by Eurostat, available as Linked Open Data in XKOS, the SKOS extension for modelling statistical classifications. They are presented by classification family, categorised by statistical domain and sub-domains (e.g. NACE for economic activity, which we will describe below). |
|
| Eurostat standard code lists | Predefined and organised sets of elements presenting statistical concepts using unique codes |
|
| Statistical Data and Metadata eXchange (SDMX) | Global initiative to standardise and harmonise the exchange of statistical data and metadata. It provides technical standards (the SDMX information model), guidelines, an IT architecture, tools and a series of tutorials to assist users. |
|
| RDF Data Cube Vocabulary | Ontology for describing multidimensional data, such as statistics, which is based on the core of the SDMX 2.0 information model. |
|
| Core Business Vocabulary | Referred to by the regulation itself, it consists of a simplified data model that captures the fundamental characteristics of a legal entity, such as its legal name, activity or address. |
|
| NACE Code | Codes for the classification of economic activities in the European Union. Its NACE 2 revision was published by the European Commission in October 2022 |
|
| Organisation ontology | W3C ontology to support the publication of linked data relating to organisational information, i.e. it provides a number of ways to represent the relationship between people and organisations, together with the internal information structure of an organisation. |
|
| Global Legal Entity Identifier Foundation | Centralised database with information on legal entities participating in global financial markets. It assigns each entity a unique Legal Entity Identifier (LEI) code that is recognised worldwide. |
|
| NST Taxonomy | Classification system for goods transported by road, rail, inland waterways and sea. It takes into account the economic activity associated with the origin of the goods. |
|
| Table of authorities of "Transport service" | List of codes for different types of transport services provided by the EU Vocabularies section. |
|
Source: Report on Data Homogenisation for High-value Datasets
The report also mentions some models to be used in the field of smart cities, such as Smart Data Models and the Spanish Open Cities.
- The application of such models. The last step is the actual harmonisation of the data. Once the models to be used have been selected, it is time to apply them. In this phase, the necessary conversion processes will be carried out to provide the data in the appropriate formats and with unified quality metadata. The way in which these transformations are applied will vary depending on the intended end result. For example, it may consist of transforming tabular data (comma-separated values or CSVs, Excel, relational databases, etc.) into other data sources that are also tabular but follow the structure provided in common data models. You can also go further and transform them into tree-based representations (such as JSON) or RDF according to the ontologies and controlled vocabularies you select.
Conclusions of the report
The report ends with a series of conclusions and recommendations. There are still challenges around the identification of HVDs and the implementation of the Implementing Regulation in all European countries, especially in raising awareness and disseminating information about their importance. In HVD categories where there are large data harmonisation initiatives, such as Inspire on geospatial data or Eurostat on statistical HVD, we can find a larger amount of data available in an interoperable and harmonised way. In contrast, in categories where there is no majority initiative, such as companies and company ownership, there is still some way to go to implement the regulation.
The recommendations set out in the European Data Portal report help to shape a roadmap for publishing high-value datasets in each of the categories defined by the European Commission. A challenge that administrations will have to address during 2024 and that will facilitate the re-use of public information.
Noticia
The European Data Portal, data.europa.eu, has just published its Data Maturity Index, an index that assesses the level of maturity of European countries in terms of open data. For its elaboration, an evaluation survey has been carried out and has been completed by 35 countries, including the 27 Member States of the European Union, three countries of the European Free Trade Association (Iceland, Norway and Switzerland) and five candidate countries (Bosnia and Herzegovina, Montenegro, Albania, Serbia and Serbia and Ukraine).
In this year's edition, Spain obtained a score of 95% out of 100%. This places it in fifth place overall and in fourth place if only European Union (EU27) member countries are taken into account. This figure represents an improvement of three percentage points over last year's score and places Spain 12 points above the EU27 average (83%).
The top positions in the ranking are occupied by France, Poland, Ukraine and Estonia.
Above the EU27 average in all dimensions analyzed
The index is accompanied by a report containing the analysis carried out and an overview of the good practices applied in Europe. In the case of Spain, it is above the EU-27 average in the four indicators analyzed:
-
Policy, focused on the open data policies of the different countries. It analyzes the existence of national governance models for open data management and the measures that have been applied to implement existing strategies. This is the indicator in which Spain obtains a higher score, with 99% compared to 89% in the EU27. The report highlights how the country's national open data strategy helps promote the openness of public information through innovative and structured actions in collaboration with public and private partners. Among other issues, the strategy includes the objective of identifying business models and business success stories to share successful practices. The report also highlights the existence of various digital strategies that complement specific policies on open data, such as the national artificial intelligence strategy, which includes provisions related to the availability of open data for the operation and training of artificial intelligence systems.
-
Impact, which analyzes the activities undertaken to monitor and measure both the reuse of open data and the impact created by such reuse. Traditionally, this has been the least mature dimension across Europe. Nevertheless, Spain scores 96% compared to 77% in the EU27. The best results are achieved in measuring the impact of open data use cases in the environmental, economic and political sectors.
-
Portal, focused on evaluating the functionalities of the national platform that allow users to access open data and help drive interaction within the community. With 96% compared to 85% in the EU27, Spain stands out in the use of analytical tools to understand user behavior, and in the implementation of strategies to ensure the sustainability of the portal and increase its visibility, including presence in social networks. It also highlights the existence of a private area that allows editors to act according to the feedback received.
-
Quality, which examines the mechanisms for ensuring the quality of (meta)data. Here Spain scores 88% compared to 82% in the EU27. Spain's score is driven by compliance with the DCAT-AP standard (providing educational materials for publishers), the existence of a systematic approach to ensure that metadata is up to date, and the wide range of data offered, both historical and current.

The report also measures how EU27 countries are progressing in the implementation of the implementing regulation on high-value datasets. In this section, Spain ranks ninth, with 68% implementation. In general, Member States are making more progress on geospatial and statistical datasets. Progress is also being made on the underlying technical and legal requirements.
Overall recommendations
The report includes a number of recommendations for Spain, among other countries, including encouraging the development of initiatives at the local and regional level, fostering better coordination between teams, and activating the network of open data officers to implement monitoring activities within their organizations. Emphasis is also placed on the need to promote existing open data courses and promote new training materials, paying special attention to developing strategic awareness of the reuse and impact of open data.
Overall, the report shows good progress in open data across Europe. Although there are areas for improvement, the European open data landscape is consolidating, with Spain at the top of the table.
In 2024, new waves of implementation of the European data strategy will present national teams with new challenges. On the one hand, they will have to redouble their efforts to inform citizens of the new data sources arising from initiatives such as the Data Governance Act and the data spaces. In this sense, coordination will be necessary between the new figures arising from these legislative developments and the traditional world of open data, enhancing the obvious synergies between the two to boost the data economy and collectivize the value generated.
Blog
Open data is a highly valuable source of knowledge for our society. Thanks to it, applications can be created that contribute to social development and solutions that help shape Europe's digital future and achieve the Sustainable Development Goals (SDGs).
The European Open Data portal (data.europe.eu) organizes online events to showcase projects that have been carried out using open data sources and have helped address some of the challenges our society faces: from combating climate change and boosting the economy to strengthening European democracy and digital transformation.
In the current year, 2023, four seminars have been held to analyze the positive impact of open data on each of the mentioned themes. All the material presented at these events is published on the European data portal, and recordings are available on their YouTube channel, accessible to any interested user.
In this post, we take a first look at the showcased use cases related to boosting the economy and democracy, as well as the open data sets used for their development.
Solutions Driving the European Economy and Lifestyle
In a rapidly evolving world where economic challenges and aspirations for a prosperous lifestyle converge, the European Union has demonstrated an unparalleled ability to forge innovative solutions that not only drive its own economy but also elevate the standard of living for its citizens. In this context, open data has played a pivotal role in the development of applications that address current challenges and lay the groundwork for a prosperous and promising future. Two of these projects were presented in the second webinar of the series "Stories of Use Cases”, an event focused on "Open Data to Foster the European Economy and Lifestyle": UNA Women and YouthPOP.
The first project focuses on tackling one of the most relevant challenges we must overcome to achieve a just society: gender inequality. Closing the gender gap is a complex social and economic issue. According to estimates from the World Economic Forum, it will take 132 years to achieve full gender parity in Europe. The UNA Women application aims to reduce that figure by providing guidance to young women so they can make better decisions regarding their education and early career steps. In this use case, the company ITER IDEA has used over 6 million lines of processed data from various sources, such as data.europa.eu, Eurostat, Censis, Istat (Italy's National Institute of Statistics), and NUMBEO.
The second presented use case also targets the young population. This is the YouthPOP application (Youth Public Open Procurement), a tool that encourages young people to participate in public procurement processes. For the development of this app, data from data.europa.eu, Eurostat, and ESCO, among others, have been used. YouthPOP aims to improve youth employment and contribute to the proper functioning of democracy in Europe.
Open Data for Boosting and Strengthening European Democracy
In this regard, the use of open data also contributes to strengthening and consolidating European democracy. Open data plays a crucial role in our democracies through the following avenues:
- Providing citizens with reliable information.
- Promoting transparency in governments and public institutions.
- Combating misinformation and fake news.
The theme of the third webinar organized by data.europe.eu on use cases is "Open Data and a New Impetus for European Democracy". This event presented two innovative solutions: EU Integrity Watch and the EU Institute for Freedom of Information.
Firstly, EU Integrity Watch is a platform that provides online tools for citizens, journalists, and civil society to monitor the integrity of decisions made by politicians in the European Union. This website offers visualizations to understand the information and provides access to collected and analyzed data. The analyzed data is used in scientific disclosures, journalistic investigations, and other areas, contributing to a more open and transparent government. This tool processes and offers data from the Transparency Register.
The second initiative presented in the democracy-focused webinar with open data is the EU Institute for Freedom of Information (IDFI), a Georgian non-governmental organization that focuses on monitoring and supervising government actions, revealing infractions, and keeping citizens informed.
The main activities of the IDFI include requesting public information from relevant bodies, creating rankings of public bodies, monitoring the websites of these bodies, and advocating for improved access to public information, legislative standards, and related practices. This project obtains, analyzes, and presents open data sets from national public institutions.
In conclusion, open data makes it possible to develop applications that reduce the gender wage gap, boost youth employment, or monitor government actions. These are just a few examples of the value that open data can offer to society.

Learn more about these applications in their seminars -> Recordings here.
Blog
Over the past year, the academic section of data.europa.eu expanded its open data training offer by publishing new conferences, courses and workshops. Thus, data.europa.academy shared a total of 15 webinars related to open data, data spaces and other topics and technical issues around the data economy.
In line with the online training philosophy of this area of expertise, professionals and users interested in open data were able to attend the conferences from anywhere in the EU by filling in a web-based registration form.
Among the webinars of the recently concluded 2022 were workshops and seminars on open data quality and metadata, the legal and technical perspective of open data openness, the potential of open data in real time or the opportunities it offers to citizens when developing solutions and services.
In this way, the range of content is very broad in terms of subject matter and level of technical accessibility, which makes it easy to filter the webinars according to interests. In addition, as many of the training sessions are based on reports previously published by the European data portal, they have very useful supporting documentation to complete the knowledge acquired.
In order to bring together this valuable source of knowledge in an orderly fashion, below you can access the 15 lectures published over the past year, as well as their respective supporting presentations.
Data quality and metadata
- Description: This webinar focuses on explaining why high quality data and metadata are the basis for beneficial production outcomes and for fostering informed decision making.
- Viewing link: https://www.youtube.com/watch?v=PcyJX8xbyik
Best practices of open data: the case of Estonia, Slovenia and Ukraine
- Description: Through this conference, the European portal tries to explain the importance and impact that the reuse of open data can have. To do so, they use the presentation of good practices and use cases of several European portals based on this type of data.
- Link to viewing: https://www.youtube.com/watch?v=mTVayKTUC-s
Real-time data
- Description: This course explains what real-time data is and which standards and technologies are most commonly used with this type of data.
- Link to viewer: https://www.youtube.com/watch?v=yl4ZotQQfuk
Demand and reuse of data in the public sector
- Description: This webinar provides an introduction to the re-use of data by public institutions, while focusing on the importance of meeting and measuring the demand for data by this specific user group.
- Viewing link: https://www.youtube.com/watch?v=uTd7Ti0aQNA&t=752s
Opportunities and challenges of citizen-generated data.
- Description: This seminar explores how citizen-generated data is currently available in open data portals of different levels of public administrations in Europe.
- Link to viewing: https://www.youtube.com/watch?v=4FHaerYTFmc&t=1801s
The role of data.europa.eu in the context of EU data spaces
- Description: This webinar enables data providers to understand how they can make better use of different infrastructures and thus provide more visibility to open data assets by assessing the role of data.europa.eu in contexts of common European data spaces.
- Link to view: https://www.youtube.com/watch?v=DjhGkGMoKso
Eurostat's regional yearbook goes digital
- Description: This is a conference dedicated to the evolution of Eurostat's regional yearbook from a printed publication to a digital publication that functions as a modern interactive tool.
- Viewing link: https://www.youtube.com/watch?v=q0mgg4IbXUY
Data.europa.eu - The official European data portal (webinar for data providers)
- Description: This webinar provides an overview of data.europa.eu, a portal that acts as a gateway to public sector information on different open data portals of EU institutions, agencies and bodies and national and international organisations around the world. The training provides an overview of the services provided through the portal.
- Link to view: https://www.youtube.com/watch?v=4s9Yol8GsSc
Measuring the impact of open data in Europe.
- Description: The aim of this conference is to provide an overview of the methods to assess the impact of open data. After a short introduction, guest speakers from the national open data teams of Poland and France presented real examples of how they measure the impact of open data in these countries.
- Link to viewing: https://www.youtube.com/watch?v=Cp7-qSNLR1U
Data visualisation
- Description: To highlight the potential behind data visualisations, through this webinar, and additional training materials, users can learn how to get the most out of open data catalogues through different ways of visualising them.
- Viewing link: https://www.youtube.com/watch?v=XY91H9TcO1A
- Supporting documents: https://data.europa.eu/en/academy/data-visualisation
Use Case Observatory Stories - Volume I
- Description: This webinar is part of a series of three sessions dedicated to the research project "Use Case Observatory" and its publications. In the first part of this training, an overview of the project, its methodology and the findings of the publication in 2022 are given. During the second part of the webinar, four of the managers of the thirty reuse cases participating in the research take the floor to present their open data solutions.
- Viewing link: https://www.youtube.com/watch?v=-FT0OxfgF0M
Trends in Geospatial Data
- Description: This seminar focuses on emerging trends in the geospatial community and how these along with standards and new ideas can be relevant to data.europa.eu.
- Link to view: https://www.youtube.com/watch?v=Hyt1MNm9l00
Federation of geospatial data on data.europa.eu
- Description: This training aims to present the geospatial data that can be found on data.europa.eu, as well as to explain the process of federating this type of data. The speakers took a close look at a geospatial dataset on data.europa.eu and explored the journey of its metadata from the source geo-catalogue to the portal.
- Link to viewing: https://www.youtube.com/watch?v=7UPneA4QOoo
Understanding open data from the perspective of legal openness (webinar for data providers)
- Description: This webinar aims to explain and discuss what openness means from a legal perspective and how it can best be achieved. The aim is not to provide purely theoretical legal training, but to identify best practices and resources that data providers can use to achieve openness and to realise when openness cannot be achieved.
- Link to viewing: https://www.youtube.com/watch?v=53QdDf4LJN0&t=1s
Understanding the technical openness of open data (webinar for data providers)
- Description: The aim of this training is to guide data providers through the principle of technical openness and the data management process of moving from closed to open data formats. An open format is one in which the programme specifications are freely available to anyone, free of charge and without limitations on re-use imposed by intellectual property rights.
- Viewing link: https://www.youtube.com/watch?v=cQMwMXd4n9I&t=17s
For the new year that is already underway, data.europa.eu aims to continue to expand the training resources of its academic section with the programming of seminars such as Data and Competition Law or another linked to the recent publication of the Open Data Maturity 2022 report.
For more information on future seminars, follow the link below to the European open data portal and stay tuned for news on this topic from datos.gob.es.