Blog
Cities, infrastructures and the environment today generate a constant flow of data from sensors, transport networks, weather stations and Internet of Things (IoT) platforms, understood as networks of physical devices (digital traffic lights, air quality sensors, etc.) capable of measuring and transmitting information through digital systems. This growing volume of information makes it possible to improve the provision of public services, anticipate emergencies, plan the territory and respond to challenges associated with climate, mobility or resource management.
The increase in connected sources has transformed the nature of geospatial data. In contrast to traditional sets – updated periodically and oriented towards reference cartography or administrative inventories – dynamic data incorporate the temporal dimension as a structural component. An observation of air quality, a level of traffic occupancy or a hydrological measurement not only describes a phenomenon, but also places it at a specific time. The combination of space and time makes these observations fundamental elements for operating systems, predictive models and analyses based on time series.
In the field of open data, this type of information poses both opportunities and specific requirements. Opportunities include the possibility of building reusable digital services, facilitating near-real-time monitoring of urban and environmental phenomena, and fostering a reuse ecosystem based on continuous flows of interoperable data. The availability of up-to-date data also increases the capacity for evaluation and auditing of public policies, by allowing decisions to be contrasted with recent observations.
However, the opening of geospatial data in real time requires solving problems derived from technological heterogeneity. Sensor networks use different protocols, data models, and formats; the sources generate high volumes of observations with high frequency; and the absence of common semantic structures makes it difficult to cross-reference data between domains such as mobility, environment, energy or hydrology. In order for this data to be published and reused consistently, an interoperability framework is needed that standardizes the description of observed phenomena, the structure of time series, and access interfaces.
The open standards of the Open Geospatial Consortium (OGC) provide that framework. They define how to represent observations, dynamic entities, multitemporal coverages or sensor systems; establish APIs based on web principles that facilitate the consultation of open data; and allow different platforms to exchange information without the need for specific integrations. Its adoption reduces technological fragmentation, improves coherence between sources and favours the creation of public services based on up-to-date data.
Interoperability: The basic requirement for opening dynamic data
Public administrations today manage data generated by sensors of different types, heterogeneous platforms, different suppliers and systems that evolve independently. The publication of geospatial data in real time requires interoperability that allows information from multiple sources to be integrated, processed and reused. This diversity causes inconsistencies in formats, structures, vocabularies and protocols, which makes it difficult to open the data and reuse it by third parties. Let's see which aspects of interoperability are affected:
- Technical interoperability: refers to the ability of systems to exchange data using compatible interfaces, formats and models. In real-time data, this exchange requires mechanisms that allow for fast queries, frequent updates, and stable data structures. Without these elements, each flow would rely on ad hoc integrations, increasing complexity and reducing reusability.
- The Semantic interoperability: Dynamic data describe phenomena that change over short periods – traffic levels, weather parameters, flows, atmospheric emissions – and must be interpreted consistently. This implies having observation models, Vocabularies and common definitions that allow different applications to understand the meaning of each measurement and its units, capture conditions or constraints. Without this semantic layer, the opening of data in real time generates ambiguity and limits its integration with data from other domains.
- Structural interoperability: Real-time data streams tend to be continuous and voluminous, making it necessary to represent them as time series or sets of observations with consistent attributes. The absence of standardized structures complicates the publication of complete data, fragments information and prevents efficient queries. To provide open access to these data, it is necessary to adopt models that adequately represent the relationship between observed phenomenon, time of observation, associated geometry and measurement conditions.
- Interoperability in access via API: it is an essential condition for open data. APIs must be stable, documented, and based on public specifications that allow for reproducible queries. In the case of dynamic data, this layer guarantees that the flows can be consumed by external applications, analysis platforms, mapping tools or monitoring systems that operate in contexts other than the one that generates the data. Without interoperable APIs, real-time data is limited to internal uses.
Together, these levels of interoperability determine whether dynamic geospatial data can be published as open data without creating technical barriers.
OGC Standards for Publishing Real-Time Geospatial Data
The publication of georeferenced data in real time requires mechanisms that allow any user – administration, company, citizens or research community – to access them easily, with open formats and through stable interfaces. The Open Geospatial Consortium (OGC) develops a set of standards that enable exactly this: to describe, organize and expose spatial data in an interoperable and accessible way, which contributes to the openness of dynamic data.
What is OGC and why are its standards relevant?
The OGC is an international organization that defines common rules so that different systems can understand, exchange and use geospatial data without depending on specific technologies. These rules are published as open standards, which means that any person or institution can use them. In the realm of real-time data, these standards make it possible to:
- Represent what a sensor measures (e.g., temperature or traffic).
- Indicate where and when the observation was made.
- Structure time series.
- Expose data through open APIs.
- Connect IoT devices and networks with public platforms.
Together, this ecosystem of standards allows geospatial data – including data generated in real time – to be published and reused following a consistent framework. Each standard covers a specific part of the data cycle: from the definition of observations and sensors, to the way data is exposed using open APIs or web services. This modular organization makes it easier for administrations and organizations to select the components they need, avoiding technological dependencies and ensuring that data can be integrated between different platforms.
The OGC API family: Modern APIs for accessing open data
Within OGC, the newest line is family OGC API, a set of modern web interfaces designed to facilitate access to geospatial data using URLs and formats such as JSON or GeoJSON, common in the open data ecosystem.
Estas API permiten:
- Get only the part of the data that matters.
- Perform spatial searches ("give me only what's in this area").
- Access up-to-date data without the need for specialized software.
- Easily integrate them into web or mobile applications.
In this report: "How to use OGC APIs to boost geospatial data interoperability", we already told you about some of the most popular OGP APIs. While the report focuses on how to use OGC APIs for practical interoperability, this post expands the focus by explaining the underlying OGC data models—such as O&M, SensorML, or Moving Features—that underpin that interoperability.
On this basis, this post focuses on the standards that make this fluid exchange of information possible, especially in open data and real-time contexts. The most important standards in the context of real-time open data are:
|
OGC Standard |
What it allows you to do |
Primary use in open data |
|---|---|---|
|
OGC API – Features |
Query features with geometry; filter by time or space; get data in JSON/GeoJSON. |
Open publication of dynamic mobility data, urban inventories, static sensors. |
|
OGC API – Environmental Data Retrieval (EDR) |
Request environmental observations at a point, zone or time interval. |
Open data on meteorology, climate, air quality or hydrology. |
|
OGC SensorThings API |
Manage sensors and their time series; transmit large volumes of IoT data. |
Publication of urban sensors (air, noise, water, energy) in real time. |
|
OGC API – Connected Systems |
Describe networks of sensors, devices and associated infrastructures. |
Document the structure of municipal IoT systems as open data. |
|
OGC Moving Features |
Represent moving objects using space-time trajectories. |
Open mobility data (vehicles, transport, boats). |
|
WMS-T |
View maps that change over time. |
Publication of multi-temporal weather or environmental maps. |
Table 1. OGC Standards Relevant to Real-Time Geospatial Data
Models that structure observations and dynamic data
In addition to APIs, OGC defines several conceptual data models that allow you to consistently describe observations, sensors, and phenomena that change over time:
- O&M (Observations & Measurements): A model that defines the essential elements of an observation—measured phenomenon, instant, unity, and result—and serves as the semantic basis for sensor and time series data.
- SensorML: Language that describes the technical and operational characteristics of a sensor, including its location, calibration, and observation process.
- Moving Features: A model that allows mobile objects to be represented by means of space-time trajectories (such as vehicles, boats or fauna).
These models make it easy for different data sources to be interpreted uniformly and combined in analytics and applications.
The value of these standards for open data
Using OGC standards makes it easier to open dynamic data because:
- It provides common models that reduce heterogeneity between sources.
- It facilitates integration between domains (mobility, climate, hydrology).
- Avoid dependencies on proprietary technology.
- It allows the data to be reused in analytics, applications, or public services.
- Improves transparency by documenting sensors, methods, and frequencies.
- It ensures that data can be consumed directly by common tools.
Together, they form a conceptual and technical infrastructure that allows real-time geospatial data to be published as open data, without the need to develop system-specific solutions.
Real-time open geospatial data use cases
Real-time georeferenced data is already published as open data in different sectoral areas. These examples show how different administrations and bodies apply open standards and APIs to make dynamic data related to mobility, environment, hydrology and meteorology available to the public.
Below are several domains where Public Administrations already publish dynamic geospatial data using OGC standards.
Mobility and transport
Mobility systems generate data continuously: availability of shared vehicles, positions in near real-time, sensors for crossing in cycle lanes, traffic gauging or traffic light intersection status. These observations rely on distributed sensors and require data models capable of representing rapid variations in space and time.
OGC standards play a central role in this area. In particular, the OGC SensorThings API allows you to structure and publish observations from urban sensors using a uniform model – including devices, measurements, time series and relationships between them – accessible through an open API. This makes it easier for different operators and municipalities to publish mobility data in an interoperable way, reducing fragmentation between platforms.
The use of OGC standards in mobility not only guarantees technical compatibility, but also makes it possible for this data to be reused together with environmental, cartographic or climate information, generating multi-thematic analyses for urban planning, sustainability or operational transport management.
Example:
The open service of Toronto Bike Share, which publishes in SensorThings API format the status of its bike stations and vehicle availability.
Here each station is a sensor and each observation indicates the number of bicycles available at a specific time. This approach allows analysts, developers or researchers to integrate this data directly into urban mobility models, demand prediction systems or citizen dashboards without the need for specific adaptations.
Air quality, noise and urban sensors
Networks for monitoring air quality, noise or urban environmental conditions depend on automatic sensors that record measurements every few minutes. In order for this data to be integrated into analytics systems and published as open data, consistent models and APIs need to be available.
In this context, services based on OGC standards make it possible to publish data from fixed stations or distributed sensors in an interoperable way. Although many administrations use traditional interfaces such as OGC WMS to serve this data, the underlying structure is usually supported by observation models derived from the Observations & Measurements (O&M) family, which defines how to represent a measured phenomenon, its unit and the moment of observation.
Example:
The service Defra UK-AIR Sensor Observation Service provides access to near-real-time air quality measurement data from on-site stations in the UK.
The combination of O&M for data structure and open APIs for publication makes it easier for these urban sensors to be part of broader ecosystems that integrate mobility, meteorology or energy, enabling advanced urban analyses or environmental dashboards in near real-time.
Water cycle, hydrology and risk management
Hydrological systems generate crucial data for risk management: river levels and flows, rainfall, soil moisture or information from hydrometeorological stations. Interoperability is especially important in this domain, as this data is combined with hydraulic models, weather forecasting, and flood zone mapping.
To facilitate open access to time series and hydrological observations, several agencies use OGC API – Environmental Data Retrieval (EDR), an API designed to retrieve environmental data using simple queries at points, areas, or time intervals.
Example:
The USGS (United States Geological Survey), which documents the use of OGC API – EDR to access precipitation, temperature, or hydrological variable series.
This case shows how EDR allows you to request specific observations by location or date, returning only the values needed for analysis. While the USGS's specific hydrology data is served through its proprietary API, this case demonstrates how EDR fits into the hydrometeorological data structure and how it is applied in real operational flows.
The use of OGC standards in this area allows dynamic hydrological data to be integrated with flood zones, orthoimages or climate models, creating a solid basis for early warning systems, hydraulic planning and risk assessment.
Weather observation and forecasting
Meteorology is one of the domains with the highest production of dynamic data: automatic stations, radars, numerical prediction models, satellite observations and high-frequency atmospheric products. To publish this information as open data, the OGC API family is becoming a key element, especially through OGC API – EDR, which allows observations or predictions to be retrieved in specific locations and at different time levels.
Example:
The service NOAA OGC API – EDR, which provides access to weather data and atmospheric variables from the National Weather Service (United States).
This API allows data to be consulted at points, areas or trajectories, facilitating the integration of meteorological observations into external applications, models or services based on open data.
The use of OGC API in meteorology allows data from sensors, models, and satellites to be consumed through a unified interface, making it easy to reuse for forecasting, atmospheric analysis, decision support systems, and climate applications.
Best Practices for Publishing Open Geospatial Data in Real-Time
The publication of dynamic geospatial data requires adopting practices that ensure its accessibility, interoperability, and sustainability. Unlike static data, real-time streams have additional requirements related to the quality of observations, API stability, and documentation of the update process. Here are some best practices for governments and organizations that manage this type of data.
- Stable open formats and APIs: The use of OGC standards – such as OGC API, SensorThings API or EDR – makes it easy for data to be consumed from multiple tools without the need for specific adaptations. APIs must be stable over time, offer well-defined versions, and avoid dependencies on proprietary technologies. For raster data or dynamic models, OGC services such as WMS, WMTS, or WCS are still suitable for visualization and programmatic access.
- DCAT-AP and OGC Models Compliant Metadata: Catalog interoperability requires describing datasets using profiles such as DCAT-AP, supplemented by O&M-based geospatial and observational metadata or SensorML. This metadata should document the nature of the sensor, the unit of measurement, the sampling rate, and possible limitations of the data.
- Quality, update frequency and traceability policies: dynamic datasets must explicitly indicate their update frequency, the origin of the observations, the validation mechanisms applied and the conditions under which they were generated. Traceability is essential for third parties to correctly interpret data, reproduce analyses and integrate observations from different sources.
- Documentation, usage limits, and service sustainability: Documentation should include usage examples, query parameters, response structure, and recommendations for managing data volume. It is important to set reasonable query limits to ensure the stability of the service and ensure that management can maintain the API over the long term.
- Licensing aspects for dynamic data: The license must be explicit and compatible with reuse, such as CC BY 4.0 or CC0. This allows dynamic data to be integrated into third-party services, mobile applications, predictive models or services of public interest without unnecessary restrictions. Consistency in the license also facilitates the cross-referencing of data from different sources.
These practices allow dynamic data to be published in a way that is reliable, accessible, and useful to the entire reuse community.
Dynamic geospatial data has become a structural piece for understanding urban, environmental and climatic phenomena. Its publication through open standards allows this information to be integrated into public services, technical analyses and reusable applications without the need for additional development. The convergence of observation models, OGC APIs, and best practices in metadata and licensing provides a stable framework for administrations and reusers to work with sensor data reliably. Consolidating this approach will allow progress towards a more coherent, connected public data ecosystem that is prepared for increasingly demanding uses in mobility, energy, risk management and territorial planning.
Content created by Mayte Toscano, Senior Consultant in Technologies related to the data economy. The content and views expressed in this publication are the sole responsibility of the author.
Documentación
Este informe, que publica el Portal de Datos Europeo, analiza el potencial de reutilización de los datos en tiempo real. Los datos en tiempo real ofrecen información con alta frecuencia de actualización sobre el entorno que nos rodea (por ejemplo, información sobre el tráfico, datos meteorológicos, mediciones de la contaminación ambiental, información sobre riesgos naturales, etc.).
El documento resume los resultados y conclusiones de un seminario web organizado por el equipo del Portal de Datos Europeo celebrado el pasado 5 de abril de 2022, donde se explicaron diferentes formas de compartir datos en tiempo real desde plataformas de datos abiertos.
En primer lugar, el informe hace un repaso sobre el fundamento de los datos en tiempo real e incluye ejemplos que justifican el valor que aporta este tipo de datos para, a continuación, describir dos enfoques tecnológicos sobre cómo compartir datos en tiempo real del ámbito de IoT y el transporte. Incluye, además, un bloque que resume las principales conclusiones de las preguntas y comentarios de los participantes que giran, principalmente, en torno a difentes necesidades de fuentes de datos y funcionalidades requeridas para su reutilización.
Para terminar, basándose en el feedback y la discusión generada, se proporciona un conjunto de recomendaciones y acciones a corto y medio plazo sobre cómo mejorar la capacidad para localizar fuentes de datos en tiempo real a través del Portal de Datos Europeo.
Este informe se encuentra disponible en el siguiente enlace: "Datos en tiempo real: Enfoques para integrar fuentes de datos en tiempo real en data.europa.eu"
Noticia
The European Directive 2019/1024 on open data and re-use of public sector information emphasises, among many other aspects, the importance of publishing data in real time. In fact, the document talks about dynamic data, which it defines as "documents in digital format, subject to frequent or real-time updates due to their volatility or rapid obsolescence". According to the Directive, public bodies must make this data available for re-use by citizens immediately after collection, through appropriate APIs and, where possible, as a bulk download.
To explore this further, the European Data Portal, Data.europa.eu, has published the report “Real-time data 2022: Approaches to integrating real-time data sources in data.europa.eu” which analyses the potential of real-time data. It draws on the results of a webinar held by data.europa.eu on 5 April 2022, a recording of which is available on its website.
In addition to detailing the conclusions of the event, the report provides a brief summary of the information and technologies presented at the event, which are useful for real-time data sharing.
The importance of real-time data
The report begins by explaining what real-time data are: data that are frequently updated and delivered immediately after collection, as mentioned above. These data can be of a very heterogeneous nature. The following table gives some examples:
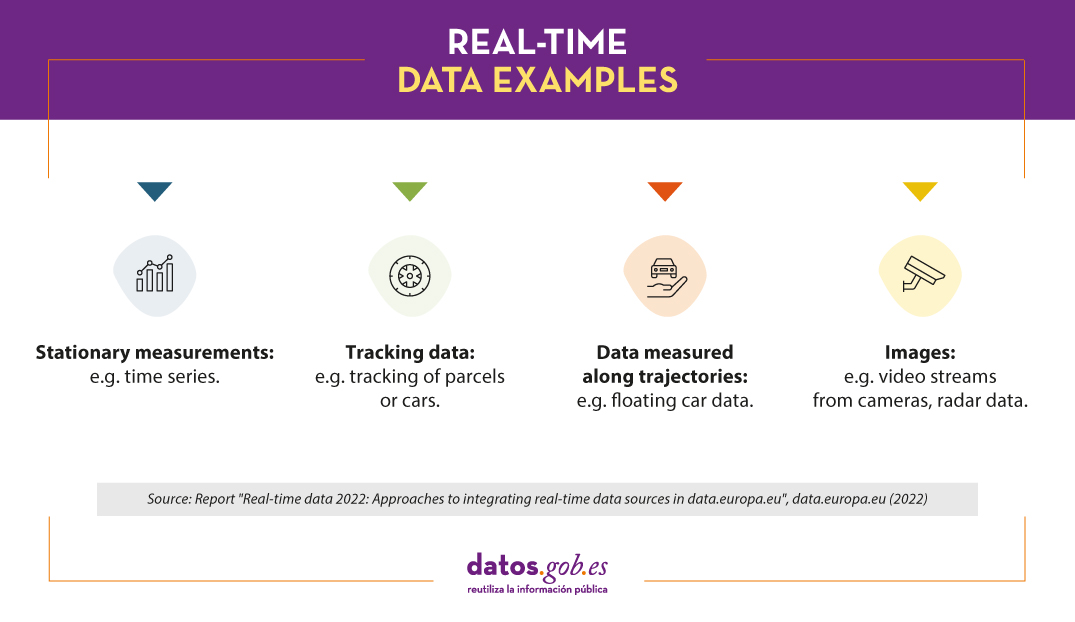
This type of data is widely used to shape applications that report traffic, energy prices, weather forecasts or flows of people in certain spaces. You can find out more about the value of real-time data in this other article.
Real-time data sharing standards
La interoperabilidad es uno de los factores más importantes a tener en cuenta a la hora de seleccionar la tecnología más adecuada para el intercambio de datos en tiempo real. Se precisa un lenguaje común, es decir, formatos de datos comunes e interfaces de acceso a datos que permitan el flujo de datos en tiempo real. Dos estándares que ya son muy utilizados en el ámbito del Internet de las cosas (IoT en sus siglas en inglés) y que pueden ayudar en este sentido son:
SensorThings API (STA)
SensorThings API, from the Open Geospatial Consortium, emerged in 2016 and has been considered a best practice for data sharing in compliance with the INSPIRE Directive.
This standard provides an open and unified framework for encoding and providing access to sensor-generated data streams. It is based on REST and JSON specifications and follows the principles of the OData (OASIS Open Data Protocol) standard.
STA provides common functionalities for creating, reading, updating and deleting sensor resources. It enables the formulation of complex queries tailored to the underlying data model, allowing more direct access to the specific data the user needs. Query options include filtering by time period, observed parameters or resource properties to reduce the volume of data downloaded. It also allows sorting the content of a result by user-specified criteria and provides direct integration with the MQTT standard, which is explained below.
Message Queuing Telemetry Transport (MQTT)
MQTT was invented by Dr. Andy Stanford-Clark of IBM and Arlen Nipper of Arcom (now Eurotech) in 1999. Like STA, it is also an OASIS standard.
The MQTT protocol allows the exchange of messages according to the publish/subscribe principle. The central element of MQTT is the use of brokers, which take incoming messages from publishers and distribute them to all users who have a subscription for that type of data. In this type of environment, data is organised by topics, which are freely defined and allow messages to be grouped into thematic channels to which users subscribe.
The advantages of this system include reduced latency, simplicity and agility, which facilitates its implementation and use in constrained environments (e.g. with limited bandwidth or connectivity).
In the case of the European portal, users can already find real-time datasets based on MQTT. However, there is not yet a common approach to providing metadata on brokers and the topics they offer, and work is still ongoing.
Other conclusions of the report
As mentioned at the beginning, the webinar on 5 April also served to gather participants' views on the use of real-time data, current challenges in data availability and needs for future improvements. These views are also reflected in this report.
Among the most valued categories of real-time data, users highlighted traffic information and weather data. Data on air pollution, allergens, flood monitoring and stock market information were also mentioned. In this respect, more and more detailed data were requested, especially in the field of mobility and energy in order to be able to compare commodity prices. Users also highlighted some drawbacks in locating real-time data on the European portal, including the heterogeneity of the information, which requires the use of common standards and formats across countries.
Finally, the report provides a set of recommendations on how to improve the ability to locate real-time data sources through data.europa.eu. To this end, a series of short and medium-term actions have been established, including the collection of use cases, support for data providers and the development of best practices to unify metadata.
You can read the full report here.
Blog
Life happens in real time and much of our life, today, takes place in the digital world. Data, our data, is the representation of how we live hybrid experiences between the physical and the virtual. If we want to know what is happening around us, we must analyze the data in real time. In this post, we explain how.
Introduction
Let's imagine the following situation: we enter our favorite online store, we search for a product we want and we get a message on the screen saying that the price of the product shown is from a week ago and we have no information about the current price of the product. Someone in charge of the data processes of that online store could say that this is the expected behavior since the price database uploads from the central system to the e-commerce are weekly. Fortunately, this online experience is unthinkable today in an e-commerce, but far from what you might think, it is a common situation in many other processes of companies and organizations. It has happened to all of us that being registered in a database of a business, when we go to a store different from our usual one, opps, it turns out that we are not listed as customers. Again, this is because the data processing (in this case the customer database) is centralized and the loads to peripheral systems (after-sales service, distributors, commercial channel) are done in batch mode. This, in practice, means that data updates can take days or even weeks.
In the example above, batch mode thinking about data can unknowingly ruin the experience of a customer or user. Batch thinking can have serious consequences such as: the loss of a customer, the worsening of the brand image or the loss of the best employees.
Benefits of using real-time data
There are situations in which data is simply either real-time or it is not. A very recognizable example is the case of transactions, banking or otherwise. We cannot imagine that payment in a store does not occur in real time (although sometimes the payment terminals are out of coverage and this causes annoying situations in physical stores). Nor can (or should) it happens that when passing through a toll booth on a highway, the barrier does not open in time (although we have probably all experienced some bizarre situation in this context).
However, in many processes and situations it can be a matter of debate and discussion whether to implement a real-time data strategy or simply follow conventional approaches, trying to have a time lag in (data) analysis and response times as low as possible. Below, we list some of the most important benefits of implementing real-time data strategies:
- Immediate reaction to an error. Errors happen and with data it is no different. If we have a real-time monitoring and alerting system, we will react before it is too late to an error.
- Drastic improvement in the quality of service. As we have mentioned, not having the right information at the time it is needed can ruin the experience of our service and with it the loss of customers or potential customers. If our service fails, we must know about it immediately to be able to fix it and solve it. This is what makes the difference between organizations that have adapted to digital transformation and those that have not.
- Increasing sales. Not having the data in real time, can make you lose a lot of money and profitability. Let's imagine the following example, which we will see in more detail in the practical section. If we have a business in which the service we provide depends on a limited capacity (a chain of restaurants, hotels or a parking lot, for example) it is in our interest to have our occupancy data in real time, since this means that we can sell our available service capacity more dynamically.
The technological part of real time
For years, data analysis was originally conceived in batch mode. Historical data loads, every so often, in processes that are executed only under certain conditions. The reason is that there is a certain technological complexity behind the possibility of capturing and consuming data at the very moment it is generated. Traditional data warehouses, (relational) databases, for example, have certain limitations for working with fast transactions and for executing operations on data in real time. There is a huge amount of documentation on this subject and on how technological solutions have been incorporating technology to overcome these barriers. It is not the purpose of this post to go into the technical details of the technologies to achieve the goal of capturing and analyzing data in real time. However, we will comment that there are two clear paradigms for building real-time solutions that need not be mutually exclusive.
- Solutions based on classic mechanisms and flows of data capture, storage (persistence) and exposure to specific consumption channels (such as a web page or an API).
- Solutions based on event-driven availability mechanisms, in which data is generated and published regardless of who and how it will be consumed.
A practical example
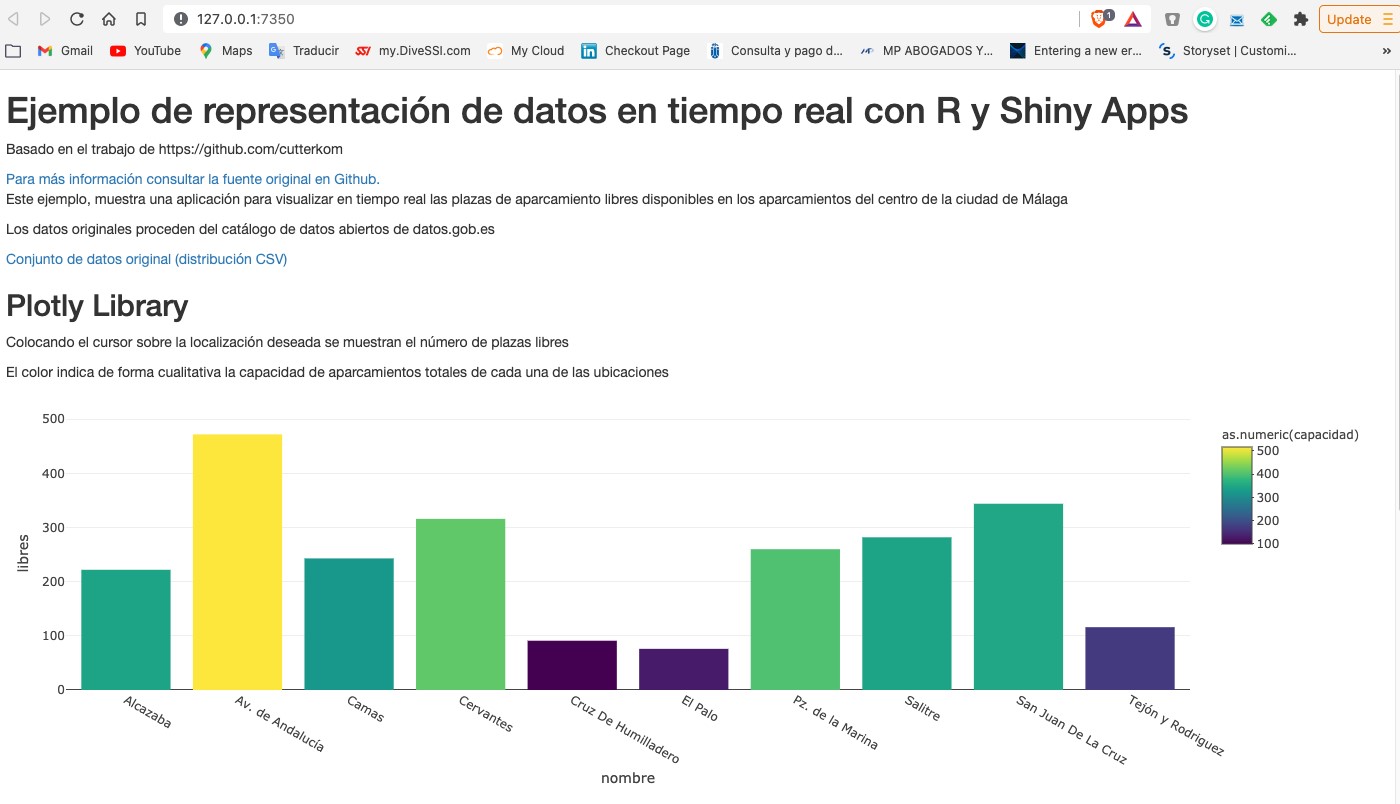
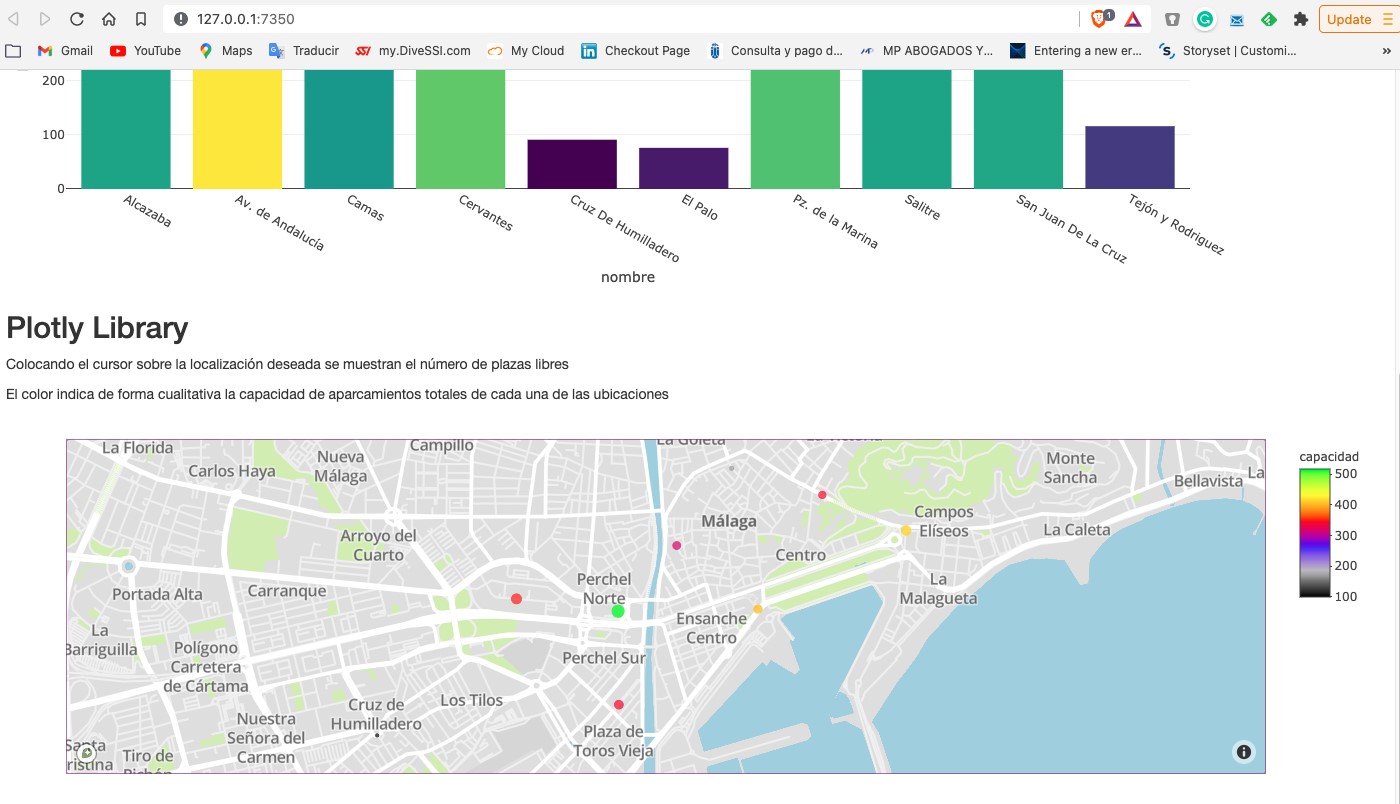
As we usually do in this type of posts, we try to illustrate the topic of the post with a practical example with which the reader can interact. In this case, we are going to use an open dataset from the datos.gob.es catalog. In particular, we are going to use a dataset containing information on the occupancy of public parking spaces in the city center of Malaga. The dataset is available at this link and can be explored in depth through this link. The data is accessible through this API. In the description of the dataset it is indicated that the update frequency is every 2 minutes. As mentioned above, this is a good example in which having the data available in real time[1] has important advantages for both the service provider and the users of the service. Not many years ago it was difficult to think of having this information in real time and we were satisfied with aggregated information at the end of the week or month on the evolution of the occupancy of parking spaces.
From the data set we have built an interactive app where the user can observe in real time the occupancy level through graphic displays. The reader has at his disposal the code of the example to reproduce it at any time.
In this example, we have seen how, from the moment the occupancy sensors communicate their status (free or occupied) until we consume the data in a web application, this same data has gone through several systems and even had to be converted to a text file to expose it to the public. A much more efficient system would be to publish the data in an event broker that can be subscribed to with real-time technologies. In any case, through this API we are able to capture this data in real time and represent it in a web application ready for consumption and all this with less than 150 lines of code. Would you like to try it?
In conclusion, the importance of real-time data is now fundamental to most processes, not just space management or online commerce. As the volume of real-time data increases, we need to shift our thinking from a batch perspective to a real-time first mindset. That is, let's think directly that data must be available for real-time consumption from the moment it is generated, trying to minimize the number of operations we do with it before we can consume it.
[1] The term real time can be ambiguous in certain cases. In the context of this post, we can consider real time to be the characteristic data update time that is relevant to the particular domain we are working in. For example, in this use case an update rate of 2 min is sufficient and can be considered real time. If we were analysing a use case of stock quotes the concept of real time would be in the order of seconds.
Content prepared by Alejandro Alija, expert in Digital Transformation and Innovation.
The contents and views expressed in this publication are the sole responsibility of the author.
Blog
The democratisation of technology in all areas is an unstoppable trend. With the spread of smartphones and Internet access, an increasing number of people can access high-tech products and services without having to resort to advanced knowledge or specialists. The world of data is no stranger to this transformation and in this post we tell you why.
Introduction
Nowadays, you don't need to be an expert in video editing and post-production to have your own YouTube channel and generate high quality content. In the same way that you don't need to be a super specialist to have a smart and connected home. This is due to the fact that technology creators are paying more and more attention to providing simple tools with a careful user experience for the average consumer. It is a similar story with data. Given the importance of data in today's society, both for private and professional use, in recent years we have seen the democratisation of tools for simple data analysis, without the need for advanced programming skills.
In this sense, spreadsheets have always lived among us and we have become so accustomed to their use that we use them for almost anything, from a shopping list to a family budget. Spreadsheets are so popular that they are even considered as a sporting event. However, despite their great versatility, they are not the most visual tools from the point of view of communicating information. Moreover, spreadsheets are not suitable for a type of data that is becoming more and more important nowadays: real-time data.
The natively digital world increasingly generates real-time data. Some reports suggest that by 2025, a quarter of the world's data will be real-time data. That is, it will be data with a much shorter lifecycle, during which it will be generated, analysed in real time and disappear as it will not make sense to store it for later use. One of the biggest contributors to real-time data will be the growth of Internet of Things (IoT) technologies.
Just as with spreadsheets or self-service business intelligence tools, data technology developers are now focusing on democratising data tools designed for real-time data. Let's take a concrete example of such a tool.
Low-code programming tools
Low-code programming tools are those that allow us to build programs without the need for specific programming knowledge. Normally, low-code tools use a graphical programming system, using blocks or boxes, in which the user can build a program, choosing and dragging the boxes he/she needs to build his/her program. Contrary to what it might seem, low-code programming tools are not new and have been with us for many years in specialised fields such as engineering or process design. In this post, we are going to focus on a specific one, especially designed for data and in particular, real-time data.
Node-RED
Node-RED is an open-source tool under the umbrella of the OpenJS foundation which is part of the Linux Foundation projects. Node-RED defines itself as a low-code tool specially designed for event-driven applications. Event-driven applications are computer programs whose basic functionality receives and generates data in the form of events. For example, an application that generates a notification in an instant messaging service from an alarm triggered by a sensor is an event-driven application. Both the input data - the sensor alarm - and the output data - the messaging notification - are events or real-time data.
This type of programming was invented by Paul Morrison in the 1970s. It works by having a series of boxes or nodes, each of which has a specific functionality (receiving data from a sensor or generating a notification). The nodes are connected to each other (graphically, without having to program anything) to build what is known as a flow, which is the equivalent of a programme or a specific part of a programme. Once the flow is built, the application is in charge of maintaining a constant flow of data from its input to its output. Let's look at a concrete example to understand it better.
Analysis of real-time noise data in the city of Valencia
The best way to demonstrate the power of Node-RED is by making a simple prototype (a program in less than 5 minutes) that allows us to access and visualise the data from the noise meters installed in a specific neighbourhood in the city of Valencia. To do this, the first thing we are going to do is to locate a set of open data from the datos.gob.es catalogue. In this case we have chosen this set, which provides the data through an API and whose particularity is that it is updated in real time with the data obtained directly from the noise pollution network installed in Valencia. We now choose the distribution that provides us with the data in XML format and execute the call.
The result returned by the browser looks like this (the result is truncated - what the API returns has been cut off - due to the long length of the response):
<response>
<resources name="response">
<resource>
<str name="LAeq">065.6</str>
<str name="name">Sensor de ruido del barrio de ruzafa. Cadiz 3</str>
<str name="dateObserved">2021-06-05T08:18:07Z</str>
<date name="modified">2021-06-05T08:19:08.579Z</date>
<str name="uri">http://apigobiernoabiertortod.valencia.es/rest/datasets/estado_sonometros_cb/t248655.xml</str>
</resource>
<resource>
<str name="LAeq">058.9</str>
<str name="name">Sensor de ruido del barrio de ruzafa. Sueca Esq. Denia</str>
<str name="dateObserved">2021-06-05T08:18:04Z</str>
<date name="modified">2021-06-05T08:19:08.579Z</date>
<str name="uri">http://apigobiernoabiertortod.valencia.es/rest/datasets/estado_sonometros_cb/t248652.xml</str>
</resource>
Where the parameter LAeq is the measure of noise level[1]
To get this same result returned by the API in a real-time program with Node-RED, we just have to start Node-RED in our browser (to install Node-RED on your computer you can follow the instructions here).
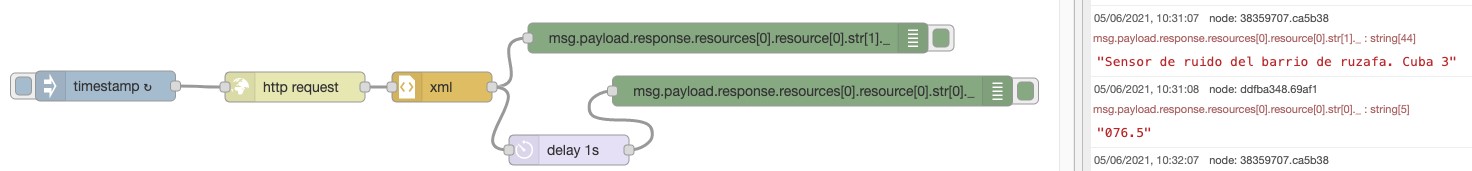
With only 6 nodes (included by default in the basic installation of Node-RED) we can build this flow or program that requests the data from the sensor installed in "Noise sensor in the Ruzafa neighbourhood. Cádiz 3" and return the noise value that is automatically updated every minute. You can see a demonstration video here.
Node-Red has many more possibilities, it is possible to combine several flows to make much more complex programmes or to build very visual dashboards like this one for final applications.
In short, in this article we have shown you how you don't need to know how to program or use complex software to make your own applications accessing open data in real time. You can get much more information on how to start using Node-RED here. You can also try other tools similar to Node-RED such as Apache Nify or ThingsBoard. We're sure the possibilities you can think of are endless - get creative!
[1] Equivalent continuous sound level. It is defined in ISO 1996-2:2017 as the value of the pressure level in dBA in A-weighting of a stable sound which in a time interval T has the same root mean square sound pressure as the sound being measured and whose level varies with time. In this case the period set for this sensor is 1 minute.
Content elaborated by Alejandro Alija, expert in Digital Transformation and Innovation.
Contents and points of view expressed in this publication are the exclusive responsibility of its author.