Publication date
21/06/2021
Update date
20/06/2024

Description
The democratisation of technology in all areas is an unstoppable trend. With the spread of smartphones and Internet access, an increasing number of people can access high-tech products and services without having to resort to advanced knowledge or specialists. The world of data is no stranger to this transformation and in this post we tell you why.
Introduction
Nowadays, you don't need to be an expert in video editing and post-production to have your own YouTube channel and generate high quality content. In the same way that you don't need to be a super specialist to have a smart and connected home. This is due to the fact that technology creators are paying more and more attention to providing simple tools with a careful user experience for the average consumer. It is a similar story with data. Given the importance of data in today's society, both for private and professional use, in recent years we have seen the democratisation of tools for simple data analysis, without the need for advanced programming skills.
In this sense, spreadsheets have always lived among us and we have become so accustomed to their use that we use them for almost anything, from a shopping list to a family budget. Spreadsheets are so popular that they are even considered as a sporting event. However, despite their great versatility, they are not the most visual tools from the point of view of communicating information. Moreover, spreadsheets are not suitable for a type of data that is becoming more and more important nowadays: real-time data.
The natively digital world increasingly generates real-time data. Some reports suggest that by 2025, a quarter of the world's data will be real-time data. That is, it will be data with a much shorter lifecycle, during which it will be generated, analysed in real time and disappear as it will not make sense to store it for later use. One of the biggest contributors to real-time data will be the growth of Internet of Things (IoT) technologies.
Just as with spreadsheets or self-service business intelligence tools, data technology developers are now focusing on democratising data tools designed for real-time data. Let's take a concrete example of such a tool.
Low-code programming tools
Low-code programming tools are those that allow us to build programs without the need for specific programming knowledge. Normally, low-code tools use a graphical programming system, using blocks or boxes, in which the user can build a program, choosing and dragging the boxes he/she needs to build his/her program. Contrary to what it might seem, low-code programming tools are not new and have been with us for many years in specialised fields such as engineering or process design. In this post, we are going to focus on a specific one, especially designed for data and in particular, real-time data.
Node-RED
Node-RED is an open-source tool under the umbrella of the OpenJS foundation which is part of the Linux Foundation projects. Node-RED defines itself as a low-code tool specially designed for event-driven applications. Event-driven applications are computer programs whose basic functionality receives and generates data in the form of events. For example, an application that generates a notification in an instant messaging service from an alarm triggered by a sensor is an event-driven application. Both the input data - the sensor alarm - and the output data - the messaging notification - are events or real-time data.
This type of programming was invented by Paul Morrison in the 1970s. It works by having a series of boxes or nodes, each of which has a specific functionality (receiving data from a sensor or generating a notification). The nodes are connected to each other (graphically, without having to program anything) to build what is known as a flow, which is the equivalent of a programme or a specific part of a programme. Once the flow is built, the application is in charge of maintaining a constant flow of data from its input to its output. Let's look at a concrete example to understand it better.
Analysis of real-time noise data in the city of Valencia
The best way to demonstrate the power of Node-RED is by making a simple prototype (a program in less than 5 minutes) that allows us to access and visualise the data from the noise meters installed in a specific neighbourhood in the city of Valencia. To do this, the first thing we are going to do is to locate a set of open data from the datos.gob.es catalogue. In this case we have chosen this set, which provides the data through an API and whose particularity is that it is updated in real time with the data obtained directly from the noise pollution network installed in Valencia. We now choose the distribution that provides us with the data in XML format and execute the call.
The result returned by the browser looks like this (the result is truncated - what the API returns has been cut off - due to the long length of the response):
<response>
<resources name="response">
<resource>
<str name="LAeq">065.6</str>
<str name="name">Sensor de ruido del barrio de ruzafa. Cadiz 3</str>
<str name="dateObserved">2021-06-05T08:18:07Z</str>
<date name="modified">2021-06-05T08:19:08.579Z</date>
<str name="uri">http://apigobiernoabiertortod.valencia.es/rest/datasets/estado_sonometros_cb/t248655.xml</str>
</resource>
<resource>
<str name="LAeq">058.9</str>
<str name="name">Sensor de ruido del barrio de ruzafa. Sueca Esq. Denia</str>
<str name="dateObserved">2021-06-05T08:18:04Z</str>
<date name="modified">2021-06-05T08:19:08.579Z</date>
<str name="uri">http://apigobiernoabiertortod.valencia.es/rest/datasets/estado_sonometros_cb/t248652.xml</str>
</resource>
Where the parameter LAeq is the measure of noise level[1]
To get this same result returned by the API in a real-time program with Node-RED, we just have to start Node-RED in our browser (to install Node-RED on your computer you can follow the instructions here).
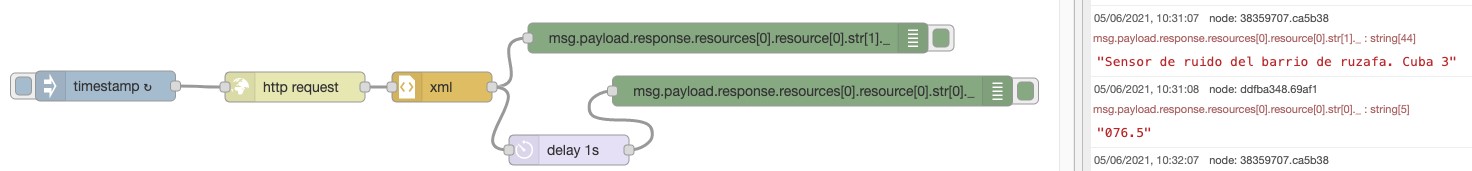
With only 6 nodes (included by default in the basic installation of Node-RED) we can build this flow or program that requests the data from the sensor installed in "Noise sensor in the Ruzafa neighbourhood. Cádiz 3" and return the noise value that is automatically updated every minute. You can see a demonstration video here.
Node-Red has many more possibilities, it is possible to combine several flows to make much more complex programmes or to build very visual dashboards like this one for final applications.
In short, in this article we have shown you how you don't need to know how to program or use complex software to make your own applications accessing open data in real time. You can get much more information on how to start using Node-RED here. You can also try other tools similar to Node-RED such as Apache Nify or ThingsBoard. We're sure the possibilities you can think of are endless - get creative!
[1] Equivalent continuous sound level. It is defined in ISO 1996-2:2017 as the value of the pressure level in dBA in A-weighting of a stable sound which in a time interval T has the same root mean square sound pressure as the sound being measured and whose level varies with time. In this case the period set for this sensor is 1 minute.
Content elaborated by Alejandro Alija, expert in Digital Transformation and Innovation.
Contents and points of view expressed in this publication are the exclusive responsibility of its author.
Comments