Environment
Data and innovation in the environmental sector are instrumental in addressing critical global challenges such as climate change, deforestation, and environmental degradation, which pose existential threats to Europe and beyond.


Discover the most notable datasets
Imagen Media

Seguimiento y actualización de la distribución y abundancia de sábalo (Alosa alosa L.) y lamprea (Petromyzon marinus L.) en el País Vasco - Sistema de Información de la Naturaleza de Euskadi
Descripción
Esta categoría de información se refiere a los datos o la información relacionada con una aparición específica de un taxón (usualmente una especie)
Imagen Media

Datos meteorológicos diarios de Tenerife para la estación GALLETAS
Descripción
Valores meteorológicos diarios de la isla de Tenerife por cada uno de los sensores de la estación indicada
Imagen Media

Contenedores - Arrieta
Descripción
Se muestra la ubicación de los contenedores en este municipio.
Imagen Media

Estaciones meteorológicas de Tenerife
Descripción
Información georreferenciada de las estaciones meteorológicas de la isla de Tenerife
Imagen Media

Metadatos de las estaciones meteorológicas automàticas
Descripción
Taula amb les metadades associades a cadascuna de les estacions de la Xarxa d’Estacions Meteorològiques Automàtiques (XEMA), integrada a la Xarxa d
Imagen Media
Mostrar más…
Descripción
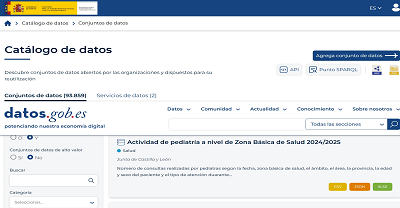
Búsqueda en el catálogo de datos.gob.es por la categoría Medio ambiente
Featured current topics

Current news
10 climate-related public data repositories
Environmental sustainability and the fight against climate change are one of the greatest global challenges of our time. Addressing them requires solid evidence and reliable information to understand risks, track progress, guide decision-making, and assess impacts across sectors. As countries design and implement environmental, mitigation, and adaptation policies, access to climate data becomes an essential element for effective climate action.
In this context, open data plays a strategic role. Facilitating access to open and quality climate data allows public administrations, companies, scientific communities and civil society to plan and monitor sustainable territorial development, improve policy-making, foster collaboration between actors and transform scientific knowledge into concrete actions. Various initiatives are making it possible to make progress in improving the accessibility, interoperability and reuse of climate information, helping to overcome data dispersion and strengthen a coordinated response to climate change. Below, we compile a selection of international reference open data repositories and portals on climate.
Figure 1. Ten public climate-related data repositories.
Climate Data Store
Publisher: European Union Copernicus Programme
The Climate Data Store is the data portal of the Copernicus Climate Change Service (C3S). It offers open access to historical observations, reanalysis, climate indicators, and model-based future projections, with global and regional coverage. It includes variables such as temperatures, precipitation, wind, radiation, ice, and sea level. It provides integrated visualization, processing, and download tools for climate analysis, mitigation and adaptation policy planning.
Climate Change Knowledge Portal (CCKP)
Publisher: World Bank
The World Bank's Climate Change Knowledge Portal provides historical climate data and future projections at global, national, and subnational scales. It includes temperature and precipitation variables, as well as geospatial layers and geocoded data on infrastructure and settlements. The CCKP facilitates climate vulnerability and risk analysis through interactive maps, country profiles, and the downloading of data in standard formats.
IPCC Data Distribution Centre
Publisher: Intergovernmental Panel on Climate Change (IPCC) of the United Nations
The Intergovernmental Panel on Climate Change's Data Clearinghouse provides access to datasets used in IPCC assessment reports, including historical observations, climate projections, socio-economic scenarios, and key indicators. The portal brings together the data used in the Sixth Assessment Report (AR6), published between 2021 and 2023, although it continues to incorporate complementary and updated datasets that support the analysis of impacts, vulnerability and adaptation to climate change.
Climate Change Initiative Open Data Portal
Publisher: European Space Agency (ESA)
Through its Climate Change Initiative (CCI) programme, the European Space Agency offers free and open access to datasets focused on Essential Climate Variables (LCDs), such as sea level, temperature, sea ice or land cover. The data, mainly from satellite observations, is available through downloads, interactive maps and web services, and is a key reference for climate monitoring.
Global Climate Observing System (GCOS)
Publisher: World Meteorological Organization (WMO)
GCOS is an international system that coordinates and promotes climate observation networks to ensure the availability of high-quality data on the atmosphere, oceans and land surface. Developed in collaboration with the United Nations Environment Programme (UNEP), the Intergovernmental Oceanographic Commission of UNESCO (IOC-UNESCO) and the International Council for Science, GCOS facilitates access to climate observations through partner networks and systems.
GRID-Geneva
Publisher: United Nations Environment Programme (UNEP)
UNEP/GRID-Geneva is a centre specializing in the analysis and visualization of environmental and climate data using geographic information systems, remote sensing and statistical analysis. It manages various specialized platforms, such as MapX, an open-source solution for managing and visualizing geospatial data on natural resources, a specific platform for data on climate change, or on early warning for the environment, among others.
UNFCCC Documents
Publisher: United Nations Framework Convention on Climate Change (UNFCCC)
This portal brings together the documentary library of the United Nations Framework Convention on Climate Change. It allows you to search, filter and download multiple documents related to international climate negotiations, including decisions adopted at Conferences of the Parties (COPs), reports of subsidiary bodies, national communications and other texts relevant to the international climate process.
FAOSTAT
Publisher: Food and Agriculture Organization of the United Nations (FAO)
FAOSTAT is the open-access statistical database of the Food and Agriculture Organization of the United Nations (FAO). It contains time series from 1961 to the present with coverage for more than 245 countries. It includes climate and agro-climatic data aimed at analysing the relationship between climate and food systems. Specifically, it offers indicators such as average temperatures, rainfall, evapotranspiration, climatic anomalies and variables related to droughts and water stress.
PREPdata
Publisher: Partnership for Resilience and Preparedness (PREP)
PREPdata is a map-based open data platform that allows visualizing and combining climate, physical and socioeconomic information for vulnerability analysis and climate change adaptation planning. It is possible to create custom dashboards by integrating global data with local information provided by the users themselves. The initiative is led by the World Resources Institute (WRI) and Future Earth, together with public and private partners.
Climate Data Guide
Publisher: National Center for Atmospheric Research (NCAR)
The Climate Data Guide offers expert descriptions, comparisons, and recommendations on climate datasets widely used in research. It organizes resources into seven categories: atmosphere, climate indices, cryosphere, land, ocean, paleoclimate, and reanalysis. This platform stands out for offering guidance and helping users understand what data exists, how it is generated, what limitations it has, and where to access it.
This is a compilation of open data repositories related to climate, but there are others that may be of interest. Which ones would you add to this list? Leave us a comment.
 15/01/2026

Other resources
Practical Exercise on Multiple Linear Regression: Predict Air Quality in Castilla and León
In the field of data science, the ability to build robust predictive models is fundamental. However, a model is not just a set of algorithms; it is a tool that must be understood, validated, and ultimately useful for decision-making.
Thanks to the transparency and accessibility of open data, we have the unique opportunity to work in this exercise with real, updated, and institutional-quality information that reflects environmental issues. This democratization of access not only allows for the development of rigorous analyses with official data but also contributes to informed public debate on environmental policies, creating a direct bridge between scientific research and societal needs.
In this practical exercise, we will dive into the complete lifecycle of a modeling project, using a real case study: the analysis of air quality in Castile and León. Unlike approaches that focus solely on the implementation of algorithms, our methodology focuses on:
Loading and initial data exploration: identifying patterns, anomalies, and underlying relationships that will guide our modeling.
Exploratory analysis for modeling: building visualizations and performing feature engineering to optimize the model.
Development and evaluation of regression models: building and comparing multiple iterative models to understand how complexity affects performance.
Model application and conclusions: using the final model to simulate scenarios and quantify the impact of potential environmental policies.
Access the data laboratory repository on Github
Run the data pre-processing code on Google Colab
Analysis Architecture
The core of this exercise follows a structured flow in four key phases, as illustrated in Figure 1. Each phase builds on the previous one, from initial data exploration to the final application of the model.
Figure 1. Phases of the predictive modeling project.
Development Process
1. Loading and Initial Data Exploration
The first step is to understand the raw material of our analysis: the data. Using an air quality dataset from Castile and León, spanning 24 years of measurements, we face common real-world challenges:
Missing Values: variables such as CO and PM2.5 have limited data coverage.
Anomalous Data: negative and extreme values are detected, likely due to sensor errors.
Through a process of cleaning and transformation, we convert the raw data into a clean and structured dataset, ready for modeling.
2. Exploratory Analysis for Modeling
Once the data is clean, we look for patterns. Visual analysis reveals a strong seasonality in NO₂ levels, with peaks in winter and troughs in summer. This observation is crucial and leads us to create new variables (feature engineering), such as cyclical components for the months, which allow the model to "understand" the circular nature of the seasons.
Figure 2. Seasonal variation of NO₂ levels in Castile and León.
3. Development and Evaluation of Regression Models
With a solid understanding of the data, we proceed to build three linear regression models of increasing complexity:
Base Model: uses only pollutants as predictors.
Seasonal Model: adds time variables.
Complete Model: includes interactions and geographical effects.
Comparing these models allows us to quantify the improvement in predictive capability. The Seasonal Model emerges as the optimal choice, explaining almost 63% of the variability in NO₂, a remarkable result for environmental data.
4. Model Application and Conclusions
Finally, we subject the model to a rigorous diagnosis and use it to simulate the impact of environmental policies. For example, our analysis estimates that a 20% reduction in NO emissions could translate into a 4.8% decrease in NO₂ levels.
Figure 3. Performance of the seasonal model. The predicted values align well with the actual values.
What can you learn?
This practical exercise allows you to learn:
Data project lifecycle: from cleaning to application.
Linear regression techniques: construction, interpretation, and diagnosis.
Handling time-series data: capturing seasonality and trends.
Model validation: techniques like cross-validation and temporal validation.
Communicating results: how to translate findings into actionable insights.
Conclusions and Future
This exercise demonstrates the power of a structured and rigorous approach in data science. We have transformed a complex dataset into a predictive model that is not only accurate but also interpretable and useful.
For those interested in taking this analysis to the next level, the possibilities are numerous:
Incorporation of meteorological data: variables such as temperature and wind could significantly improve accuracy.
More advanced models: exploring techniques such as Generalized Additive Models (GAM) or other machine learning algorithms.
Spatial analysis: investigating how pollution patterns vary between different locations.
In summary, this exercise not only illustrates the application of regression techniques but also underscores the importance of an integrated approach that combines statistical rigor with practical relevance.
22/08/2025