4 documents found
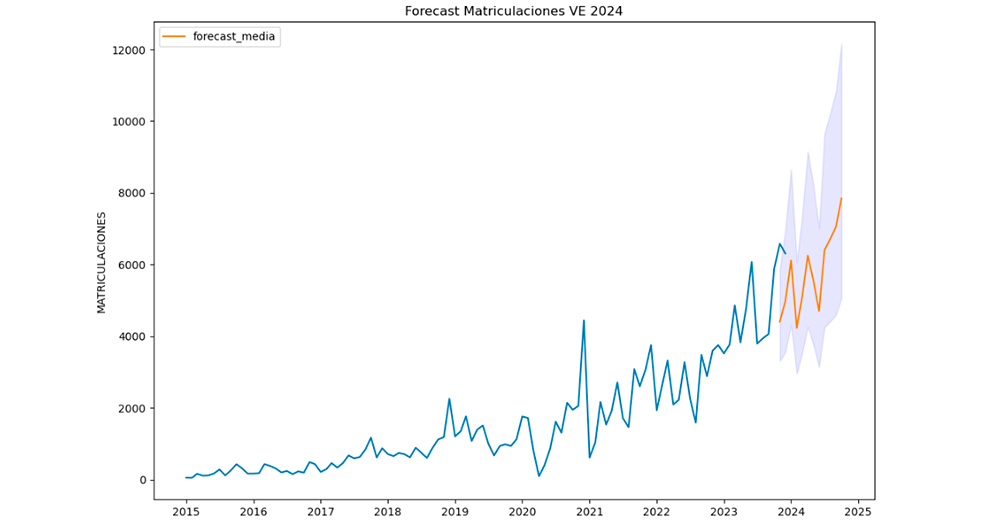
Road to electrification: Deciphering electric vehicle growth in Spain through data analytics
1. Introduction
Visualisations are graphical representations of data that allow to communicate, in a simple and effective way, the information linked to the data. The visualisation possibilities are very wide ranging, from basic representations such as line graphs, bar charts or relevant metrics,…
- Data exercises
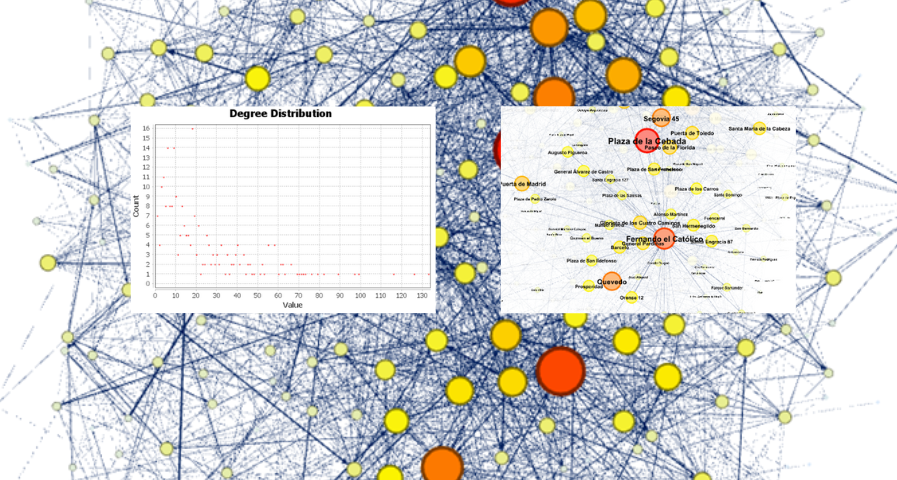
Analysis of travel networks in BICIMAD
1. Introduction
Visualizations are graphical representations of data that allow the information linked to them to be communicated in a simple and effective way. The visualization possibilities are very wide, from basic representations, such as line, bar or sector graphs, to visualizations…
- Data exercises
Analysis of toxicological findings in road traffic accidents
1. Introduction
Visualizations are graphical representations of data that allows comunication in a simple and effective way the information linked to it. The visualization possibilities are very wide, from basic representations, such as a graph of lines, bars or sectors, to visualizations…
- Data exercises

Practical guide for the publication of linked data
It is important to publish open data following a series of guidelines that facilitate its reuse, including the use of common schemas, such as standard formats, ontologies and vocabularies. In this way, datasets published by different organizations will be more homogeneous and users will be able to…
- Guides
