Blog
Open data provides relevant information on the state and evolution of different sectors, including employment. Employment data typically includes labour force statistics and information on employees, as well as economic, demographic or benefits-related data, interviews, salaries, vacancies, etc.
This information can provide a clear picture of a country's economic health and the well-being of its citizens, encouraging informed decision-making. In addition, they can also serve as a basis for the creation of innovative solutions to assist in a variety of tasks.
In this article we will review some sources of open data on job quality, as well as examples of use to show the potential benefits of re-use.
Where to find employment data?
In datos.gob.es a large number of data sets on employment are available, with the National Statistics Institute (INE) standing out as the national publisher. Thanks to the INE data, we can find out who is employed by sector of activity, type of studies or working day, as well as the reasons for having a part-time job. The data provided by this entity also allows us to know the employment situation of people with disabilities or by sex.
Other sources of data where you can find information of interest is the State Public Employment Service (sepe.es), where you can find statistical data on job seekers, jobs and placements, from May 2005 to the present day. To this must be added the regional bodies, many of which have launched their own open employment data portal. This is the case of the Junta de Andalucía.
If we are interested in making a comparison between countries, we can also turn to data from the OECD, Eurostat or the World Bank.
All these data can be of great interest to:
- Policy makers, to better understand and react to labour market dynamics.
- Employers, to optimise their recruitment activities.
- Job seekers, to make better career choices.
- Education and training institutions, to adapt curricula to the needs of the labour market.
Use cases of open data in the employment sector
It is just as important to have sources of open employment data as it is to know how to interpret the information they offer about the sector. This is where reusers come in, taking advantage of this raw material to create data products that can respond to different needs. Let's look at some examples:
- Decision-making and implementation of active policies. Active labour market policies are tools that governments use to intervene directly in the labour market, through training, guidance, incentives to hiring, etc. To do so, they need to be aware of market trends and needs. This has led many public bodies to set up observatories, such as the SEPE or the Principality of Asturias. There are also specific observatories for each area, such as the one for Equality and Employment. At the European level, Eurostat's proposal stands out: to establish requirements to create a pan-European system for the production of official statistics and specific policy analyses using open data on online job vacancies. This project has been carried out using the BDTI platform. But this field is not limited to the public sector; other actors can also submit proposals. This is the case of Iseak, a non-profit organisation that promotes a research and transfer centre in economics. Among other questions, Iseak seeks to answer questions such as: does the increase in the minimum wage lead to job destruction or why is there a gender gap in the market?
- Accountability. All this information is not only useful for public bodies, but also for citizens to assess whether their government's employment policies are working. For this reason, many governments, such as Castilla y León, make this data available to citizens through easy-to-understand visualisations. Data journalism also plays a leading role in this field, with pieces that bring information closer to the general public, such as these examples of salaries or the level of unemployment by area. If you want to know how to make this type of visualisations, we explain them in this step-by-step exercise that characterises the demand for employment and hiring registered in Spain.
- Boosting job opportunities. In order to bring information of interest to citizens who are actively seeking employment or new job opportunities, there are tools, such as this app for public employment calls or grants, based on open data. There are also town councils that create solutions to boost employment and the economy in their locality, such as the APP Paterna Empléate. These apps are a much simpler and more user-friendly way of consuming data than traditional job search portals. Barcelona Provincial Council has gone a step further. This tool uses AI applied to open data to, among other purposes, offer personalised services for individuals, companies and rural sectors, as well as access to job offers. The information it offers comes from notice boards, as well as from the Profile of the contracting party and various municipal websites.
- Development of advanced solutions. Employment data can also be used to power a wide variety of machine learning use cases. One example is this US platform for financial analytics that provides data and information to investors and companies. It uses US unemployment rate data, combined with other data such as postcodes, demographics or weather data.
In short, thanks to this type of data we can not only learn more about the employment situation in our environment, but also feed solutions that help boost the economy or facilitate access to job opportunities. It is therefore a category of data whose publication should be promoted by public bodies at all levels.
Noticia
The Asociación Multisectorial de la Información (ASEDIE) has published the eleventh edition of its Report on the Infomediary Sector, in which it reviews the health of companies that generate applications, products and/or services based on information from the public sector, taking into account that it is the holder of the most valuable data.
Many of the datasets that enable the infomediary sector to develop solutions are included in the lists of High Value Datasets (HVDS) recently published by the European Union. An initiative that recognises the potential of public information and adds to the aim of boosting the data economy in line with the European Parliament's proposed Data Law.
ASEDIE brings together companies from different sectors that promote the data economy, which are mainly nourished by the data provided by the public sector. Among its objectives is to promote the sector and contribute to raising society's awareness of its benefits and impact. It is estimated that the data economy will generate €270 billion of additional GDP for EU Member States by 2028.
The presentation of this edition of the report, entitled 'The Data Economy in the infomediary field', took place on 22 March in Red.es's Enredadera room. In this year's edition of the report, 710 active companies have been identified, with a turnover of more than 2,278 million euros. It should be noted that the first report in 2013 counted 444 companies. Therefore, the sector has grown by 60% in a decade.
Main conclusions of the report
- The infomediary sector has grown by 12.1%, a figure above the national GDP growth of 7.6%. These data are drawn from the analysis of the 472 companies (66% of the sample) that submitted their accounts for the previous years.
- The number of employees is 22,663. Workers are highly concentrated in a few companies: 62% of them have less than 10 workers. The subsector with the highest number of professionals is Geographic information, with 30% of the total. Together with the sub-sectors Financial economics, Technical consultancy and Market research, they account for 75% of the employees.
- Employment in the companies of the Infomediary Sector grew by 1.7%, compared to a fall of 1.1% in the previous year. All sub-sectors have grown, except for Tourism and Culture, which have remained the same, and Technical Consultancy and Market Research, which have decreased.
- The average turnover per employee exceeded 100,000 euros, an increase of 6.6% compared to the previous year. On the other hand, the average expenditure per employee was 45,000 euros.
- The aggregate turnover was 2,279,613,288 euros. The Geographical Information and Economic and Financial subsectors account for 46% of sales.
- The aggregate subscribed capital is 250,115,989 euros. The three most capitalised subsectors are Market Research, Economic and Financial and Geographic Information, which account for 66% of capitalisation.
- The net result exceeds 180 million euros, 70 million more than last year. The Economic and Financial subsector accounted for 66% of total profits.
- The sub-sectors of Geographical Information, Market Research, Financial Economics and Computer Infomediaries account for 76% of the infomediary companies, with a total of 540 companies out of the 710 active companies.
- The Community of Madrid is home to the largest number of companies in the sector, with 39%, followed by Catalonia (13%), Andalusia (11%) and the Community of Valencia (9%).
As the report shows, the arrival of new companies is driving the development of a sector that already has a turnover of around 2,300 million euros per year, and which is growing at a higher rate than other macroeconomic indicators in the country. These data show not only that the Infomediary Sector is in good health, but also its resilience and growth potential.
Progress of the Study on the impact of open data in Spain
The report also includes the results of a survey of the different actors that make up the data ecosystem, in collaboration with the Faculty of Information Sciences of the Complutense University of Madrid. This survey is presented as the first exercise of a more ambitious study that aims to know the impact of open data in Spain and to identify the main barriers to its access and availability. To this end, a questionnaire has been sent to members of the public, private and academic sectors. Among the main conclusions of this first survey, we can highlight the following:
- As main barriers to publishing information, 65% of respondents from the public sector mentioned lack of human resources, 39% lack of political leadership and 38% poor data quality.
- The biggest obstacle in accessing public data for re-use is for public sector respondents that the information provided in the data is not homogeneous (41.9%). Respondents from the academic sector point to the lack of quality of the data (43%) and from the private sector it is believed that the main barrier is the lack of updating (49%).
- In terms of the frequency of use of public data, 63% of respondents say that they use the data every day or at least once a week.
- 61% of respondents use the data published on the datos.gob.es portal.
- Respondents overwhelmingly believe that the impact of data openness on the private sector is positive. Thus, 77% of private sector respondents indicate that accessing public data is economically viable and 89% of them say that public data enables them to develop useful solutions.
- 95% of respondents call for a compendium of regulations affecting the access, publication and re-use of public sector data.
- 27% of public sector respondents say they are not aware of the six categories of high-value data set out in Commission Implementing Regulation (EU) 20137138 .
This shows that most respondents are aware of the potential of the sector and the impact of public sector data, although they indicate that some obstacles to re-use need to be overcome and believe that a compendium of the different existing regulations would facilitate their implementation and help the development of the sector.
Top 3 ASEDIE
As in previous editions, the report includes the status of the Top 3 ASEDIE, an initiative that aims for all Autonomous Communities to fully open three sets of data, following unified criteria that facilitate their reuse, and which is included in the IV Open Government Plan. In 2019, the opening of the Cooperatives, Associations and Foundations databases was proposed, and there are currently 16 Autonomous Communities in which they can be accessed in full. Moreover, in eight of them, it is possible to access the NIF with a unique identifier, which improves transparency and makes the information more accurate.
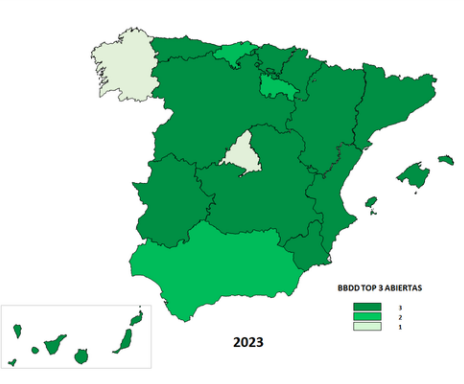
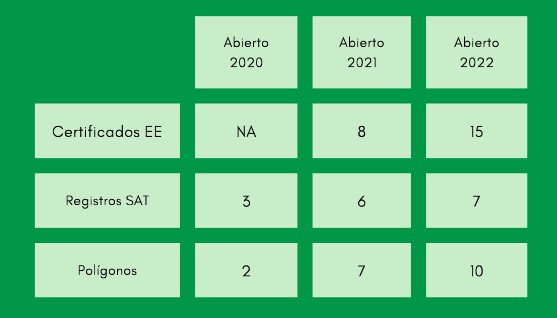
Taking into account the good results of the first proposal, in 2020 a new request for opening data was launched, the Second Top 3 ASEDIE, in this case of Energy Efficiency Certificates, SAT Registries (Agricultural Transformation Companies) and Industrial Estates, whose evolution has also been very positive. The following map shows the opening situation of these three new databases in 2023.
The Top 3 ASEDIE initiative has been a success and has become a reference in the sector, promoting the opening of databases in a joint manner and demonstrating that it is possible to harmonise public data sources to put them at the service of society.
The next steps in this sense will be to monitor the databases already open and to disseminate them at all levels, including the identification of good practices of the Administration and the selection of examples to encourage public-private collaboration in open data. In addition, a new top 3 will be identified to advance in the opening of new databases, and a new initiative will be launched to reach the bodies of the General State Administration, with the identification of a new Top 3 AGE.
Success stories
The report also includes a series of success stories of products and services developed with public sector data, such as Iberinform's API Market, which facilitates access to and integration of 52 sets of company and self-employed data in company management systems. Another successful case is Geocode, a solution focused on standardisation, validation, correction, codification and geolocation processes for postal addresses in Spain and Portugal.
Geomarketing makes it possible to increase the speed of calculating geospatial data and Infoempresa.com has improved its activity reports on Spanish companies, making them more visual, complete and intuitive. Finally, Pyramid Data makes it possible to access the Energy Efficiency Certificates (EEC) of a given property portfolio.
As examples of good practices in the public sector, the ASEDIE report highlights the open statistical data as a driver of the Data Economy of the Canary Islands Statistics Institute (ISTAC) and the technology for the opening of data of the Open Data Portal of the Andalusian Regional Government (Junta de Andalucía).
As a novelty, the category of examples of good practices in the academic sector has been incorporated, which recognises the work carried out by the Geospatial Code and the Report on the state of open data in Spain III, by the Rey Juan Carlos University and FIWARE Foundation.
The 11th ASEDIE Report on the Data Economy in the infomediary field can be downloaded from the ASEDIE website in Spanish. The presentations of the economic indicators and the Top 3 and the Data Ecosystem are also available.
In summary, the report shows the good health of the industry that confirms its recovery after the pandemic, its resilience and growth potential and, in addition, the good results of public-private collaboration and its impact on the data economy are observed.
Noticia
ASEDIE (the Multisectoral Information Association) has just published a new edition of its Infomediary Sector Report, which analyses the real, economic and social value of companies reusing data from the public and/or private sector to develop value-added products. The presentation took place at an event at the National Geographic Institute, in which the Data Office also participated.
This year is special because the report is in its 10th edition. Throughout these years, the different reports have shown the growth and consolidation of the sector. Specifically, for this edition, 701 companies have been identified, which represents a growth of 58% compared to the first report, produced in 2013. However, the figure is very similar to that already analysed in 2021.
This year's edition is subtitled "Data Economy in the Infomediary". The data economy already plays a major role in European production ecosystems and is expected to continue to grow: by 2025, it is estimated that it will contribute 4% of GDP.
In this context, ASEDIE has set among its objectives not only to promote the infomediary sector and the Data Economy, but also to contribute to raising public awareness of its benefits. To this end, it has prepared this report with various indicators that show the impact of the sector.
Main findings of the report
Below is a breakdown of the main conclusions drawn from the report:
- The 10th edition of the report shows a turnover of more than €2 billion, offering employment to almost 23,000 professionals.
- 44% of the infomediary companies surveyed use AI to create value-added products or as a tool. 72% of respondents claim to use both public and private data for the creation of their products and/or services. On the other hand, 17% of the companies indicate that they only use private information compared to 11% that only use public data.
- There are 3 sectors that continue to account for most of the activity, with geographic information standing out. The majority of infomediaries specialise in "geographic information" (24%), "market research" (20%) and the "economic and financial" sub-sector (19%).
- Only two of the subsectors account for almost half of total sales (49%): "Geographic information" and "Economic and financial". However, "Publishing", despite being the 6th sector in terms of number of companies, is the one with the highest average sales (€6M) and median (€917,000). Regarding the latter, it practically doubles the next most important sector ("Directoriales"), which has a value of around €503,000, well above the rest of the sectors.
- Most of the companies are located in the Community of Madrid (38%), Catalonia (13%) and Andalusia (11%). As in previous years, the Infomediary Sector is represented in all the Autonomous Communities.
- 71% of the infomediary companies have been created less than 20 years ago. Of these, 36% are between 11 and 20 years old and 35% are less than 10 years old. The average age continues to be 16 years, with the Publishing subsector being the oldest and the Tourism subsector the youngest.
- The average number of employees per company in the Infomediary Sector is 43, reaching 22,638 employees. As in turnover, the subsector with the highest figure is "geographic information" with 30% of the total.
- The aggregate subscribed capital reached 273,789,439 €, which represents a decrease of 12.2% with respect to the previous edition. Furthermore, the three most capitalised subsectors are "market research", "economic and financial" and "geographic information".
- The net profit generated this year exceeds 110 million euros, which represents a slight decrease compared to the previous year. "Culture" and "Directories" were the only two sub-sectors whose companies did not make a positive profit this year.
- The report identifies the opening of new public sources, the digitisation of the public sector and the interoperability of sources as the main challenges to be addressed. The updating and quality of information are some of the barriers to access and reuse of information.
- 94% of respondents see the creation of the Data Office as an opportunity for the geospatial sector. They expect this body to help in the coordination, centralisation and integration of data, and to promote openness and homogenisation of the availability of public sources.

Top 3 ASEDIE and success stories
The report includes a review of the status of the Top 3 Asedie, ASEDIE's initiative to promote the complete opening of three datasets by all Autonomous Communities, following unified criteria that facilitate their reuse. In 2019, the opening of the Cooperatives, Associations and Foundations databases was proposed. The initiative was a success, and all Communities have now opened at least two of the three proposed databases. This initiative is included in Commitment 9 of the 4th Open Government Plan.
Given the good reception, a new Top 3 was launched in 2020, aimed at those Autonomous Communities that had already opened the first three databases, so that they could continue to advance in the opening of new datasets relating to: Register of Energy Efficiency Certificates, Industrial Estates and SAT Registers (Agricultural Transformation Companies). The evolution in the opening of these databases in the last year has also been remarkable, as shown in the following image.
The report concludes with several success stories of infomediary companies and examples of the products and services they produce, such as Infoempresa's web browser extension for obtaining business information or Axesor's platform (Investiga Pro) that allows online consultation of the Real Property Databases of both the Commercial Registry and the General Council of Notaries.
The report is available on Asedie's website in Spanish together with the video of the presentation of the report. It will soon be available in English together with an executive summary in French and Portuguese.
In conclusion, the sector is in good health, but this year has shown a slight decrease of 4.6% in times of pandemic. However, these figures are above the Spanish average (Spain's GDP fell by almost 10% in the same period). Although 55% of respondents have noticed the effect of Covid-19 on companies' or citizens' access to their data, the fact that 92% of respondents say they are satisfied with the level of digitisation available to them gives hope for improved results in the near future.
Noticia
Open data can be very useful in promoting aspects such as the health and well-being of citizens or the protection of the environment, as well as the growth of economies. The opening of information encourages innovation, the creation and adaptation of companies and organizations around services and technologies capable of generating profitability and offering solutions to current problems from the reuse of data.
But, in addition, economic data contributes to many organizations being able to make better decisions. Economic statistics and indicators allow us to know how a certain market or country evolves, discover trends and act accordingly.
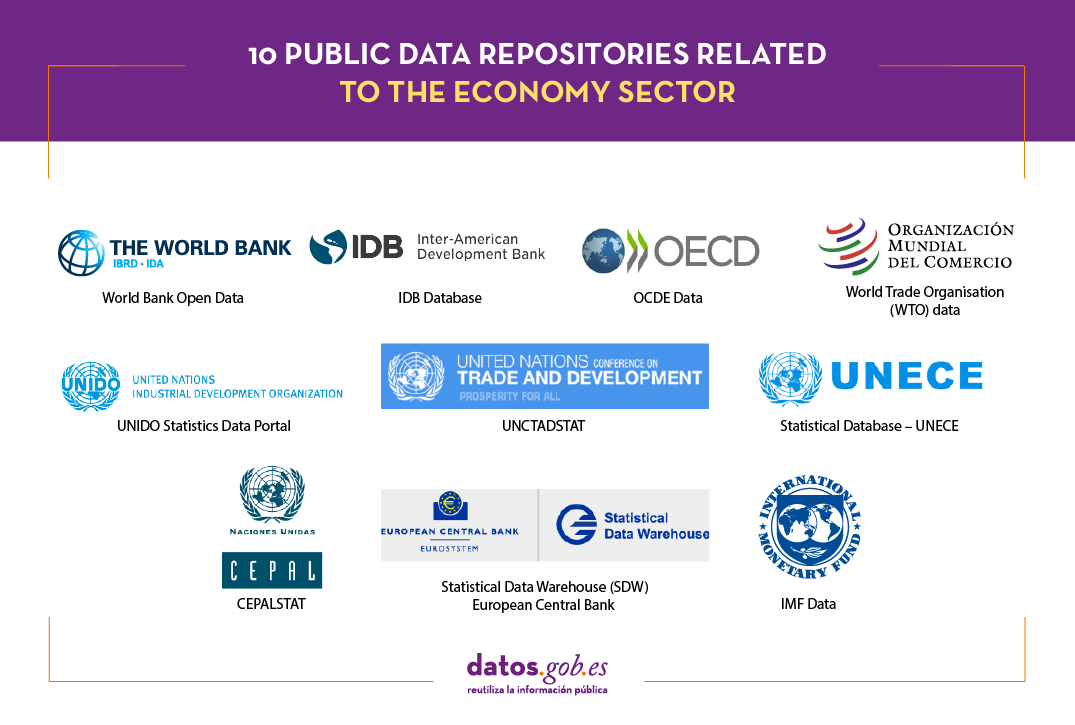
If you are interested in accessing this type of data, below, we collect 10 examples of repositories related to the economy at an international level:
-
Publisher: World Bank
This is a website belonging to the World Bank. This platform offers a complete range of economic data that are frequently updated and allows access to open information produced by the World Bank itself. Among the type of data it offers are international debt statistics, world development indicators or databases on household consumption patterns around the world, among many others.
Two interesting sections stand out. One is its data catalog, where you can find information on economic topics such as statistical performance indicators or data on COVID-19, for example. Another is its microdata section, which offers a collection of datasets from the World Bank and other international, regional and national organizations.
Much of this data are offered in the most popular formats (HTML, JSON, PDF, CSV, ...). In addition, it has a space for reusers, with information on APIs.
-
Publisher: IMF (Internationaly Monetary Fund)
The International Monetary Fund (IMF) is a 190-country organization that works to promote global monetary cooperation, ensure financial stability, facilitate international trade, and more.
This portal contains IMF datasets on global financial stability, regional economics, global financial statistics, economic outlook, and more. Data can be downloaded in various formats, including XLSX and XLS.
-
Publisher: OECD (Organisation for Economic Co-operation and Development)
The OCDE is an international organization of which 38 countries, including Spain, are members, whose objective is to address economic, social and governance challenges.
The OECD data catalog has a classification by sector, including the economic sector. It offers the possibility of filtering data according to whether or not they have access to the API. In addition, this portal allows queries to be made on large databases in its OECD.Stat data warehouse.
Particularly interesting are its data visualizations, such as these developed to show information about global employment rates, as well as other employment-related indicators.
-
Publisher: UNECE (United Nations Economic Commission for Europe)
Created in 1947 and composed of 56 member states, it is one of the five UN regional commissions. Its objectives include promoting pan-European economic integration and supporting countries with economies in transition.
On its public information portal, you can find various datasets, mostly economic, linked to the different countries of Europe. It also offers other datasets on population and transport and some alternative resources such as visualizations or data maps.
The data is displayed in four different forms: graphs, rankings, tables and maps. In this example, information about the global youth unemployment rate can be queried through the 4 means mentioned above. The data can be downloaded in CSV, TSV or JSON.
-
Publisher: Economic Commission for Latin America and the Caribbean (CEPAL, United Nations).
CEPALSTAT is the portal where you can find all the statistical information on the countries of Latin America and the Caribbean, collected, systematized and published by the Economic Commission for Latin America and the Caribbean (CEPAL, in spanish).
This portal brings together databases and statistical publications, as well as economic datasets for Latin America and the Caribbean, often accompanied by other resources such as data visualizations or maps. It also provides access to these data through an API to speed up and facilitate the data search process for its users. Data can be downloaded in XML, JSON or XLXS.
-
Publisher: ECB (European Central Bank)
The ECB, in collaboration with the national central banks and other national (statistical and supervisory) authorities of the European Union, offers a service for the development, collection, compilation and dissemination of statistics in open format.
The Statistical Data Warehouse provides indicators for the euro area, including in some cases national level breakdowns. Each of the statistics offered on this portal has a brief introductory description of the topics covered. All data are available for download in Excel and CSV format.
-
Publisher: World Trade Organisation (WTO).
The World Trade Organisation (WTO) is an international organisation that deals with the rules governing trade between countries. Its main objective is to help producers of goods and services, exporters and importers to conduct their activities in an optimal way.
The organisation offers access to a selection of relevant databases providing statistics and information on different trade-related measures. This information is classified in four main blocks: goods, services, intellectual property, statistics and other topics, making it easier for users to search for data.
On this page you can consult the WTO online systems (databases/websites) that are active. Some of them require registration.
UNIDO Statistics Data Portal
-
Publisher: United Nations Industrial Development Organization (UNIDO).
UNIDO is a specialised agency of the United Nations that promotes industrial development for poverty reduction, inclusive globalisation and environmental sustainability.
It publishes, among other things, datasets on industrial development, manufacturing production and investment. On its website, it has a search engine for information on indicators such as population growth or GDP growth by country. These data can be visualised through a graph that is updated with the selected information, also offering the possibility of comparing data from different countries within the same graph.
By accessing the DataBase section, each dataset can be downloaded in excel and CSV format.
UNCTADSTAT
-
Publisher: UNCTAD (United Nations Conference on Trade and Development)
UNCTAD is an organisation charged with helping developing countries harness international trade, investment, financial resources and technology to achieve sustainable and inclusive development.
On its open data portal, it collects statistical series by country and product, with a special focus on countries with developing and transition economies. Digital economy, international trade in services, maritime transport or inflation and exchange rates are just some of the topics that can be consulted on this platform.
In addition, for users who are not used to navigating this type of portal, UNCTAD provides a series of video tutorials that introduce the user to the data centre and show, among other things, how to export information from the platform (downloadable in CSV or XLSX).
-
Publisher: IDB (Inter-American Development Bank)
The Inter-American Development Bank (IDB) is an inter-national financial organisation whose main objective is to finance viable economic, social and institutional development projects and promote trade integration in Latin America and the Caribbean.
In its data section, it offers country development indicators related to the macroeconomic profile, global integration and social prospects of each country. Moreover, in this section you can find some additional resources such as graphs and visualisations that allow you to filter the information according to different indicators or courses to increase your economic knowledge based on the data.
Most of the data can be downloaded in CSV, JSON or RDF.
This has been just a small selection of data repositories related to the economic sector that may be of interest to you. Do you know of any other relevant repositories related to this field? Leave us a comment or send us an email to dinamizacion@datos.gob.es
Documentación
1. Introduction
Data visualization is a task linked to data analysis that aims to represent graphically the underlying information. Visualizations play a fundamental role in data communication, since they allow to draw conclusions in a visual and understandable way, also allowing detection of patterns, trends, anomalous data or projection of predictions, among many other functions. This makes its application transversal to any process that involves data. The visualization possibilities are very broad, from basic representations such as line, bar or sector graph, to complex visualizations configured on interactive dashboards.
Before starting to build an effective visualization, a prior data treatment must be performed, paying attention to their collection and validation of their content, ensuring that they are free of errors and in an adequate and consistent format for processing. The previous data treatment is essential to carry out any task related to data analysis and realization of effective visualizations.
We will periodically present a series of practical exercises on open data visualizations that are available on the portal datos.gob.es and in other similar catalogues. In there, we approach and describe in a simple way the necessary steps to obtain data, perform transformations and analysis that are relevant to creation of interactive visualizations from which we may extract all the possible information summarised in final conclusions. In each of these practical exercises we will use simple code developments which will be conveniently documented, relying on free tools. Created material will be available to reuse in Data Lab on Github.
Captura del vídeo que muestra la interacción con el dashboard de la caracterización de la demanda de empleo y la contratación registrada en España disponible al final de este artículo
2. Objetives
The main objective of this post is to create an interactive visualization using open data. For this purpose, we have used datasets containing relevant information on evolution of employment demand in Spain over the last years. Based on these data, we have determined a profile that represents employment demand in our country, specifically investigating how does gender gap affects a group and impact of variables such as age, unemployment benefits or region.
3. Resources
3.1. Datasets
For this analysis we have selected datasets published by the Public State Employment Service (SEPE), coordinated by the Ministry of Labour and Social Economy, which collects time series data with distinct breakdowns that facilitate the analysis of the qualities of job seekers. These data are available on datos.gob.es, with the following characteristics:
- Demandantes de empleo por municipio: contains the number of job seekers broken down by municipality, age and gender, between the years 2006-2020.
- Gasto de prestaciones por desempleo por Provincia: time series between the years 2010-2020 related to unemployment benefits expenditure, broken down by province and type of benefit.
- Contratos registrados por el Servicio Público de Empleo Estatal (SEPE) por municipio: these datasets contain the number of registered contracts to both, job seekers and non-job seekers, broken down by municipality, gender and contract type, between the years 2006-2020.
3.2. Tools.
R (versión 4.0.3) and RStudio with RMarkdown add-on have been used to carry out this analysis (working environment, programming and drafting).
RStudio is an integrated open source development environment for R programming language, dedicated to statistical analysis and graphs creation.
RMarkdown allows creation of reports integrating text, code and dynamic results into a single document.
To create interactive graphs, we have used Kibana tool.
Kibana is an open code application that forms a part of Elastic Stack (Elasticsearch, Beats, Logstasg y Kibana) qwhich provides visualization and exploration capacities of the data indexed on the analytics engine Elasticsearch. The main advantages of this tool are:
- Presents visual information through interactive and customisable dashboards using time intervals, filters faceted by range, geospatial coverage, among others
- Contains development tools catalogue (Dev Tools) to interact with data stored in Elasticsearch.
- It has a free version ready to use on your own computer and enterprise version that is developed in the Elastic cloud and other cloud infrastructures, such as Amazon Web Service (AWS).
On Elastic website you may find user manuals for the download and installation of the tool, but also how to create graphs, dashboards, etc. Furthermore, it offers short videos on the youtube channel and organizes webinars dedicated to explanation of diverse aspects related to Elastic Stack.
If you want to learn more about these and other tools which may help you with data processing, see the report “Data processing and visualization tools” that has been recently updated.
4. Data processing
To create a visualization, it´s necessary to prepare the data properly by performing a series of tasks that include pre-processing and exploratory data analysis (EDA), to understand better the data that we are dealing with. The objective is to identify data characteristics and detect possible anomalies or errors that could affect the quality of results. Data pre-processing is essential to ensure the consistency and effectiveness of analysis or visualizations that are created afterwards.
In order to support learning of readers who are not specialised in programming, the R code included below, which can be accessed by clicking on “Code” button, is not designed to be efficient but rather to be easy to understand. Therefore, it´s probable that the readers more advanced in this programming language may consider to code some of the functionalities in an alternative way. A reader will be able to reproduce this analysis if desired, as the source code is available on the datos.gob.es Github account. The way to provide the code is through a RMarkdown document. Once it´s loaded to the development environment, it may be easily run or modified.
4.1. Installation and import of libraries
R base package, which is always available when RStudio console is open, includes a wide set of functionalities to import data from external sources, carry out statistical analysis and obtain graphic representations. However, there are many tasks for which it´s required to resort to additional packages, incorporating functions and objects defined in them into the working environment. Some of them are already available in the system, but others should be downloaded and installed.
#Instalación de paquetes \r\n #El paquete dplyr presenta una colección de funciones para realizar de manera sencilla operaciones de manipulación de datos \r\n if (!requireNamespace(\"dplyr\", quietly = TRUE)) {install.packages(\"dplyr\")}\r\n #El paquete lubridate para el manejo de variables tipo fecha \r\n if (!requireNamespace(\"lubridate\", quietly = TRUE)) {install.packages(\"lubridate\")}\r\n#Carga de paquetes en el entorno de desarrollo \r\nlibrary (dplyr)\r\nlibrary (lubridate)\r\n4.2. Data import and cleansing
a. Import of datasets
Data which will be used for visualization are divided by annualities in the .CSV and .XLS files. All the files of interest should be imported to the development environment. To make this post easier to understand, the following code shows the upload of a single .CSV file into a data table.
To speed up the loading process in the development environment, it´s necessary to download the datasets required for this visualization to the working directory. The datasets are available on the datos.gob.es Github account.
#Carga del datasets de demandantes de empleo por municipio de 2020. \r\n Demandantes_empleo_2020 <- \r\n read.csv(\"Conjuntos de datos/Demandantes de empleo por Municipio/Dtes_empleo_por_municipios_2020_csv.csv\",\r\n sep=\";\", skip = 1, header = T)\r\nOnce all the datasets are uploaded as data tables in the development environment, they need to be merged in order to obtain a single dataset that includes all the years of the time series, for each of the characteristics related to job seekers that will be analysed: number of job seekers, unemployment expenditure and new contracts registered by SEPE.
#Dataset de demandantes de empleo\r\nDatos_desempleo <- rbind(Demandantes_empleo_2006, Demandantes_empleo_2007, Demandantes_empleo_2008, Demandantes_empleo_2009, \r\n Demandantes_empleo_2010, Demandantes_empleo_2011,Demandantes_empleo_2012, Demandantes_empleo_2013,\r\n Demandantes_empleo_2014, Demandantes_empleo_2015, Demandantes_empleo_2016, Demandantes_empleo_2017, \r\n Demandantes_empleo_2018, Demandantes_empleo_2019, Demandantes_empleo_2020) \r\n#Dataset de gasto en prestaciones por desempleo\r\ngasto_desempleo <- rbind(gasto_2010, gasto_2011, gasto_2012, gasto_2013, gasto_2014, gasto_2015, gasto_2016, gasto_2017, gasto_2018, gasto_2019, gasto_2020)\r\n#Dataset de nuevos contratos a demandantes de empleo\r\nContratos <- rbind(Contratos_2006, Contratos_2007, Contratos_2008, Contratos_2009,Contratos_2010, Contratos_2011, Contratos_2012, Contratos_2013, \r\n Contratos_2014, Contratos_2015, Contratos_2016, Contratos_2017, Contratos_2018, Contratos_2019, Contratos_2020)b. Selection of variables
Once the tables with three time series are obtained (number of job seekers, unemployment expenditure and new registered contracts), the variables of interest will be extracted and included in a new table.
First, the tables with job seekers (“unemployment_data”) and new registered contracts (“contracts”) should be added by province, to facilitate the visualization. They should match the breakdown by province of the unemployment benefits expenditure table (“unemployment_expentidure”). In this step, only the variables of interest will be selected from the three datasets.
#Realizamos un group by al dataset de \"datos_desempleo\", agruparemos las variables numéricas que nos interesen, en función de varias variables categóricas\r\nDtes_empleo_provincia <- Datos_desempleo %>% \r\n group_by(Código.mes, Comunidad.Autónoma, Provincia) %>%\r\n summarise(total.Dtes.Empleo = (sum(total.Dtes.Empleo)), Dtes.hombre.25 = (sum(Dtes.Empleo.hombre.edad...25)), \r\n Dtes.hombre.25.45 = (sum(Dtes.Empleo.hombre.edad.25..45)), Dtes.hombre.45 = (sum(Dtes.Empleo.hombre.edad...45)),\r\n Dtes.mujer.25 = (sum(Dtes.Empleo.mujer.edad...25)), Dtes.mujer.25.45 = (sum(Dtes.Empleo.mujer.edad.25..45)),\r\n Dtes.mujer.45 = (sum(Dtes.Empleo.mujer.edad...45)))\r\n#Realizamos un group by al dataset de \"contratos\", agruparemos las variables numericas que nos interesen en función de las varibles categóricas.\r\nContratos_provincia <- Contratos %>% \r\n group_by(Código.mes, Comunidad.Autónoma, Provincia) %>%\r\n summarise(Total.Contratos = (sum(Total.Contratos)),\r\n Contratos.iniciales.indefinidos.hombres = (sum(Contratos.iniciales.indefinidos.hombres)), \r\n Contratos.iniciales.temporales.hombres = (sum(Contratos.iniciales.temporales.hombres)), \r\n Contratos.iniciales.indefinidos.mujeres = (sum(Contratos.iniciales.indefinidos.mujeres)), \r\n Contratos.iniciales.temporales.mujeres = (sum(Contratos.iniciales.temporales.mujeres)))\r\n#Seleccionamos las variables que nos interesen del dataset de \"gasto_desempleo\"\r\ngasto_desempleo_nuevo <- gasto_desempleo %>% select(Código.mes, Comunidad.Autónoma, Provincia, Gasto.Total.Prestación, Gasto.Prestación.Contributiva)Secondly, the three tables should be merged into one that we will work with from this point onwards..
Caract_Dtes_empleo <- Reduce(merge, list(Dtes_empleo_provincia, gasto_desempleo_nuevo, Contratos_provincia))
c. Transformation of variables
When the table with variables of interest is created for further analysis and visualization, some of them should be transformed to other types, more adequate for future aggregations.
#Transformación de una variable fecha\r\nCaract_Dtes_empleo$Código.mes <- as.factor(Caract_Dtes_empleo$Código.mes)\r\nCaract_Dtes_empleo$Código.mes <- parse_date_time(Caract_Dtes_empleo$Código.mes(c(\"200601\", \"ym\")), truncated = 3)\r\n#Transformamos a variable numérica\r\nCaract_Dtes_empleo$Gasto.Total.Prestación <- as.numeric(Caract_Dtes_empleo$Gasto.Total.Prestación)\r\nCaract_Dtes_empleo$Gasto.Prestación.Contributiva <- as.numeric(Caract_Dtes_empleo$Gasto.Prestación.Contributiva)\r\n#Transformación a variable factor\r\nCaract_Dtes_empleo$Provincia <- as.factor(Caract_Dtes_empleo$Provincia)\r\nCaract_Dtes_empleo$Comunidad.Autónoma <- as.factor(Caract_Dtes_empleo$Comunidad.Autónoma)d. Exploratory analysis
Let´s see what variables and structure the new dataset presents.
str(Caract_Dtes_empleo)\r\nsummary(Caract_Dtes_empleo)The output of this portion of the code is omitted to facilitate reading. Main characteristics presented in the dataset are as follows:
- Time range covers a period from January to December 2020.
- Number of columns (variables) is 17. .
- It presents two categorical variables (“Province”, “Autonomous.Community”), one date variable (“Code.month”) and the rest are numerical variables.
e. Detection and processing of missing data
Next, we will analyse whether the dataset has missing values (NAs). A treatment or elimination of NAs is essential, otherwise it will not be possible to process properly the numerical variables.
any(is.na(Caract_Dtes_empleo)) \r\n#Como el resultado es \"TRUE\", eliminamos los datos perdidos del dataset, ya que no sabemos cual es la razón por la cual no se encuentran esos datos\r\nCaract_Dtes_empleo <- na.omit(Caract_Dtes_empleo)\r\nany(is.na(Caract_Dtes_empleo))4.3. Creation of new variables
In order to create a visualization, we are going to make a new variable from the two variables present in the data table. This operation is very common in the data analysis, as sometimes it´s interesting to work with calculated data (e.g., the sum or the average of different variables) instead of source data. In this case, we will calculate the average unemployment expenditure for each job seeker. For this purpose, variables of total expenditure per benefit (“Expenditure.Total.Benefit”) and the total number of job seekers (“total.JobSeekers.Employment”) will be used.
Caract_Dtes_empleo$gasto_desempleado <-\r\n (1000 * (Caract_Dtes_empleo$Gasto.Total.Prestación/\r\n Caract_Dtes_empleo$total.Dtes.Empleo))4.4. Save the dataset
Once the table containing variables of interest for analysis and visualizations is obtained, we will save it as a data file in CSV format to perform later other statistical analysis or use it within other processing or data visualization tools. It´s important to use the UTF-8 encoding (Unicode Transformation Format), so the special characters may be identified correctly by any other tool.
write.csv(Caract_Dtes_empleo,\r\n file=\"Caract_Dtes_empleo_UTF8.csv\",\r\n fileEncoding= \"UTF-8\")5. Creation of a visualization on the characteristics of employment demand in Spain using Kibana
The development of this interactive visualization has been performed with usage of Kibana in the local environment. We have followed Elastic company tutorial for both, download and installation of the software.
Below you may find a tutorial video related to the whole process of creating a visualization. In the video you may see the creation of dashboard with different interactive indicators by generating graphic representations of different types. The steps to build a dashboard are as follows:
A continuación se adjunta un vídeo tutorial donde se muestra todo el proceso de realización de la visualización. En el vídeo podrás ver la creación de un cuadro de mando (dashboard) con diferentes indicadores interactivos mediante la generación de representaciones gráficas de diferentes tipos. Los pasos para obtener el dashboard son los siguientes:
- Load the data into Elasticsearch and generate an index that allows to interact with the data from Kibana. This index permits a search and management of the data in the loaded files, practically in real time.
- Generate the following graphic representations:
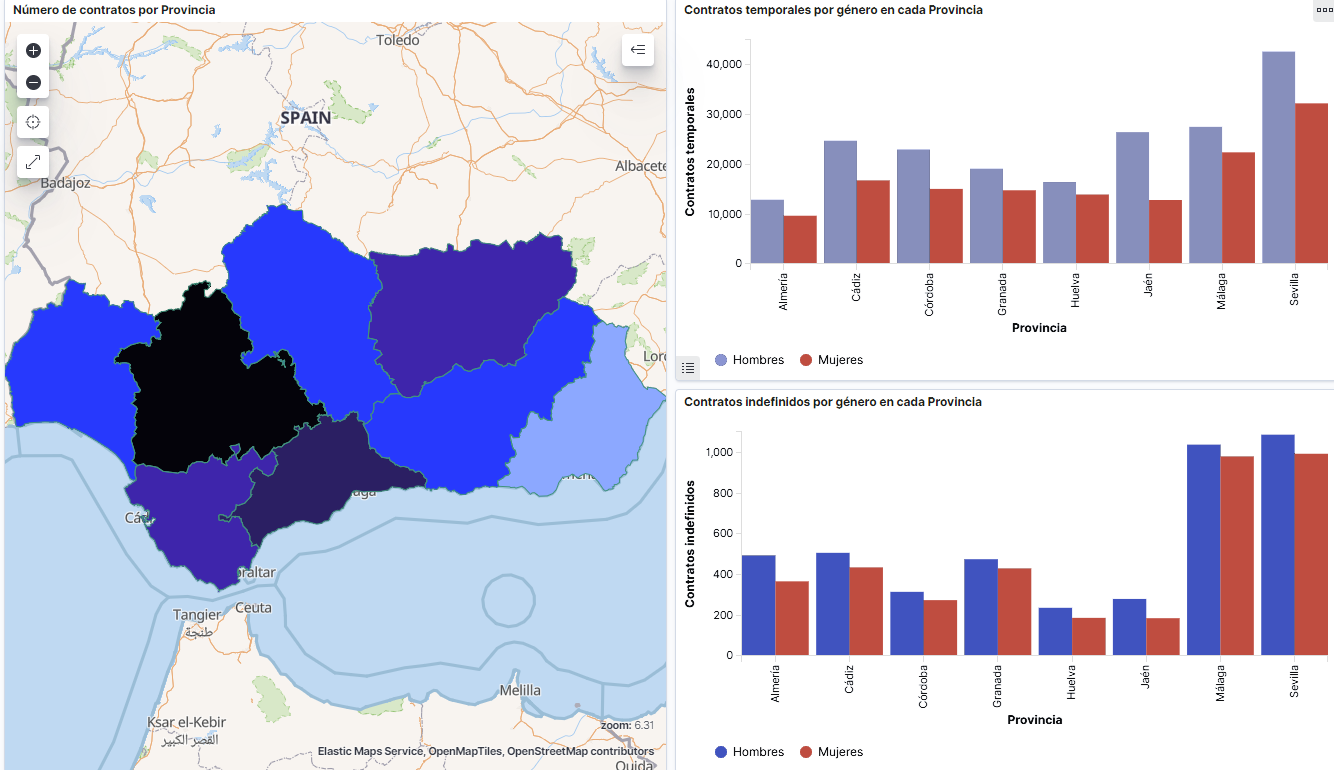
- Line graph to represent a time series on the job seekers in Spain between 2006 and 2020.
- Sector graph with job seekers broken down by province and Autonomous Community
- Thematic map showing the number of new contracts registered in each province on the territory. For creation of this visual it´s necessary to download a dataset with province georeferencing published in the open data portal Open Data Soft.
- Build a dashboard.
Below you may find a tutorial video interacting with the visualization that we have just created:
6. Conclusions
Looking at the visualization of the data related to the profile of job seekers in Spain during the years 2010-2020, the following conclusions may be drawn, among others:
- There are two significant increases of the job seekers number. The first, approximately in 2010, coincides with the economic crisis. The second, much more pronounced in 2020, coincides with the pandemic crisis.
- A gender gap may be observed in the group of job seekers: the number of female job seekers is higher throughout the time series, mainly in the age groups above 25.
- At the regional level, Andalusia, followed by Catalonia and Valencia, are the Autonomous Communities with the highest number of job seekers. In contrast to Andalusia, which is an Autonomous Community with the lowest unemployment expenditure, Catalonia presents the highest value.
- Temporal contracts are leading and the provinces which generate the highest number of contracts are Madrid and Barcelona, what coincides with the highest number of habitants, while on the other side, provinces with the lowest number of contracts are Soria, Ávila, Teruel and Cuenca, what coincides with the most depopulated areas of Spain.
This visualization has helped us to synthetise a large amount of information and give it a meaning, allowing to draw conclusions and, if necessary, make decisions based on results. We hope that you like this new post, we will be back to present you new reuses of open data. See you soon!
Noticia
The new edition of the Report on the Infomediary Sector by ASEDIE (Multisectoral Information Association), which analyzes the real, economic and social value of companies that reuse data from the public and / or private sector to develop value-added products.
In the 9th edition of this report, 700 companies have been analyzed, showing a stable sector. Specifically, in 2019 the Infomediary Sector grew by 6.4%, an evolution above that of the Gross Domestic Product, which was 3.4%.
In addition, it provides data on how infomediary companies closed 2019 with a sales volume of more than 2,543 million euros and offering employment to almost 22,000 employees.
Below, we break down the main conclusions drawn from the report:
- 3 sectors continue to concentrate most of the activity, highlighting geographic information. Most infomediary companies are specialized in “geographic information” (24%), “market studies” (21%) and the “economic and financial” subsector (18%).
- Half of the subsectors account for 85% of total sales. Highlights Especially the Geographic Information with more than 600 million euros of turnover (23.6%).
- 61% of the infomediary companies consulted use AIto create value-added products or as a tool. 70% of those surveyed affirm that they also reuse the data for internal use, compared to 30% who indicate that the use is exclusively external.
- More than half of the companies are located in the Community of Madrid (38%), Catalonia (13%) and Andalusia (11%). As in previous years, the Infomediary Sector is represented in all the Autonomous Communities.
- Almost 40% of the companies in the Sector have been created in the last 10 years. The average seniority is 16 years, with the Publishing subsector being the oldest and the Tourism subsector being the youngest.
- The average number of employees per company in the Infomediary Sector amounts to 37, until reaching 21,988 workers. As with billing, the subsector with the highest figure is “geographic information” with 30.5% of the total.
- The aggregate subscribed capital exceeds 310 million euros, almost 11 million more than in the previous edition. In addition, the three most capitalized subsectors are "market studies", "economic and financial" and geographic information.
- All subsectors have 65% or more of companies in profits. As in previous years, the net profit generated has exceeded 125 million euros.
- Data analysis and the opening of new databases stand out this time as the main challenges of the Infomediary Sector, closely followed by Digitization. On the other hand, the lack of a “data culture” and the low quality of data are some of the barriers that hinder the access and reuse of information.
The report includes a review of the situation of the Top 3 Asedie, ASEDIE's initiative to promote that all Autonomous Communities fully open three data sets -Cooperatives, Associations and Foundations -, following unified criteria that facilitate their reuse. At the moment, there are already 15 Communities that have opened at least two of the three proposed databases.
The document concludes with several success stories of infomediary companies and examples of the products and services they produce, such as the Infoempresa directory of innovative companies in Spain or the use that Iberimform is doing IBM Watson.
The reportIt is available on the Asedie website in Spanish and English, and will soon be in French. Also available is report presentation video.
In conclusion, we are facing a sector in good health, which shows outstanding growth. Although 74% of those surveyed believe that the pandemic will directly affect the evolution of the Sector this year, the fact that 96% of those surveyed use data to create their value-added products or services makes them confident in positive long-term prospects.
")
Blog
New technologies are changing the world we live in. The society changes, the economy changes, and with that, the jobs change. The implementation of technologies such as Artificial Intelligence, Big Data or Internet of Things are driving the demand for new professional profiles that we did not even conceive a decade ago. In addition, the possibilities of automating tasks currently developed by humans, executing task more quickly and efficiently, leads some professionals to consider that their job could be in danger. Responding to this situation is one of the big challenges we have to overcome.
According to the report It's learning. Just not as we know. How to accelerate skills acquisition in the age of intelligent technologies, carried out by G20 Young Entrepreneurs' Alliance and Accenture, if skill-building doesn’t catch up with the rate of technological progress, the G20 economies could lose up to US$11.5 trillion in cumulative GDP growth in the next ten years.
But this change is not simple. It is not correct just to assume that intelligent technologies will eliminate some jobs and create new ones. In fact, the biggest effect will be the evolution of traditional roles. According to the study, 90% of each worker time will be affected by new technologies. Taking the average of all sectors, 38% of worker time is currently dedicated to tasks that will be automated, while 51% are activities that can be improved (or augmented), using new technologies that help to increase our skills. In short, the solution is not just to train more engineers or data analysts, since even these profiles will have to evolve to adapt to a future that is closer than it seems.
To know how this change will affect the different professional profiles, the report analyse the tasks and skills necessary to carry out the current work positions, determining how they will evolve in the future. To facilitate the analysis, the professions have been grouped around 10 different roles. The following table shows the result of the study:
| Role cluster | Typical activities | Illustrative occupations | Illustrative task evolution |
|---|---|---|---|
| Management & Leadership | Supervises and takes decisions | Corporate managers and education administrators | Marketing managers handle data and take decisions based on social media and web metrics |
| Empathy & Support | Provides expert support and guidance | Psychiatrists and nurses | Nurses can focus on more patient care rather than administration and form filling |
| Science & Engineering | Conducts deep, technical analyzes | Chemical engineers and computer programmers | Researchers focus on sharing, explaining and applying their work, rather than being trapped in labs |
| Process & Analysis | Processes and analyzes information | Auditors and clerks | Accountants can ensure quality control rather than crunch data |
| Analytical subject-Matter Expertise | Examines and applies experience of complex systems | Air traffic controllers and forensic science technicians | Information security analysts can widen and deepen searches, supported by AI-powered simulations |
| Relational subject-matter Expertise | Applies expertise in environments that demand human interaction | Medical team workers and interpreters | Ambulance dispatchers can focus on accurate assessment and support, rather than logistical details |
| Technical Equipment maintenance | Installs and maintains equipment and machinery | Mechanics and maintenance workers | Machinery mechanics work with data to predict failure and perform preventative repairs |
| Machine Operation & Manoeuvring | Operates machinery and drives vehicles | Truck drivers and crane operators | Tractor operators can ensure data-guided, accurate and tailored treatment of crops, whilst “driving”. |
| Physical Manual Labor | Performs strenuous physical tasks in specific environments | Construction and landscaping workers | Construction workers reduce re-work as technology predicts the location and nature of physical obstacles |
| Physical Services | Performs services that demand physical activity | Hairdressers and cooks | Transport attendants can focus on customer needs and service rather than technical tasks |
The results show how some skills, such as administrative management, will decline in importance. However, for almost every single role described in the previous table, a combination of complex reasoning, creativity, socio-emotional intelligence and sensory perception skills will be necessary.
The problem is that these types of skills are acquired with experience. The current education and learning systems, both regulated and corporate, are not designed to address this revolution, so it will be also necessary their evolution. To facilitate this transition, the report provides a series of recommendations:
- Speed up experiential learning: Teaching has traditionally been based on a passive model, consisting of absorbing knowledge by listening or reading. However, experiential learning becomes more and more powerful, that is, through the practical application of knowledge. This would be the case of airplane pilots, who learn through flight simulation programs. New technologies, such as augmented reality or artificial intelligence, help to make these solutions based on experience more personalized and accessible, covering a greater number of sectors and job positions.
- Shift focus from institutions to individuals: Inside a work team it is common to found workers with different capacities and abilities, in such a way that they complement each other, but, as we have seen, it is also necessary to put more emphasis on expanding the variety of skills of each individual worker, including new skills such as creativity and socio-emotional intelligence. The current system does not drive the learning of these subjects, so it is necessary to design metrics and incentives that encourage the mix of skills in each person.
- Empower vulnerable learners: Learning must be accessible to all employees, in order to close the current skills gap. According to the study, in general, the most vulnerable workers to technological change are the least qualified, because their jobs tend to be easier to automate. However, they also tend to receive the least training from the company, something that must change. Other groups to pay attention to are the older workers and those from small companies, with fewer resources. An increasing number of companies are using modular and free MOOC courses to facilitate the equal acquisition of skills among the entire workforce. In addition, some governments, such as France or Singapore, are providing training aids.
In short, we are in a moment of change. It is necessary to stop and reflect on how our work environment will change in order to adapt ourselves to it, acquiring new skills that provide us with competitive advantages in our professional future.
Noticia
ASEDIE (Multisector Information Association) has published a new edition of the Infomediary Sector report, which analyses the real, economic and social value of companies reusing both public and private data to create value-added products.
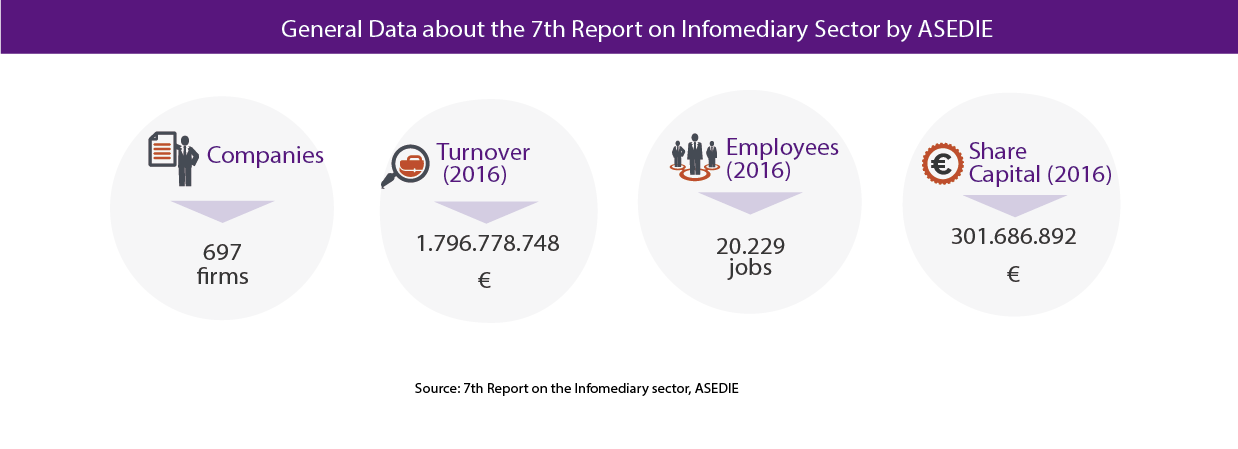
The number of companies analysed on this occasion was 697, 35 more than in the previous edition. It should be noted that the financial information used for sales and employees corresponds to fiscal year 2017, because 2018 information was not yet available.
The main conclusions of the report are:
- 97% of Infomediary companies use open data from the public sector. In addition, three of four combine this information with private data. In this context, it is not surprising that 83% of surveyees believe that the opening of databases and access to them for reuse is apriority for the sector's evolution.
- More than 50% of the companies are located in the Community of Madrid (37%) and Catalonia (18%). However, the Infomediary Sector is represented in all the Autonomous Communities, with the exception of the Autonomous Cities of Ceuta and Melilla.
- 3 sectors continue to concentrate most of the activity. Most infomediary companies specialize in "geographic information" (22%), "market research" (21%) and the "economic & financial" subsector (20%).
- A sustainable sector, but with a large number of new companies. 60% of the companies analyzed have more than 10 years and almost one third (29%) exceeds twenty - as a curiosity, the oldest company dates from 1947-. But it is also a sector that attracts new actors, since 31% of companies have been created in the last 5 years.
- Turnover increased by 5.4% compared to the previous year. Specifically, the aggregated turnover in the Infomediary Sector is € 1,796,778,748. This figure is very positive, although it should be noted that most of the turnover is concentrated in a few big companies.
- And the number of employees increased by 4.6%, reaching 20,229 workers. These data are very positive, since national full-time employment was 2.9%.
- The aggregate subscribed capital of the sector exceeds 300 million euros. After two consecutive years of decline, the aggregate subscribed capital has experienced a 10% growth in this year, although it is lower than 2016.
- 70% of companies present benefits. 70% of the companies present an average profit of approximately 300,000 euros, with the average loss of the remaining 30% being similar, but with a negative sign. As in previous years, the net profit generated has exceeded 62 million euros.
- Low commercial risk. The probability risk estimated for a company over the last 12 months is moderate or minimum for 74% of companies.
- Data analysis and Big Data stand out again as the main challenges of the Infomediary Sector, followed very closely by the opening of new information sources. On the other hand, the barriers for reuse most mentioned by the surveyees are the different data availability between Autonomous Communities and City Councils.
The report ends by showing a series of success stories in infomediary companies, as re-users, and public sector, as open data publishers.
In short, we are facing a sector with good health, which has experienced a remarkable growth, and with positive prospects for the future: more than half of the surveyees (65%) estimate that the Infomediary Sector will grow over the course of this year, specifically 64% of them estimate the growth to be between 2-5%.
Noticia
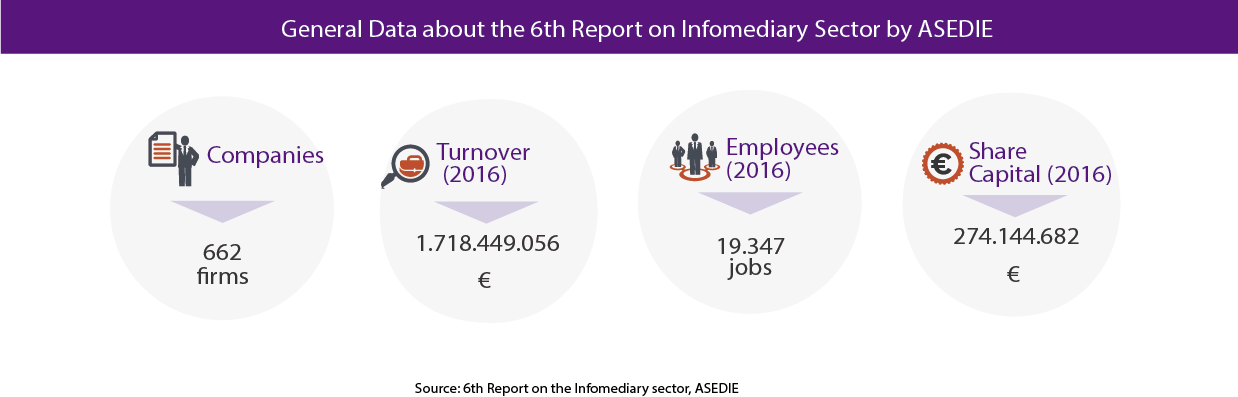
For the sixth consecutive year, ASEDIE (Multisectorial Information Association) has presented a new edition of its report on the infomediary sector. Its objective is to favor the opening of databases and to know the real economic and social value that this sector brings to society. To that end, 662 companies have been analyzed, 26 more than in the 2017 edition. The report analyzes the 2016 data, comparing the result with the previous edition of the report.
Among the novelties of this year, we can find new analyzes and indicators, such as the average turnover per employee or profit and loss analysis, and the monitoring of information requests at Autonomous Communities level. In addition, a specific survey has been conducted to more than 50 infomediary companies, to find out about their vision of the challenges and opportunities of the sector. The report also include success stories that can be used as a guide to optimize the reuse of open data from public organizations.
Some of the main conclusions of the report are:
- Lack of knowledge about what an infomediary is. Despite the fact that 80% of the surveyed companies share that the use and treatment of information affects their business, only 39% considered themselves as being an Infomediary Company. ASEDIE defines infomediary companies as those who “create value-added products and services with data from both the private and public sector, which help in the decision-making”
- The number of companies increased. In 2017, 21 companies ceased their activity, while 47 new companies were incorporated. The main reason for these inactivities is the company’s own commercial extinction, above mergers or defaults
- Three sectors concentrate most of the activity. Whitin infomediary sector, the main subsectors are geographic information (23.0%), market research (22.5%) and economic and financial activities (20.8%).
- Madrid and Catalonia, the favorite locations. The sector is represented in all the Autonomous Communities, except for the Autonomous Cities of Ceuta and Melilla. As happened last year, most of the infomediary companies are concentrated in the community of Madrid (36%) and Cataluña (18%), followed by other communities, such as por Andalucía (8%), Galicia (7%) and the community of Valenciana (7%).
- Turnover increases by almost 2%. According to the annual accounts available in the Mercantile Registry, the sector turn over close to 1,720 million euros in 2016. This figure represents an increase of 1.9%, comparing with the previous year and an average turnover of 2.9 million of euros (although the median is 194,698 euros, due to 15 companies concentrate close to 50% of turnover).
- The number of employees working in infomediary companies remains stable. In 2016, the infomediary companies employed 19,347 personnel, a figure similar to 2015 (19,362). In addition, the average turnover per employee reached 88,822 euros.
- Subscribed capital decreases. At the end of 2017, the subscribed capital, that is, the shares acquired by the shareholders, was 274 million euros, compared to 366 million euros in 2016, which represents a reduction of -25% per year, for the second consecutive year. 83% of the capital is concentrated in 4 subsector: “Market research”, “Geographic Information”, “Economic & Financial” and “Publishing”.
- A sector with benefits. 68% of analyzed companies presented benefits in 2016, which highlights the economic opportunities of information reuse to create value added products and services.
- Big Data and data analysis, the main challenges. Due to the increase in volume and diversity of the data that must be analyzed by infomediary companies, it is not surprising that 55% of the companies surveyed consider Big Data and data analysis as their main challenges.
- Need for greater homogenization in data. The lack of a common database makes users have to go to the different platforms enabled by Autonomous Communities or local authorities. The infomediaries surveyed consider this fact one of the main barriers to the information reuse. In addition, they indicate that they would need more complete, up-to-date and easily accessible information, as well as regulations that will facilitate and encourage reuse.
Although there are still Challenges to be overcome, such as the greater homogenization of the data or the attraction of Big Data talent, the conclusions of the report show us an encouraging future. The majority of respondents (69%) consider that the informadiary sector will have a positive economic growth during the coming years. The increase in the turnover in2016 and the fact that most of the infomediary companies present benefits seem to point in this same direction, positioning the infomediary sector as one of the drivers of the economic growth of our country.
Noticia
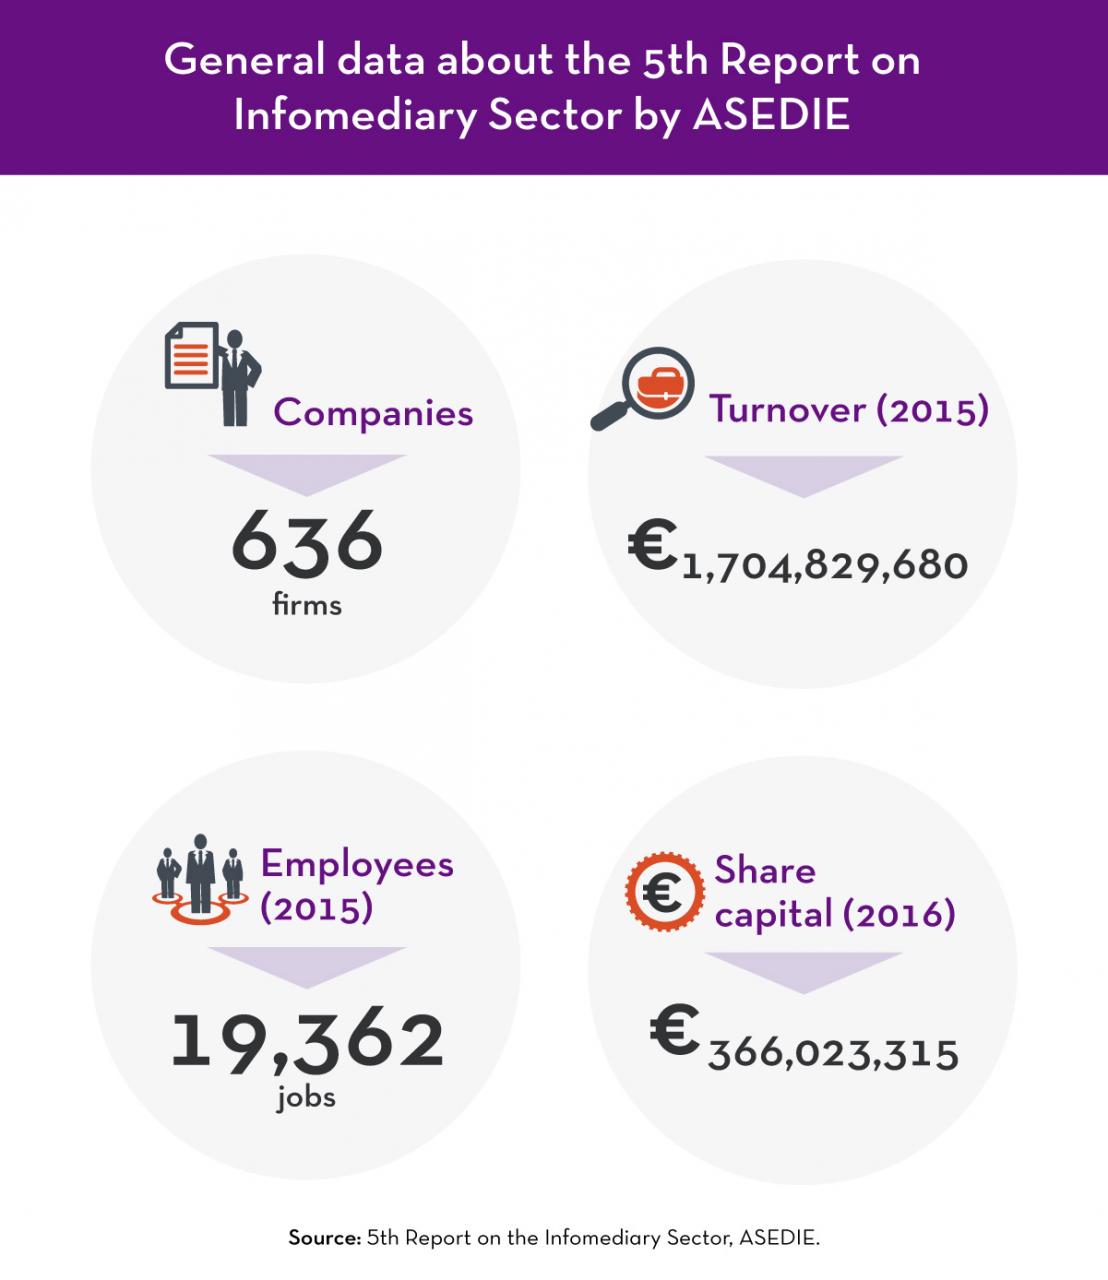
Annually the Multisectorial Information Association (ASEDIE) publishes a report analyzing in detail the national infomediary market. This fifth edition evaluates 636 Spanish companies whose activity is based on the re-use of public and/or private information to develop value-added products for third parties or citizens in general in the following sub-sectors: culture, directory services, economic and financial, publishing, market research, geographic information, meteorological, or tourism. The list has grown this year adding two new sectors: Infomediation technology and technical consulting.
According to the data provided in this last study, as in previous years most of the infomediary companies are located in Madrid (38%) and Catalonia (19%) In addition, the geographic information (24%), market research (23%), and the economic and financial (22%) industries are the most representative areas.
Regarding the total revenues for the year 2015, they increased to €1,705 billion; which means an average turnover of 2.68 million euros per company. An increase in 2015 close to 2% in comparison with the previous year.
In relation to the jobs created, according to the ASEDIE report, the infomediary sector employed 19,362 workers in 2015, a positive variation of 4.3% compared to the previous edition; with the largest growth was recorded in the economic and financial sector, with 219 employees more than in 2014, a similar number to the geographic information industry, with new 215 more employees.
Finally, at the closing of 2016 the total subscribed capital was 366 million euros, 20.7% lower than the previous year, after three consecutive years of growth.
Through this report, ASEDIE provides a detailed view of a growing sector at national level, which, thanks to its horizontal nature, is especially relevant in improving business management and the impact of the opportunities generated, both economically as politically and socially.