Blog
Geospatial data has driven improvements in a number of sectors, and energy is no exception. This data allows us to better understand our environment in order to promote sustainability, innovation and informed decision-making.
One of the main providers of open geospatial data is Copernicus, the European Union's Earth observation programme. Through a network of satellites called Sentinel and data from ground, sea and airborne sources, Copernicus provides geospatial information freely accessible through various platforms.
Although Copernicus data is useful in many areas, such as fighting climate change, urban planning or agriculture, in this article we will focus on its role in driving sustainability and energy efficiency. The availability of high quality open data fosters innovation in this sector by promoting the development of new tools and applications that improve energy management and use. Here are some examples.
Climate prediction to improve production
Geospatial data provide detailed information on weather conditions, air quality and other factors, which are essential for understanding and predicting environmental phenomena, such as storms or droughts, that affect energy production and distribution.
One example is this project which provides high-resolution wind forecasts to serve the oil and gas, aviation, shipping and defence sectors. It uses data from satellite observations and numerical models, including information on ocean currents, waves and sea surface temperature from the "Copernicus Marine Service". Thanks to its granularity, it can provide an accurate weather forecasting system at a very local scale, allowing a higher level of accuracy in the behaviour of extreme weather and climate phenomena.
Optimisation of resources
The data provided by Copernicus also allows the identification of the best locations for the installation of energy generation centres, such as solar and wind farms, by facilitating the analysis of factors such as solar radiation and wind speed. In addition, they help monitor the efficiency of these facilities, ensuring that they are operating at maximum capacity.
In this regard, a project has been developed to find the best site for a combined floating wind and wave energy system (i.e. based on wave motion). By obtaining both energies with a single platform, this solution saves space and reduces the impact on the ground, while improving efficiency. Wind and waves arrive at different times at the platform, so capturing both elements helps reduce variability and smoothes overall electricity production. Thanks to the Copernicus data (obtained from the Atlantic Service - Biscay Iberia Ireland - Ocean Wave Reanalysis), the provider of this situation was able to obtain separate components of wind and wave waves, which allowed a more complete understanding of the directionality of both elements. This work led to the selection of Biscay Marine Energy Platform (BiMEP). for the deployment of the device.
Another example is Mon Toit Solaire, an integrated web-based decision support system for the development of rooftop photovoltaic power generation. This tool simulates and calculates the energy potential of a PV project and provides users with reliable technical and financial information. It uses solar radiation data produced by the "Copernicus Atmospheric Monitoring Service", together with three-dimensional urban topographic data and simulations of tax incentives, energy costs and prices, allowing the return on investment to be calculated.
Environmental monitoring and impact assessment.
Geospatial information allows for improved environmental monitoring and accurate impact assessments in the energy sector. This data allows energy companies to identify environmental risks associated with their operations, design strategies to mitigate their impact and optimise their processes towards greater sustainability. In addition, they support environmental compliance by providing objective data-driven reporting, encouraging more responsible and environmentally friendly energy development.
Among the challenges posed by the conservation of ocean biodiversity, man-made underwater noise is recognised as a serious threat and is regulated at European level. In order to assess the impact on marine life of wind farms along the southern coast of France, this project uses high-resolution statistical sound maps, which provide a detailed view of coastal processes, with an hourly time frequency and a high spatial resolution of up to 1.8 km. In particular, they use information from the "Mediterranean Sea Physics Analysis and Forecasting" and "World Ocean Hourly Sea Surface Wind and Stress" services.
Emergency and environmental disaster management.
In disaster situations or extreme weather events, geospatial data can help quickly assess damage and coordinate emergency responses more efficiently.
They can also predict how spills will behave. This is the aim of the Marine Research Institute of the University of Klaipeda, which has developed a system for monitoring and forecasting chemical and microbiological pollution episodes using a high-resolution 3D operational hydrodynamic model. They use the Copernicus "Physical Analysis and Forecasts of the Baltic Sea". The model provides real-time, five-day forecasts of water currents, addressing the challenges posed by shallow waters and port areas. It aims to help manage pollution incidents, particularly in pollution-prone regions such as ports and oil terminals.
These examples highlight the usefulness of geospatial data, especially those provided by programmes such as Copernicus. The fact that companies and institutions can freely access this data is revolutionising the energy sector, contributing to a more efficient, sustainable and resilient system.
Application
Tupreciodeluz.com offers daily information on the price of electricity, showing the cheapest price of the day, as well as the average price of the last 24 hours and the most expensive time slot. The aim is to allow consumers adhering to the regulated market tariff (PVPC) to modulate their consumption in order to save on their electricity bill.
The website also features an artificial intelligence assistant for energy advice, and measures to promote efficiency and responsible energy consumption.
In addition, consumers can use a solar sizer to find out the feasibility of installing solar energy in their home or business.
The website also has a blog where the most relevant news for consumers is published in a summarised and entertaining way.
Blog
A digital twin is a virtual, interactive representation of a real-world object, system or process. We are talking, for example, about a digital replica of a factory, a city or even a human body. These virtual models allow simulating, analysing and predicting the behaviour of the original element, which is key for optimisation and maintenance in real time.
Due to their functionalities, digital twins are being used in various sectors such as health, transport or agriculture. In this article, we review the benefits of their use and show two examples related to open data.
Advantages of digital twins
Digital twins use real data sources from the environment, obtained through sensors and open platforms, among others. As a result, the digital twins are updated in real time to reflect reality, which brings a number of advantages:
- Increased performance: one of the main differences with traditional simulations is that digital twins use real-time data for modelling, allowing better decisions to be made to optimise equipment and system performance according to the needs of the moment.
- Improved planning: using technologies based on artificial intelligence (AI) and machine learning, the digital twin can analyse performance issues or perform virtual "what-if" simulations. In this way, failures and problems can be predicted before they occur, enabling proactive maintenance.
- Cost reduction: improved data management thanks to a digital twin generates benefits equivalent to 25% of total infrastructure expenditure. In addition, by avoiding costly failures and optimizing processes, operating costs can be significantly reduced. They also enable remote monitoring and control of systems from anywhere, improving efficiency by centralizing operations.
- Customization and flexibility: by creating detailed virtual models of products or processes, organizations can quickly adapt their operations to meet changing environmental demands and individual customer/citizen preferences. For example, in manufacturing, digital twins enable customized mass production, adjusting production lines in real time to create unique products according to customer specifications. On the other hand, in healthcare, digital twins can model the human body to customize medical treatments, thereby improving efficacy and reducing side effects.
- Boosting experimentation and innovation: digital twins provide a safe and controlled environment for testing new ideas and solutions, without the risks and costs associated with physical experiments. Among other issues, they allow experimentation with large objects or projects that, due to their size, do not usually lend themselves to real-life experimentation.
- Improved sustainability: by enabling simulation and detailed analysis of processes and systems, organizations can identify areas of inefficiency and waste, thus optimizing the use of resources. For example, digital twins can model energy consumption and production in real time, enabling precise adjustments that reduce consumption and carbon emissions.
Examples of digital twins in Spain
The following three examples illustrate these advantages.
GeDIA project: artificial intelligence to predict changes in territories
GeDIA is a tool for strategic planning of smart cities, which allows scenario simulations. It uses artificial intelligence models based on existing data sources and tools in the territory.
The scope of the tool is very broad, but its creators highlight two use cases:
- Future infrastructure needs: the platform performs detailed analyses considering trends, thanks to artificial intelligence models. In this way, growth projections can be made and the needs for infrastructures and services, such as energy and water, can be planned in specific areas of a territory, guaranteeing their availability.
- Growth and tourism: GeDIA is also used to study and analyse urban and tourism growth in specific areas. The tool identifies patterns of gentrification and assesses their impact on the local population, using census data. In this way, demographic changes and their impact, such as housing needs, can be better understood and decisions can be made to facilitate equitable and sustainable growth.
This initiative has the participation of various companies and the University of Malaga (UMA), as well as the financial backing of Red.es and the European Union.
Digital twin of the Mar Menor: data to protect the environment
The Mar Menor, the salt lagoon of the Region of Murcia, has suffered serious ecological problems in recent years, influenced by agricultural pressure, tourism and urbanisation.
To better understand the causes and assess possible solutions, TRAGSATEC, a state-owned environmental protection agency, developed a digital twin. It mapped a surrounding area of more than 1,600 square kilometres, known as the Campo de Cartagena Region. In total, 51,000 nadir images, 200,000 oblique images and more than four terabytes of LiDAR data were obtained.
Thanks to this digital twin, TRAGSATEC has been able to simulate various flooding scenarios and the impact of installing containment elements or obstacles, such as a wall, to redirect the flow of water. They have also been able to study the distance between the soil and the groundwater, to determine the impact of fertiliser seepage, among other issues.
Challenges and the way forward
These are just two examples, but they highlight the potential of an increasingly popular technology. However, for its implementation to be even greater, some challenges need to be addressed, such as initial costs, both in technology and training, or security, by increasing the attack surface. Another challenge is the interoperability problems that arise when different public administrations establish digital twins and local data spaces. To address this issue further, the European Commission has published a guide that helps to identify the main organisational and cultural challenges to interoperability, offering good practices to overcome them.
In short, digital twins offer numerous advantages, such as improved performance or cost reduction. These benefits are driving their adoption in various industries and it is likely that, as current challenges are overcome, digital twins will become an essential tool for optimising processes and improving operational efficiency in an increasingly digitised world.
Documentación
1. Introduction
In the information age, artificial intelligence has proven to be an invaluable tool for a variety of applications. One of the most incredible manifestations of this technology is GPT (Generative Pre-trained Transformer), developed by OpenAI. GPT is a natural language model that can understand and generate text, providing coherent and contextually relevant responses. With the recent introduction of Chat GPT-4, the capabilities of this model have been further expanded, allowing for greater customisation and adaptability to different themes.
In this post, we will show you how to set up and customise a specialised critical minerals wizard using GPT-4 and open data sources. As we have shown in previous publications critical minerals are fundamental to numerous industries, including technology, energy and defence, due to their unique properties and strategic importance. However, information on these materials can be complex and scattered, making a specialised assistant particularly useful.
The aim of this post is to guide you step by step from the initial configuration to the implementation of a GPT wizard that can help you to solve doubts and provide valuable information about critical minerals in your day to day life. In addition, we will explore how to customise aspects of the assistant, such as the tone and style of responses, to perfectly suit your needs. At the end of this journey, you will have a powerful, customised tool that will transform the way you access and use critical open mineral information.
Access the data lab repository on Github.
2. Context
The transition to a sustainable future involves not only changes in energy sources, but also in the material resources we use. The success of sectors such as energy storage batteries, wind turbines, solar panels, electrolysers, drones, robots, data transmission networks, electronic devices or space satellites depends heavily on access to the raw materials critical to their development. We understand that a mineral is critical when the following factors are met:
- Its global reserves are scarce
- There are no alternative materials that can perform their function (their properties are unique or very unique)
- They are indispensable materials for key economic sectors of the future, and/or their supply chain is high risk
You can learn more about critical minerals in the post mentioned above.
3. Target
This exercise focuses on showing the reader how to customise a specialised GPT model for a specific use case. We will adopt a "learning-by-doing" approach, so that the reader can understand how to set up and adjust the model to solve a real and relevant problem, such as critical mineral expert advice. This hands-on approach not only improves understanding of language model customisation techniques, but also prepares readers to apply this knowledge to real-world problem solving, providing a rich learning experience directly applicable to their own projects.
The GPT assistant specialised in critical minerals will be designed to become an essential tool for professionals, researchers and students. Its main objective will be to facilitate access to accurate and up-to-date information on these materials, to support strategic decision-making and to promote education in this field. The following are the specific objectives we seek to achieve with this assistant:
- Provide accurate and up-to-date information:
- The assistant should provide detailed and accurate information on various critical minerals, including their composition, properties, industrial uses and availability.
- Keep up to date with the latest research and market trends in the field of critical minerals.
- Assist in decision-making:
- To provide data and analysis that can assist strategic decision making in industry and critical minerals research.
- Provide comparisons and evaluations of different minerals in terms of performance, cost and availability.
- Promote education and awareness of the issue:
- Act as an educational tool for students, researchers and practitioners, helping to improve their knowledge of critical minerals.
- Raise awareness of the importance of these materials and the challenges related to their supply and sustainability.
4. Resources
To configure and customise our GPT wizard specialising in critical minerals, it is essential to have a number of resources to facilitate implementation and ensure the accuracy and relevance of the model''s responses. In this section, we will detail the necessary resources that include both the technological tools and the sources of information that will be integrated into the assistant''s knowledge base.
Tools and Technologies
The key tools and technologies to develop this exercise are:
- OpenAI account: required to access the platform and use the GPT-4 model. In this post, we will use ChatGPT''s Plus subscription to show you how to create and publish a custom GPT. However, you can develop this exercise in a similar way by using a free OpenAI account and performing the same set of instructions through a standard ChatGPT conversation.
- Microsoft Excel: we have designed this exercise so that anyone without technical knowledge can work through it from start to finish. We will only use office tools such as Microsoft Excel to make some adjustments to the downloaded data.
In a complementary way, we will use another set of tools that will allow us to automate some actions without their use being strictly necessary:
- Google Colab: is a Python Notebooks environment that runs in the cloud, allowing users to write and run Python code directly in the browser. Google Colab is particularly useful for machine learning, data analysis and experimentation with language models, offering free access to powerful computational resources and facilitating collaboration and project sharing.
- Markmap: is a tool that visualises Markdown mind maps in real time. Users write ideas in Markdown and the tool renders them as an interactive mind map in the browser. Markmap is useful for project planning, note taking and organising complex information visually. It facilitates understanding and the exchange of ideas in teams and presentations.
Sources of information
- Raw Materials Information System (RMIS): raw materials information system maintained by the Joint Research Center of the European Union. It provides detailed and up-to-date data on the availability, production and consumption of raw materials in Europe.
- International Energy Agency (IEA) Catalogue of Reports and Data: the International Energy Agency (IEA) offers a comprehensive catalogue of energy-related reports and data, including statistics on production, consumption and reserves of energy and critical minerals.
- Mineral Database of the Spanish Geological and Mining Institute (BDMIN in its acronym in Spanish): contains detailed information on minerals and mineral deposits in Spain, useful to obtain specific data on the production and reserves of critical minerals in the country.
With these resources, you will be well equipped to develop a specialised GPT assistant that can provide accurate and relevant answers on critical minerals, facilitating informed decision-making in the field.
5. Development of the exercise
5.1. Building the knowledge base
For our specialised critical minerals GPT assistant to be truly useful and accurate, it is essential to build a solid and structured knowledge base. This knowledge base will be the set of data and information that the assistant will use to answer queries. The quality and relevance of this information will determine the effectiveness of the assistant in providing accurate and useful answers.
Search for Data Sources
We start with the collection of information sources that will feed our knowledge base. Not all sources of information are equally reliable. It is essential to assess the quality of the sources identified, ensuring that:
- Information is up to date: the relevance of data can change rapidly, especially in dynamic fields such as critical minerals.
- The source is reliable and recognised: it is necessary to use sources from recognised and respected academic and professional institutions.
- Data is complete and accessible: it is crucial that data is detailed and accessible for integration into our wizard.
In our case, we developed an online search in different platforms and information repositories trying to select information belonging to different recognised entities:
- Research centres and universities:
- They publish detailed studies and reports on the research and development of critical minerals.
- Example: RMIS of the Joint Research Center of the European Union.
- Governmental institutions and international organisations:
- These entities usually provide comprehensive and up-to-date data on the availability and use of critical minerals.
- Example: International Energy Agency (IEA).
- Specialised databases:
- They contain technical and specific data on deposits and production of critical minerals.
- Example: Minerals Database of the Spanish Geological and Mining Institute (BDMIN).
Selection and preparation of information
We will now focus on the selection and preparation of existing information from these sources to ensure that our GPT assistant can access accurate and useful data.
RMIS of the Joint Research Center of the European Union:
- Selected information:
We selected the report "Supply chain analysis and material demand forecast in strategic technologies and sectors in the EU - A foresight study". This is an analysis of the supply chain and demand for minerals in strategic technologies and sectors in the EU. It presents a detailed study of the supply chains of critical raw materials and forecasts the demand for minerals up to 2050.
- Necessary preparation:
The format of the document, PDF, allows the direct ingestion of the information by our assistant. However, as can be seen in Figure 1, there is a particularly relevant table on pages 238-240 which analyses, for each mineral, its supply risk, typology (strategic, critical or non-critical) and the key technologies that employ it. We therefore decided to extract this table into a structured format (CSV), so that we have two pieces of information that will become part of our knowledge base.

Figure 1: Table of minerals contained in the JRC PDF
To programmatically extract the data contained in this table and transform it into a more easily processable format, such as CSV(comma separated values), we will use a Python script that we can use through the platform Google Colab platform (Figure 2).

Figure 2: Script Python para la extracción de datos del PDF de JRC desarrollado en plataforma Google Colab.
To summarise, this script:
- It is based on the open source library PyPDF2capable of interpreting information contained in PDF files.
- First, it extracts in text format (string) the content of the pages of the PDF where the mineral table is located, removing all the content that does not correspond to the table itself.
- It then goes through the string line by line, converting the values into columns of a data table. We will know that a mineral is used in a key technology if in the corresponding column of that mineral we find a number 1 (otherwise it will contain a 0).
- Finally, it exports the table to a CSV file for further use.
International Energy Agency (IEA):
- Selected information:
We selected the report "Global Critical Minerals Outlook 2024". It provides an overview of industrial developments in 2023 and early 2024, and offers medium- and long-term prospects for the demand and supply of key minerals for the energy transition. It also assesses risks to the reliability, sustainability and diversity of critical mineral supply chains.
- Necessary preparation:
The format of the document, PDF, allows us to ingest the information directly by our virtual assistant. In this case, we will not make any adjustments to the selected information.
Spanish Geological and Mining Institute''s Minerals Database (BDMIN)
- Selected information:
In this case, we use the form to select the existing data in this database for indications and deposits in the field of metallogeny, in particular those with lithium content.
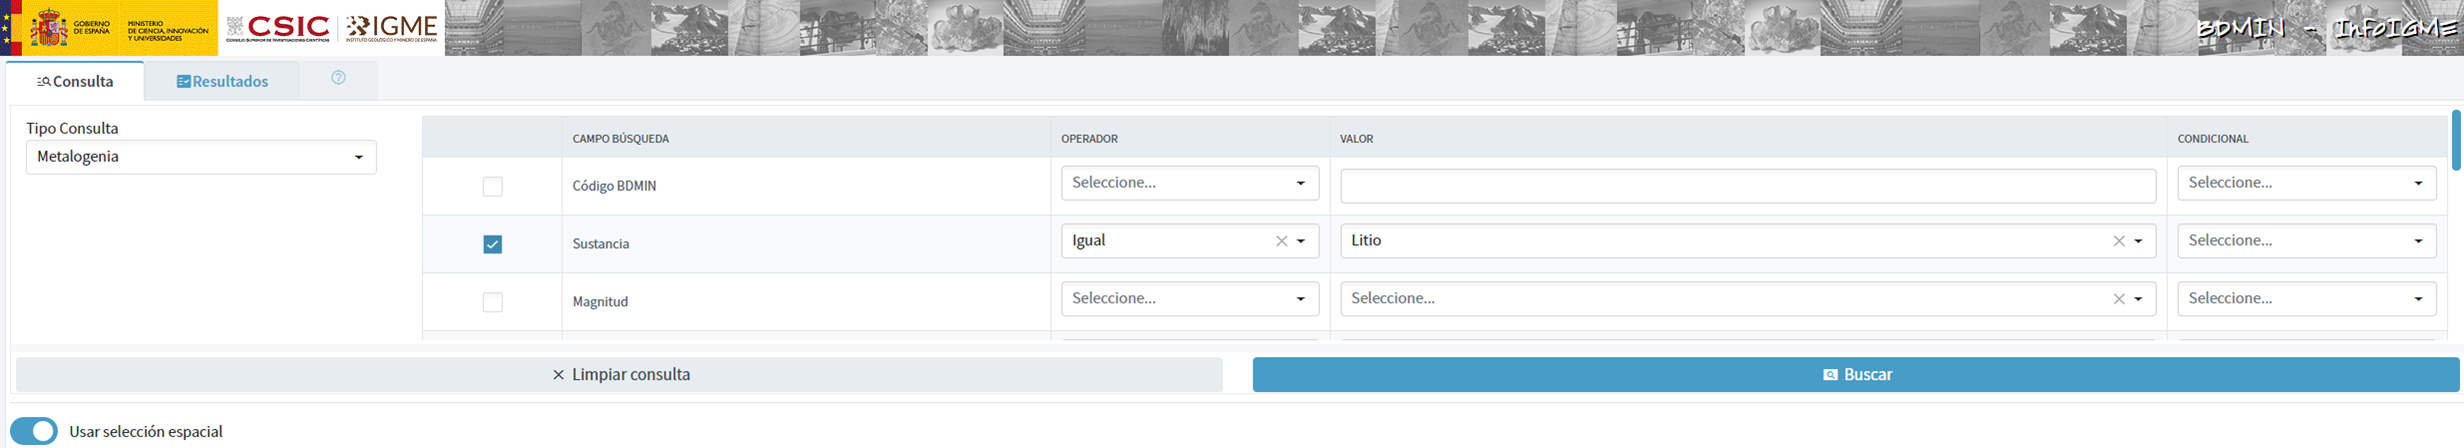
Figure 3: Dataset selection in BDMIN.
- Necessary preparation:
We note how the web tool allows online visualisation and also the export of this data in various formats. Select all the data to be exported and click on this option to download an Excel file with the desired information.

Figure 4: Visualization and download tool in BDMIN

Figure 5: BDMIN Downloaded Data.
All the files that make up our knowledge base can be found at GitHub, so that the reader can skip the downloading and preparation phase of the information.
5.2. GPT configuration and customisation for critical minerals
When we talk about "creating a GPT," we are actually referring to the configuration and customisation of a GPT (Generative Pre-trained Transformer) based language model to suit a specific use case. In this context, we are not creating the model from scratch, but adjusting how the pre-existing model (such as OpenAI''s GPT-4) interacts and responds within a specific domain, in this case, on critical minerals.
First of all, we access the application through our browser and, if we do not have an account, we follow the registration and login process on the ChatGPT platform. As mentioned above, in order to create a GPT step-by-step, you will need to have a Plus account. However, readers who do not have such an account can work with a free account by interacting with ChatGPT through a standard conversation.
Figure 6: ChatGPT login and registration page.
Once logged in, select the "Explore GPT" option, and then click on "Create" to begin the process of creating your GPT.

Figure 7: Creation of new GPT.
The screen will display the split screen for creating a new GPT: on the left, we will be able to talk to the system to indicate the characteristics that our GPT should have, while on the left we will be able to interact with our GPT to validate that its behaviour is adequate as we go through the configuration process.

Figure 8: Screen of creating new GPT.
In the GitHub of this project, we can find all the prompts or instructions that we will use to configure and customise our GPT and that we will have to introduce sequentially in the "Create" tab, located on the left tab of our screens, to complete the steps detailed below.
The steps we will follow for the creation of the GPT are as follows:
- First, we will outline the purpose and basic considerations for our GPT so that you can understand how to use it.
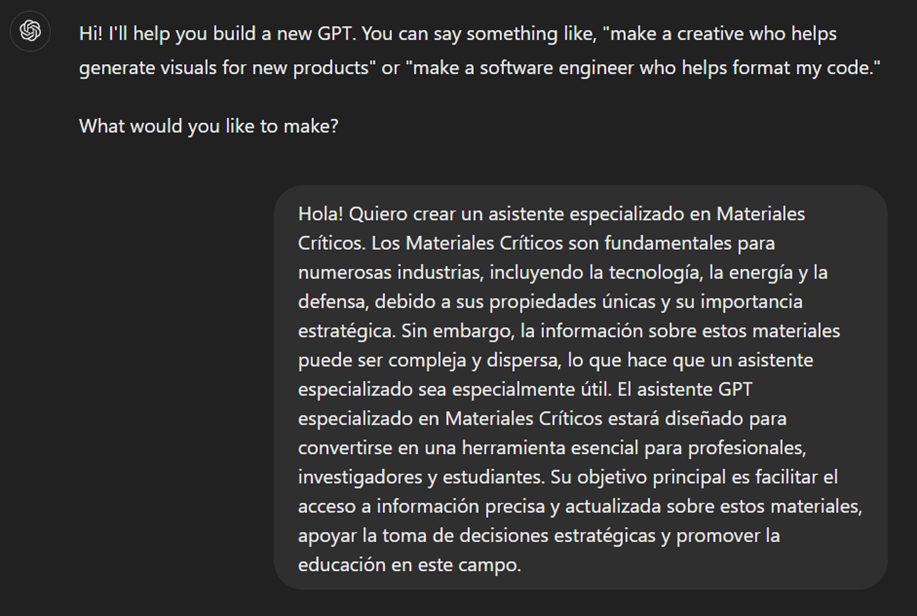
Figure 9: Basic instructions for new GPT.
2. We will then create a name and an image to represent our GPT and make it easily identifiable. In our case, we will call it MateriaGuru.

Figure 10: Name selection for new GPT.

Figure 11: Image creation for GPT.
3.We will then build the knowledge base from the information previously selected and prepared to feed the knowledge of our GPT.


Figure 12: Uploading of information to the new GPT knowledge base.
4. Now, we can customise conversational aspects such as their tone, the level of technical complexity of their response or whether we expect brief or elaborate answers.
5. Lastly, from the "Configure" tab, we can indicate the conversation starters desired so that users interacting with our GPT have some ideas to start the conversation in a predefined way.

Figure 13: Configure GPT tab.
In Figure 13 we can also see the final result of our training, where key elements such as their image, name, instructions, conversation starters or documents that are part of their knowledge base appear.
5.3. Validation and publication of GPT
Before we sign off our new GPT-based assistant, we will proceed with a brief validation of its correct configuration and learning with respect to the subject matter around which we have trained it. For this purpose, we prepared a battery of questions that we will ask MateriaGuru to check that it responds appropriately to a real scenario of use.
| # | Question | Answer |
|---|---|---|
| 1 | Which critical minerals have experienced a significant drop in prices in 2023? | Battery mineral prices saw particularly large drops with lithium prices falling by 75% and cobalt, nickel and graphite prices falling by between 30% and 45%. |
| 2 | What percentage of global solar photovoltaic (PV) capacity was added by China in 2023? | China accounted for 62% of the increase in global solar PV capacity in 2023. |
| 3 | What is the scenario that projects electric car (EV) sales to reach 65% by 2030? | The Net Zero Emissions (NZE) scenario for 2050 projects that electric car sales will reach 65% by 2030. |
| 4 | What was the growth in lithium demand in 2023? | Lithium demand increased by 30% in 2023. |
| 5 | Which country was the largest electric car market in 2023? | China was the largest electric car market in 2023 with 8.1 million electric car sales representing 60% of the global total. |
| 6 | What is the main risk associated with market concentration in the battery graphite supply chain? | More than 90% of battery-grade graphite and 77% of refined rare earths in 2030 originate in China, posing a significant risk to market concentration. |
| 7 | What proportion of global battery cell production capacity was in China in 2023? | China owned 85% of battery cell production capacity in 2023. |
| 8 | How much did investment in critical minerals mining increase in 2023? | Investment in critical minerals mining grew by 10% in 2023. |
| 9 | What percentage of battery storage capacity in 2023 was composed of lithium iron phosphate (LFP) batteries? | By 2023, LFP batteries would constitute approximately 80% of the total battery storage market. |
| 10 | What is the forecast for copper demand in a net zero emissions (NZE) scenario for 2040? | In the net zero emissions (NZE) scenario for 2040, copper demand is expected to have the largest increase in terms of production volume. |
Figure 14: Table with battery of questions for the validation of our GPT.
Using the preview section on the right-hand side of our screens, we launch the battery of questions and validate that the answers correspond to those expected.
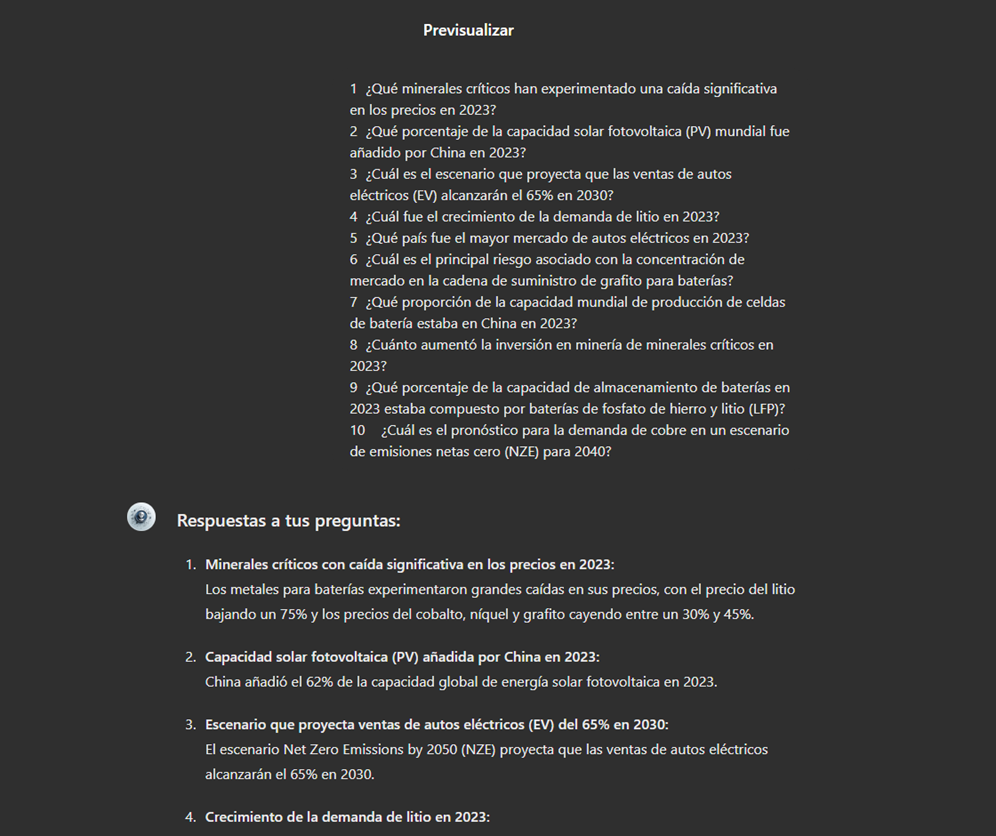
Figure 15: Validation of GPT responses.
Finally, click on the "Create" button to finalise the process. We will be able to select between different alternatives to restrict its use by other users.

Figure 16: Publication of our GPT.
6. Scenarios of use
In this section we show several scenarios in which we can take advantage of MateriaGuru in our daily life. On the GitHub of the project you can find the prompts used to replicate each of them.
6.1. Consultation of critical minerals information
The most typical scenario for the use of this type of GPTs is assistance in resolving doubts related to the topic in question, in this case, critical minerals. As an example, we have prepared a set of questions that the reader can pose to the GPT created to understand in more detail the relevance and current status of a critical material such as graphite from the reports provided to our GPT.

Figure 17: Resolution of critical mineral queries.
We can also ask you specific questions about the tabulated information provided on existing sites and evidence on Spanish territory.
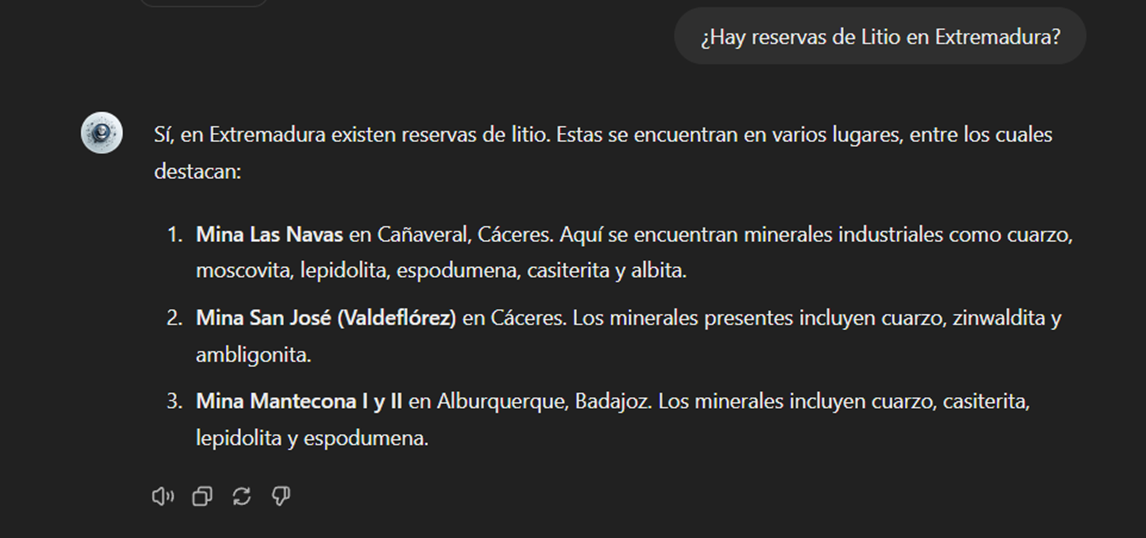
Figure 18: Lithium reserves in Extremadura.
6.2. Representation of quantitative data visualisations
Another common scenario is the need to consult quantitative information and make visual representations for better understanding. In this scenario, we can see how MateriaGuru is able to generate an interactive visualisation of graphite production in tonnes for the main producing countries.

Figure 19: Interactive visualisation generation with our GPT.
6.3. Generating mind maps to facilitate understanding
Finally, in line with the search for alternatives for a better access and understanding of the existing knowledge in our GPT, we will propose to MateriaGuru the construction of a mind map that allows us to understand in a visual way key concepts of critical minerals. For this purpose, we use the open Markmap notation (Markdown Mindmap), which allows us to define mind maps using markdown notation.

Figure 20: Generation of mind maps from our GPT
We will need to copy the generated code and enter it in a markmapviewer in order to generate the desired mind map. We facilitate here a version of this code generated by MateriaGuru.

Figure 21: Visualisation of mind maps.
7. Results and conclusions
In the exercise of building an expert assistant using GPT-4, we have succeeded in creating a specialised model for critical minerals. This wizard provides detailed and up-to-date information on critical minerals, supporting strategic decision making and promoting education in this field. We first gathered information from reliable sources such as the RMIS, the International Energy Agency (IEA), and the Spanish Geological and Mining Institute (BDMIN). We then process and structure the data appropriately for integration into the model. Validations showed that the wizard accurately answers domain-relevant questions, facilitating access to your information.
In this way, the development of the specialised critical minerals assistant has proven to be an effective solution for centralising and facilitating access to complex and dispersed information.
The use of tools such as Google Colab and Markmap has enabled better organisation and visualisation of data, increasing efficiency in knowledge management. This approach not only improves the understanding and use of critical mineral information, but also prepares users to apply this knowledge in real-world contexts.
The practical experience gained in this exercise is directly applicable to other projects that require customisation of language models for specific use cases.
8. Do you want to do the exercise?
If you want to replicate this exercise, access this this repository where you will find more information (the prompts used, the code generated by MateriaGuru, etc.)
Also, remember that you have at your disposal more exercises in the section "Step-by-step visualisations".
Content elaborated by Juan Benavente, industrial engineer and expert in technologies linked to the data economy. The contents and points of view reflected in this publication are the sole responsibility of the author.
Blog
The National Centre for Geographic Information publishes open geospatial data from the National Cartographic System, the National Geographic Institute and other organisations through web applications and mobile applications to facilitate access to and consultation of geographic data by citizens.
Geospatial data is published via web services and APIs for reuse, so in the case of high-value datasets, it can be used in a variety of ways high-value datasets such as geographic names, hydrography or addresses as required by the as required by the EUthe EU has already made these datasets available to the public by June 2024 as they are associated with major benefits for society, the environment and the economy.
But in the applications listed below, the geographic data are visualised and consulted through web services, so that for downloading the data, it is possible to use web services and APIs directly, through a platform accessible to any user with a wide range of geographic information, ranging from topographic maps to satellite images.
But not only data can be reused, also application software is reusable, for example, the Solar Energy Potential of Buildings visualiser which is based on a visualiser API, named API-CNIG and allows the same tool to be used for different thematic areas.
Some examples of applications are:

Solar Energy Potential of Buildings
Provides the photovoltaic capacity of a building according to its location and characteristics. It also provides the average over the year and a point grid to identify the best location for solar panels.
National Geographic Gazetteer
It is a toponym search engine that collects the names, official or standardised by the corresponding competent bodies , with geographical references.
Unified postal address calculator
It is a converter that allows to know the geographical coordinates (latitude and longitude in WGS84) of the postal addresses of a place, and vice versa. In both cases, the input file is a CSV file, supporting both coordinates and postal addresses.
Basic Maps of Spain
It facilitates connection to IGN services and to the CNIG download centre to obtain maps and routes. With this mobile application you can follow the routes of the National Parks or the stages of the Camino de Santiago. It allows you to plan excursions using maps, navigate and take guided tours, without the need for an internet connection after downloading data.
Map a la carte
It allows you to create a customised map using the printed series of the National Topographic Map at scales 1:25.000 and 1:50.000. It offers the possibility of defining its area, incorporating contents, personalising the cover, obtaining a pdf file and even acquiring paper copies by post.
IGN Earthquakes
It allows the reception and visualisation of all seismic events in Spain and its surroundings. It provides the distance to the epicentre of the seismic event and epicentral parameters, as well as the geolocation of the user's position and the epicentre.
Maps of Spain
It is a free mobile viewer ideal for hiking, cycling, running, skiing, etc., which uses as background cartography the services of the National Geographic Institute and another set of services from other Ministries, such as the Cadastral information of the plots provided by the General Directorate of Cadastre.
Camino de Santiago
It includes information of a cultural and practical nature on each of the stages (hostels, monuments, etc.), as well as a complete Pilgrim's Guide detailing what you should know before starting out on any of the routes. This application is based on ESRI software.
National Parks
Displays information on the history, fauna, flora and excursions in Spain's National Parks. It includes hundreds of points of interest such as information centres, accommodation, viewpoints, refuges and even routes through the parks, indicating their duration and difficulty. The app is available for download on Android e iOS. This application is based on ESRI software.
GeoSapiens IGN
It presents interactive maps, free to use and free of charge, to study the physical and political geography of Spain and the world. It consists of different games relating to the whole of Spain or by autonomous communities, the whole world and by continent.
In addition to the applications developed by the CNIG, which are also presented in this video this videothere are many other digital solutions developed by third parties that reuse open geospatial data to offer a service to society. For example, in the list of data reusing applications.gob.es you can find from a map that shows the fires that are active in Spain in real time in Spain in real time to an app that shows where the parking spaces for people with reduced mobility parking spaces for people with reduced mobility in each town.
In short, anyone can make use of the open geographic data of the National Cartographic System, the National Geographic Institute and other bodies published by the CNIG , thus extending the advantages offered by the availability of open geographic data. do you know of any other application resulting from the reuse of open data? You can send it to us at dinamizacion@datos.gob.es
Blog
The promotion of energy efficiency and sustainability is one of the priorities of the European Union and Spain, as reflected in the European Green Pact. The availability of open data related to energy production, distribution and consumption allows governments, businesses and citizens to access essential information to address the challenges of climate change and promote a more sustainable future.
In this post, we explore examples of use cases that show the impact of open data on the energy landscape, as well as sources of interest where to find quality data on the subject.
Open data use cases in the energy sector
EUR 79,600 million. This is the estimated annual savings from open data in the energy sector in the European Union, according to the report "The Economic Impact of Open Data: Opportunities for Value Creation in Europe (2020)". This is possible thanks to multiple projects and applications based on open data that affect various areas.
-
More efficient resource planning
Access to open data on available energy resources makes it possible to identify the most suitable areas to develop projects, ensuring that the use of available natural resources is maximised. For example, in the Baltic Sea, natural gas infrastructure is being expanded to meet the region's growing needs. By taking advantage of Copernicus' advanced data together with its own monitoring and forecasting services (including data on wind, waves, sea water level, currents, sea ice, etc.), the Estonian and Finnish governments were able to carry out more efficient planning for the installation of a new plant.
Likewise, the National Geographic Institute has made available to users a viewer to find out the incidence of the sun and determine the best location for solar panels. Thanks to this viewer, different locations and orientations can be analysed to identify the position that maximises solar energy collection.
-
More responsible and efficient consumption
Open data also includes information on the use and performance of different energies. The Junta de Castilla y León, for example, has a dataHub that collects information from more than 1,500 consumer centres. This dashboard allows the analysis by type of energy (electricity, gas, diesel) and by geographical location (educational centres, health centres, administrative offices, hospitals, etc.). This allows them to compare consumption between the buildings they manage and make efficiency decisions, which has resulted in savings of €2M per year since 2015 on the fixed cost of electricity alone.
The Urban3r viewer allows the visualisation of different indicators on the current state of the building, the energy demand data of residential buildings in their current state and after energy refurbishment, as well as the estimated costs of these interventions, facilitating decision making.
Commercial solutions are also available on the market for this purpose, such as Opower, a tool that uses artificial intelligence to provide personalised information to each customer, identifying and suggesting the replacement of inefficient heating and cooling systems. Another example is uplight, which performs energy efficiency analyses for commercial buildings, utilities and government entities with operational and retrofit recommendations to reduce consumption. These examples highlight the business opportunity in this niche market.
-
Possibility to choose cheaper suppliers
Open data provides detailed information on tariffs and prices of different energy suppliers. This transparency allows consumers to easily compare offers and choose the option that best suits their needs. This is the case of applications for choosing petrol stations, such as Mejorgasolinera.com or Precioil.es, which offer detailed information on the country's petrol stations and allow filtering by brand, location or road and sorted by price and distance. We also find similar solutions for the electricity market, such as Tarifaluzhora.
The National Commission for Markets and Competition (CNMC in Spanish) also has a Energy Offers Comparator (CNMC), which allows you to consult gas and electricity offers.
-
Transparency, accountability and harm minimisation
The publication of open data not only allows citizens and organisations to access detailed information on energy production, distribution and consumption. It also increases transparency in resource management and promotes accountability of energy companies and governments.
To this end, OpenOil was born, which aims to reduce the opacity of the oil industry and thereby increase the accountability of oil companies. It provides an open data framework for natural resource management at the supranational level, as well as consultancy and training services for the creation of natural resource management mechanisms and processes.
In order to minimise the impact of oil spills in the oceans, the Spanish National Research Council (CSIC), in collaboration with Digital Earth Solutions (DES), has developed a unique software, capable of predicting in a few minutes and with great precision the geographic evolution of any oil slick, forecasting its future trajectory in the ocean or studying its movement backwards in time to find its origin.
Where can I find energy data?
If you are thinking of developing such a solution, you are in luck, because there is a wealth of open energy data available on the web.
If you are looking for data from Spain, in addition to datos.gob.es, you can visit the following websites:
- Institute for Energy Diversification and Saving (IDAE). IDAE provides sectorised statistics and energy balances for both primary and final energy, in thousands of tonnes of oil equivalent (ktoe). In total, 69 energy types and 128 energy flows and/or sectors are detailed. The data currently available cover the historical series from 1990 to 2022.
- Red Eléctrica de España. REData is the website of Red eléctrica where we can find national statistical series related to the Spanish electricity system, updated month by month. In this space you can also access information on demand, generation, balancing, exchange, transmission and electricity markets, whose data are available through a REST API. Depending on the nature of the dataset, we can find data that are updated annually, quarterly or even daily. Another useful tool of Red Eléctrica is ESIOS, with updated data on generation, consumption, market, prices, etc.
- National Commission for Markets and Competition (CNMC): The CNMC Data open data portal provides direct access to data and indicators relating to the energy markets overseen by the CNMC: electricity, natural gas and oil products. We can find statistics on market prices, the number of users benefiting from the social bonus or the percentage of renewable energy in the total amount, among other values. Data are updated regularly, on a monthly, quarterly or annual basis.
A wealth of information is also available worldwide:
- European Union. On the EU's energy policy website, we find various data and analyses ranging from oil price developments in individual member states to possible energy market scenarios for 2030 and 2050, among many others. In addition, the European Commission's Directorate-General for Energy produces energy statistical fact sheets every two years, based on data from Eurostat and EU greenhouse gas monitoring. The data is broken down by country, which allows for easy comparisons. Also available is the ENSPRESO database, which focuses on the wind, solar and biomass sectors.
- International Energy Agency (IEA). IEA is an international organisation created in 1974 by the Organisation for Economic Co-operation and Development (OECD) to secure energy supplies. Although some of the datasets offered are paid for, open data can also be found on the website and can be downloaded upon registration.
- Other countries: At the international level, we can find detailed portals by country, such as the US Open Energy Data Initiative (OEDI) or the UK.
These are just a few examples of solutions and data sources that highlight the impact that opening up energy data can have on our environment, both in terms of cost savings and efficiency gains. We invite you to share other open data solutions and portals in comments.
Blog
The carbon footprint is a key indicator for understanding the environmental impact of our actions. It measures the amount of greenhouse gas emissions released into the atmosphere as a result of human activities, most notably the burning of fossil fuels such as oil, natural gas and coal. These gases, which include carbon dioxide (CO2), methane (CH4) and nitrous oxide (N2O), contribute to global warming by trapping heat in the earth's atmosphere.
Many actions are being carried out by different organisations to try to reduce the carbon footprint. These include those included in the European Green Pact or the Sustainable Development Goals. But this is an area where every small action counts and, as citizens, we can also contribute to this goal through small changes in our lifestyles.
Moreover, this is an area where open data can have a major impact. In particular, the report "The economic impact of open data: opportunities for value creation in Europe (2020)" highlights how open data has saved the equivalent of 5.8 million tonnes of oil every year in the European Union by promoting greener energy sources. This include 79.6 billion in cost savings on energy bills.
This article reviews some solutions that help us measure our carbon footprint to raise awareness of the situation, as well as useful open data sources .
Calculators to know your carbon footprint
The European Union has a web application where everyone can analyse the life cycle of products and energy consumed in five specific areas (food, mobility, housing, household appliances and household goods), based on 16 environmental impact indicators. The user enters certain data, such as his energy expenditure or the details of his vehicle, and the solution calculates the level of impact. The website also offers recommendations for improving consumption patterns. It was compiled using data from Ecoinvent y Agrifoot-print, as well as different public reports detailed in its methodology.
The UN also launched a similar solution, but with a focus on consumer goods. It allows the creation of product value chains by mapping the materials, processes and transports that have been used for their manufacture and distribution, using a combination of company-specific activity data and secondary data. The emission factors and datasets for materials and processes come from a combination of data sources such as Ecoinvent, the Swedish Environment Institute, DEFRA (UK Department for Environment, Food and Rural Affairs), academic papers, etc. The calculator is also linked to the the Platform for carbon footprint offsetting of the United Nations. This allows users of the application to take immediate climate action by contributing to UN green projects.
Looking at Spain, the Ministry for Ecological Transition and the Demographic Challenge has several tools to facilitate the calculation of the carbon footprint aimed at different audiences: organisations, municipalities and farms. They take into account both direct emissions and indirect emissions from electricity consumption. Among other data sources, it uses information from National Greenhouse Gas Inventory. It also provides an estimate of the carbon dioxide removals generated by an emission reduction project.
Another tool linked to this ministry is ComidaAPrueba, launched by the Fundación Vida Sostenible and aimed at finding out the sustainability of citizens' diets. The mobile application, available for both iOs and Android, allows us to calculate the environmental footprint of our meals to make us aware of the impact of our actions. It also proposes healthy recipes that help us to reduce food waste.
But not all actions of this kind are driven by public bodies or non-profit associations. The fight against the deterioration of our environment is also a niche market offering business opportunities. Private companies also offer solutions for calculating the carbon footprint, such as climate Hero, which is based on multiple data sources.
Data sources to feed carbon footprint calculators
As we have seen, in order to make these calculations, these solutions need to be based on data that allow them to calculate the relationship between certain consumption habits and the emissions generated. To do this, they draw on a variety of data sources, many of which are open. In Spain, for example, we find:
- National Statistics Institute (INE). The INE provides data on atmospheric emissions by branch of activity, as well as for households. It can be filtered by gas type and its equivalence in thousands of tonnes of CO2. It also provides data on the historical evolution of the achievement of carbon footprint reduction targets, which are based on the National Inventories of Emissions to the Atmosphere, prepared by the Ministry for Ecological Transition and the Demographic Challenge.
- Autonomous Communities. Several regional governments carry out inventories of pollutant emissions into the atmosphere. This is the case of the Basque Country and the Community of Madrid. Some regions also publish open forecast data, such as the Canary Islands, which provides projections of climate change in tourism or drought situations.
Other international data services to consider are:
- EarthData. This service provides full and open access to NASA' s collection of Earth science data to understand and protect our planet. This web provides links to commonly used data on greenhouse gases, including carbon dioxide, methane, nitrous oxide, ozone, chlorofluorocarbons and water vapour, as well as information on their environmental impact.
- Eurostat. The Statistical Office of the European Commission regularly publishes estimates of quarterly greenhouse gas emissions in the European Union, broken down by economic activity. The estimates cover all quarters from 2010 to the present.
- Life Cycle Assessment (LCA). This platform is the EU's knowledge base on sustainable production and consumption. It provides a product life cycle inventory for supply chain analysis. Data from business associations and other sources related to energy carriers, transport and waste management are used.
- Our World in Data. One of the most widely used datasets of this portal contains information on CO2 and greenhouse gas emissions through key metrics. Various primary data sources such as the US Energy Information Agency and The Global Carbon Project have been used for its elaboration. All raw data and scripts are available in their GitHub repository.
These repositories are just a sample, but there are many more sources whit valuable data to help us become more aware of the climate situation we live in and the impact our small day-to-day actions have on our planet. Reducing our carbon footprint is crucial to preserving our environment and ensuring a sustainable future. And only together will we be able to achieve our goals.
Blog
The energy transition is also a transition of raw materials. When we imagine a sustainable future, we conceive it based on a series of strategic sectors such as renewable energies or electric mobility. Similarly, we imagine a connected and digital future, where new innovations and business models related to the fourth industrial revolution allow us to solve global challenges such as food shortages or access to education. In short, we focus on technologies that help us improve our quality of life.
Why are critical minerals important?
These sectors depend on a series of key technologies, such as energy storage batteries, wind turbines, solar panels, electrolyzers, drones, robots, data transmission networks, electronic devices and space satellites. These are technologies that in recent years have undergone a great technological evolution and an enormous growth in demand worldwide. If we analyze the development forecasts to 2030, we can expect annual growth of at least double digits for many of them, as shown in Figure 1.
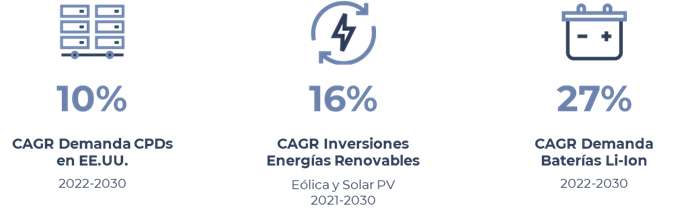
Figure 1: Expected growth up to 2030 of some of the key technologies for strategic sectors. Source: McKinsey (image 1, image 2, image 3)
However, as can be seen in Figure 2, many of these future technologies are highly dependent on a set of critical raw materials necessary for their development. Indium and gallium are key to the manufacture of energy-efficient LED lighting, silicon is indispensable for the manufacture of microchips and semiconductors, and the platinum group of metals (such as iridium, palladium, platinum rhodium or ruthenium) are used in catalysts for hydrogen electrolyzers.
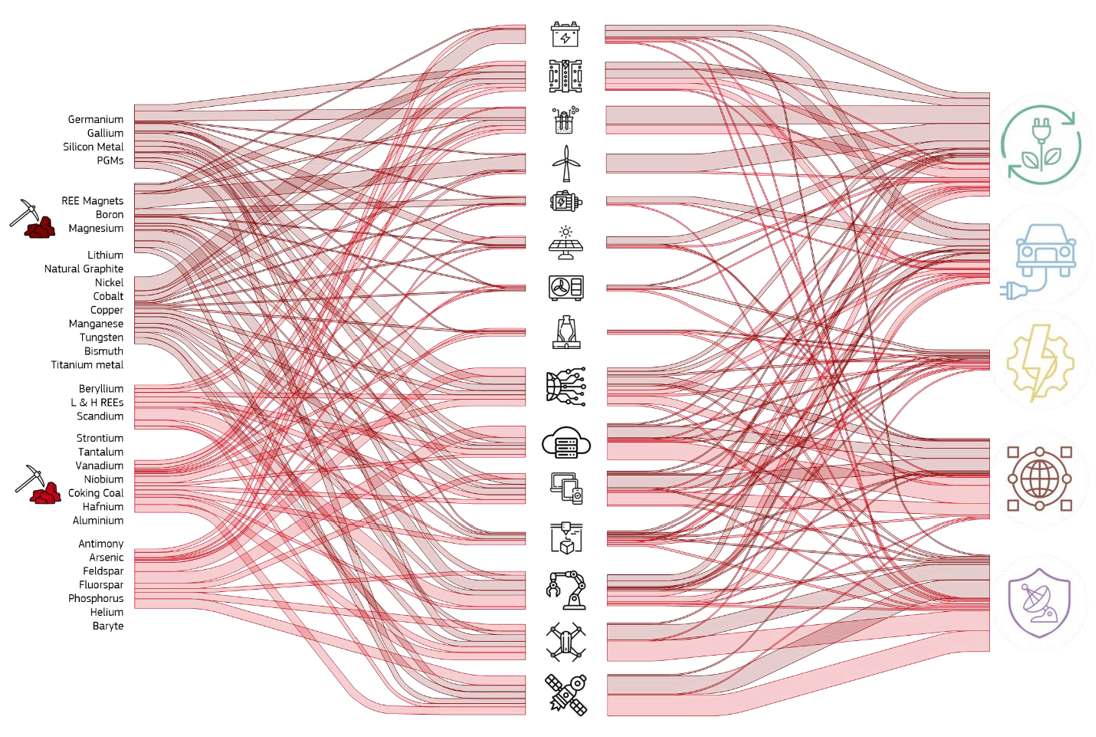
Figure 2: Semi-quantitative representation of raw material flows to the fifteen key technologies and five strategic sectors. Source: JRC Study
So, when does a material become critical? There are several factors that allow us to determine whether a raw material is considered critical:
- Its world reserves are scarce
- There are no alternative materials that can perform their function (their properties are unique or very unique).
- They are indispensable materials for key economic sectors of the future, and/or their supply chain is high-risk.
In the words of Margrethe Vestager, Executive Vice-President of the European Commission, "without a secure and sustainable supply of critical raw materials, there will be no green (sustainable) and industrial transition".
Research into sources of critical minerals data
In order to know in detail the situation of public minerals in Europe, we need to locate quality data. A task for which we will have to look into several sources.
First of all, we go to the European open data portal. From its search engine, in a first iteration, we see that there are more than 46,000 datasets for the query "critical raw materials" (Figure 3).
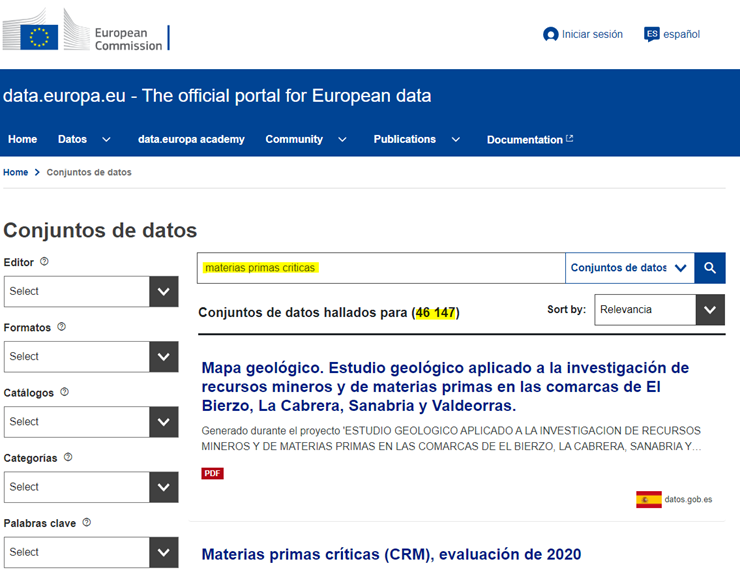
After a first analysis of the available data categories, we adjusted the filters until we narrowed down the datasets of interest to 190 (Figure 4). Particular attention is drawn to the data published by the JRC (European Commission Joint Research Center) and, in particular, to the dataset entitled Critical Raw Materials (CRM), 2020 assessment.
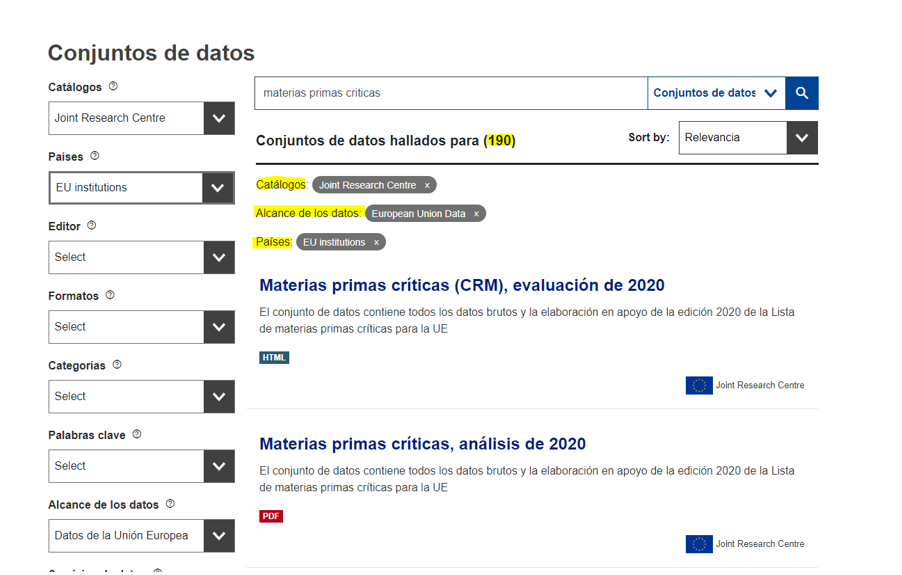
Figure 4: Second search for critical raw materials in the European data portal.
This dataset contains a direct link to a web portal, the RMIS (Raw Material Information System), which is actually the European Commission's reference knowledge base on raw materials through which we can access very relevant data and analysis.
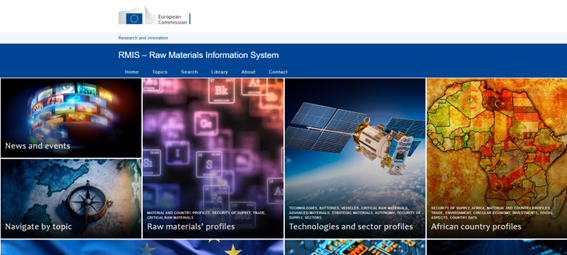
Figure 5: RMIS - European Commission's knowledge base for raw materials
Through the RMIS, we find a very interesting publication for any study on the subject. Although this publication is in PDF format, it allows us to access the list of strategic, critical and non-critical materials identified by the European Commission indicating their level of criticality and their use in different key technologies as shown in Figure 6.
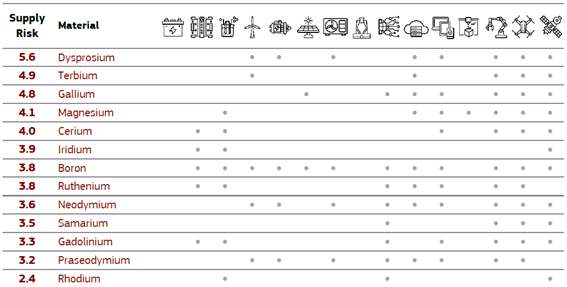
Figure 6: Table of strategic, critical and non-critical raw materials used different key technologies contained in the PDF file. Source: Supply chain analysis and material demand forecast in strategic technologies and sectors in the EU - A foresight study, JRC 2023.
Continuing our exploration, in this case in search of data on mineral reserves in the European continent, we found the European Gelological Data Infrastructure (EDGI) platform, which has an extensive catalog with more than 5,700 datasets and geological services. In our case, after performing a search in its data catalog, we selected three datasets containing interesting information in terms of findings of critical lithium, cobalt and graphite minerals (Figure 7).

Figure 7: Searching for datasets in the EDGI catalog
From the EDGI viewer, we can view the contents of these three datasets before downloading them in GeoJSON format (Figure 8). The three datasets have been originated from the FRAME project (Forecasting And Assessing Europe's Strategic Raw Materials Needs), in which multiple European entities participate, including the Geological and Mining Institute of Spain (IGME).
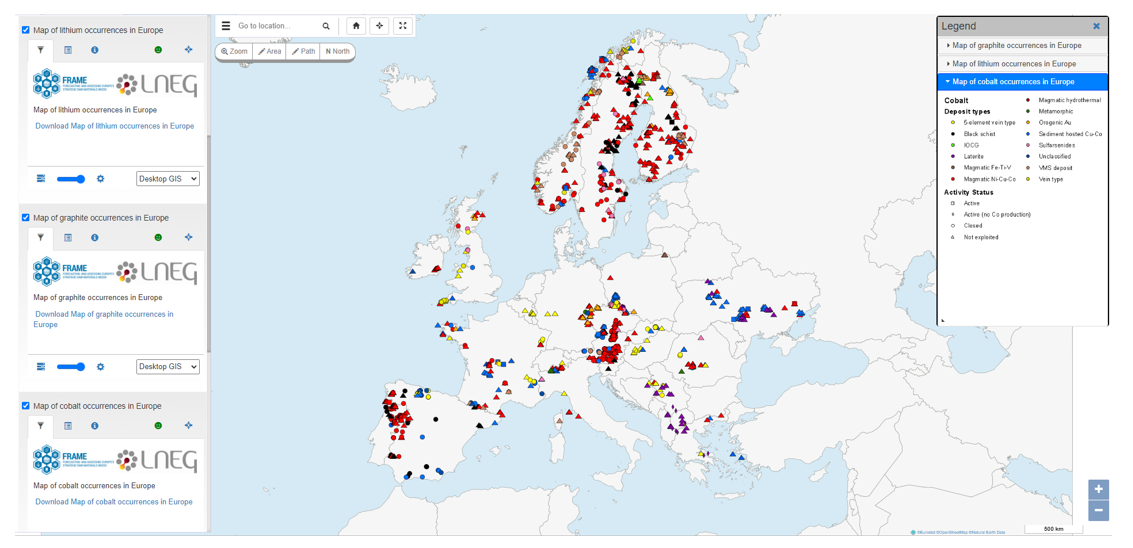
Figure 8: Querying selected datasets through EDGI visualization platform. Source: Map of cobalt occurrences in Europe, Map of graphite occurrences in Europe, Map of lithium occurrences in Europe, FRAME project.
Lastly, we went to the data portal of the International Energy Agency (IEA) (Figure 9). In this case, we found, among its more than 70 datasets, one directly related to our field of research, entitled Critical Minerals Demand Dataset, which we proceeded to download for further analysis in excel format.
Figure 9: Capture of the International Energy Agency (IEA) data portal.
After this search, we have located some interesting data that can help us to carry out different analyses.
Although this exercise has been carried out under the theme of critical minerals, European open data portals provide a large amount of information and diverse data sets on many areas of interest that can help us understand the challenges we face as a society, from the energy transition to the fight against poverty or food waste. Data that will allow us to carry out analyses aimed at making better decisions to move towards a more prosperous and sustainable future.
Content elaborated by Juan Benavente, industrial engineer and expert in technologies linked to the data economy. The contents and points of view reflected in this publication are the sole responsibility of the author.
Noticia
The concept of High-Value data (High-Value datasets) was introduced by the European Parliament and the Council of the European Union 4 years ago, in Directive (EU) 2019/1024. In it, they were defined as a series of datasets with a high potential to generate "benefits for society, the environment and the economy". Therefore, member states were to push for their openness for free, in machine-readable formats, via APIs, in the form of bulk download and comprehensively described by metadata.
Initially, the directive proposed in its annex six thematic categories to be considered as high value: geospatial, earth observation and environmental, meteorological, statistical, business records and transport network data. These categories were subsequently detailed in an implementing regulation published in December 2022. In addition, to facilitate their openness, a document with guidelines on how to use DCAT-AP for publication was published in June 2023.
New categories of data to be considered of high value
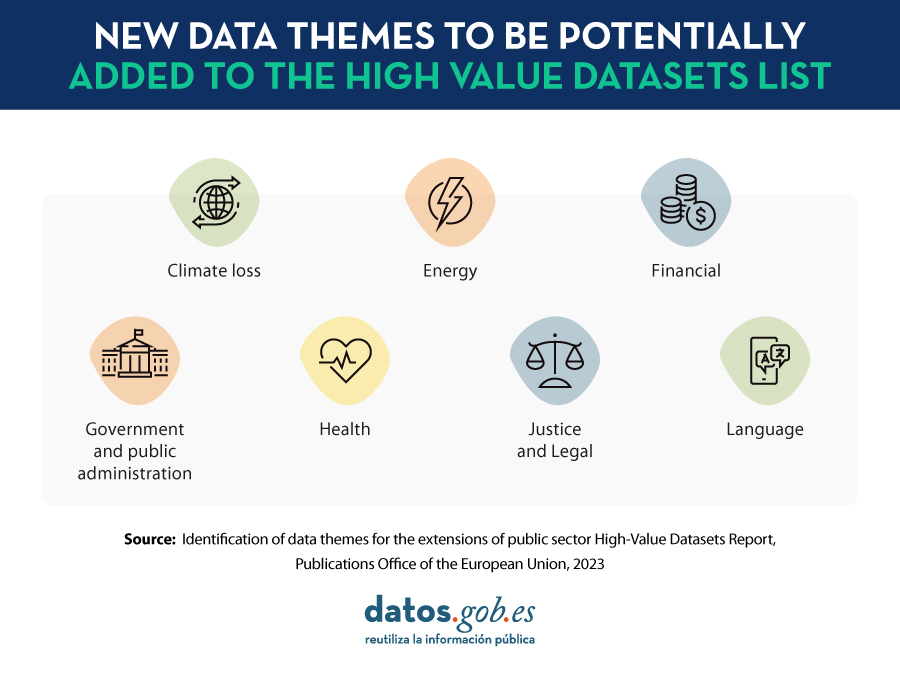
These initial categories were always open to extension. In this sense, the European Commission has just published the report "Identification of data themes for the extensions of public sector High-Value Datasets" which includes seven new categories to be considered as high-value data
-
Climate loss: This refers to data related to approaches and actions needed to avoid, minimize and address damages associated with climate change. Examples of datasets in this category are economic and non-economic losses from extreme weather events or slow-onset changes such as sea level rise or desertification. It also includes data related to early warning systems for natural disasters, the impact of mitigation measures, or research data on the attribution of extreme events to climate change.
-
Energy: This category includes comprehensive statistics on the production, transport, trade and final consumption of primary and secondary energy sources, both renewable and non-renewable. Examples of data sets to consider are price and consumption indicators or information on energy security.
-
Finance: This is information on the situation of private companies and public administrations, which can be used to assess business performance or economic sustainability, as well as to define spending and investment strategies. It includes datasets on company registers, financial statements, mergers and acquisitions, as well as annual financial reports.
-
Government and public administration: This theme includes data that public services and companies collect to inform and improve the governance and administration of a specific territorial unit, be it a state, a region or a municipality. It includes data relating to government (e.g. minutes of meetings), citizens (census or registration in public services) and government infrastructures. These data are then reused to inform policy development, deliver public services, optimize resources and budget allocation, and provide actionable and transparent information to citizens and businesses.
-
Health: This concept identifies data sets covering the physical and mental well-being of the population, referring to both objective and subjective aspects of people's health. It also includes key indicators on the functioning of health care systems and occupational safety. Examples include data relating to Covid-19, health equity or the list of services provided by health centers.
-
Justice and legal affairs: Identifies datasets to strengthen the responsiveness, accountability and interoperability of EU justice systems, covering areas such as the application of justice, the legal system or public security, i.e. that which ensures the protection of citizens. The data sets on justice and legal matters include documentation of national or international jurisprudence, decisions of courts and prosecutors general, as well as legal acts and their content.
-
Linguistic data: Refers to written or spoken expressions that are at the basis of artificial intelligence, natural language processing and the development of related services. The Commission provides a fairly broad definition of this category of data, all of which are grouped under the term "multimodal linguistic data". They may include repositories of text collections, corpora of spoken languages, audio resources, or video recordings.
To make this selection, the authors of the report conducted desk research as well as consultations with public administrations, data experts and private companies through a series of workshops and surveys. In addition to this assessment, the study team mapped and analyzed the regulatory ecosystem around each category, as well as policy initiatives related to their harmonization and sharing, especially in relation to the creation of European Common Data Spaces.
Potential for SMEs and digital platforms
In addition to defining these categories, the study also provides a high-level estimate of the impact of the new categories on small and medium-sized companies, as well as on large digital platforms. One of the conclusions of the study is that the cost-benefit ratio of data openness is similar across all new topics, with those relating to the categories "Finance" and "Government and public administration" standing out in particular.
Based on the publicly available datasets, an estimate was also made of the current degree of maturity of the data belonging to the new categories, according to their territorial coverage and their degree of openness (taking into account whether they were open in machine-readable formats, with adequate metadata, etc.). To maximize the overall cost-benefit ratio, the study suggests selecting a different approach for each thematic category: based on their level of maturity, it is recommended to indicate a higher or lower number of mandatory criteria for publication, thus ensuring to avoid overlaps between new topics and existing high-value data.
You can read the full study at this link.