Entrevista
In this episode we will delve into the importance of three related categories of high-value datasets. These are Earth observation and environmental data, geospatial data and mobility data. To tell us about them, we have interviewed two experts in the field:
- Paloma Abad Power, deputy director of the National Centre for Geographic Information (CNIG).
- Rafael Martínez Cebolla, geographer of the Government of Aragón.
With them we have explored how these high-value datasets are transforming our environment, contributing to sustainable development and technological innovation.
Listen to the full podcast (only available in Spanish)
Summary / Transcript of the interview
1. What are high-value datasets and why are their important?
Paloma Abad Power: According to the regulation, high-value datasets are those that ensure highest socio-economic potential and, for this, they must be easy to find, i.e. they must be accessible, interoperable and usable. And what does this mean? That means that the datasets must have their descriptions, i.e. the online metadata, which report the statistics and their properties, and which can be easily downloaded or used.
In many cases, these data are often reference data, i.e. data that serve to generate other types of data, such as thematic data, or can generate added value.
Rafael Martínez Cebolla: They could be defined as those datasets that represent phenomena that are useful for decision making, for any public policy or for any action that a natural or legal person may undertake.
In this sense, there are already some directives, which are not so recent, such as the Water Framework Directive or the INSPIRE Directive, which motivated this need to provide shared data under standards that drive the sustainable development of our society.
2. These high-value data are defined by a European Directive and an Implementing Regulation which dictated six categories of high-value datasets. On this occasion we will focus on three of them: Earth observation and environmental data, geospatial data and mobility data. What do these three categories of data have in common and what specific datasets do they cover?
Paloma Abad Power: In my opinion, these data have in common the geographical component, i.e. they are data located on the ground and therefore serve to solve problems of different nature and linked to society.
Thus, for example, we have, with national coverage, the National Aerial Orthophotography Plan (PNOA), which are the aerial images, the System of Land Occupation Information (SIOSE), cadastral parcels, boundary lines, geographical names, roads, postal addresses, protected sites - which can be both environmental and also castles, i.e. historical heritage- etc. And these categories cover almost all the themes defined by the annexes of the INSPIRE directive.
Rafael Martínez Cebolla: It is necessary to know what is pure geographic information, with a direct geographic reference, as opposed to other types of phenomena that have indirect geographic references. In today's world, 90% of information can be located, either directly or indirectly. Today more than ever, geographic tagging is mandatory for any corporation that wants to implement a certain activity, be it social, cultural, environmental or economic: the implementation of renewable energies, where I am going to eat today, etc. These high-value datasets enhance these geographical references, especially of an indirect nature, which help us to make a decision.
3. Which agencies publish these high-value datasets? In other words, where could a user locate datasets in these categories?
Paloma Abad Power: It is necessary to highlight the role of the National Cartographic System, which is an action model in which the organisations of the NSA (National State Administration) and the autonomous communities participate. It is coordinating the co-production of many unique products, funded by these organisations.
These products are published through interoperable web services. They are published, in this case, by the National Center for Geographic Information (CNIG), which is also responsible for much of the metadata for these products.
They could be located through the Catalogues of the IDEE (Spatial Data Infrastructure of Spain) or the Official Catalogue of INSPIRE Data and Services, which is also included in datos.gob.es and the European Data Portal.
And who can publish? All bodies that have a legal mandate for a product classified under the Regulation. Examples: all the mapping bodies of the Autonomous Communities, the General Directorate of Cadastre, Historical Heritage, the National Statistics Institute, the Geological and Mining Institute (IGME), the Hydrographic Institute of the Navy, the Ministry of Agriculture, Fisheries and Food (MAPA), the Ministry for Ecological Transition and the Demographic Challenge, etc. There are a multitude of organisations and many of them, as I have mentioned, participate in the National Cartographic System, provide the data and generate a single service for the citizen.
Rafael Martínez Cebolla: The National Cartographic System defines very well the degree of competences assumed by the administrations. In other words, the public administration at all levels provides official data, assisted by private enterprise, sometimes through public procurement.
The General State Administration goes up to scales of 1:25,000 in the case of the National Geographic Institute (IGN) and then the distribution of competencies for the rest of the scales is for the autonomous or local administrations. In addition, there are a number of actors, such as hydrographic confederations, state departments or the Cadastre, which have under their competences the legal obligation to generate these datasets.
For me it is an example of how it should be distributed, although it is true that it is then necessary to coordinate very well, through collegiate bodies, so that the cartographic production is well integrated.
Paloma Abad Power: There are also collaborative projects, such as, for example, a citizen map, technically known as an X, Y, Z map, which consists of capturing the mapping of all organisations at national and local level. That is, from small scales 1:1,000,000 or 1:50,000,000 to very large scales, such as 1:1000, to provide the citizen with a single multi-scale map that can be served through interoperable and standardised web services.
4. Do you have any other examples of direct application of this type of data?
Rafael Martínez Cebolla: A clear example was seen with the pandemic, with the mobility data published by the National Institute of Statistics. These were very useful data for the administration, for decision making, and from which we have to learn much more for the management of future pandemics and crises, including economic crises. We need to learn and develop our early warning systems.
I believe that this is the line of work: data that is useful for the general public. That is why I say that mobility has been a clear example, because it was the citizen himself who was informing the administration about how he was moving.
Paloma Abad Power: I am going to contribute some data. For example, according to statistics from the National Cartographic System services, the most demanded data are aerial images and digital terrain models. In 2022 there were 8 million requests and in 2023 there were 19 million requests for orthoimages alone.
Rafael Martínez Cebolla: I would like to add that this increase is also because things are being done well. On the one hand, discovery systems are improved. My general feeling is that there are many successful example projects, both from the administration itself and from companies that need this basic information to generate their products.
There was an application that was generated very quickly with de-escalation - you went to a website and it told you how far you could walk through your municipality - because people wanted to get out and walk. This example arises from spatial data that have moved out of the public administration. I believe that this is the importance of successful examples, which come from people who see a compelling need.
5. And how do you incentivise such re-use?
Rafael Martínez Cebolla: I have countless examples. Incentivisation also involves promotion and marketing, something that has sometimes failed us in the public administration. You stick to certain competences and it seems that just putting it on a website is enough. And that is not all.
We are incentivising re-use in two ways. On the one hand, internally, within the administration itself, teaching them that geographic information is useful for planning and evaluating public policies. And I give you the example of the Public Health Atlas of the Government of Aragon, awarded by an Iberian society of epidemiology the year before the pandemic. It was useful for them to know what the health of the Aragonese was like and what preventive measures they had to take.
As for the external incentives, in the case of the Geographic Institute of Aragon, it was seen that the profile entering the geoportal was very technical. The formats used were also very technical, which meant that the general public was not reached. To solve this problem, we promoted portals such as the IDE didactica, a portal for teaching geography, which reaches any citizen who wants to learn about the territory of Aragon.
Paloma Abad Power: I would like to highlight the economic benefit of this, as was shown, for example, in the economic study carried out by the National Centre for Graphic Information with the University of Leuven to measure the economic benefit of the Spatial Data Infrastructure of Spain. It measure the benefit of private companies using free and open services, rather than using, for example, Google Maps or other non-open sources..
Rafael Martínez Cebolla: For better and for worse, because the quality of the official data sometimes we wish it were better. Both Paloma in the General State Administration and I in the regional administration sometimes know that there are official data where more money needs to be invested so that the quality of the data would be better and could be reusable.
But it is true that these studies are key to know in which dimension high-value datasets move. That is to say, having studies that report on the real benefit of having a spatial data infrastructure at state or regional level is, for me, key for two things: for the citizen to understand its importance and, above all, for the politician who arrives every N years to understand the evolution of these platforms and the revolution in geospatial information that we have experienced in the last 20 years.
6. The Geographic Institute of Aragon has also produced a report on the advantages of reusing this type of data, is that right?
Rafael Martínez Cebolla: Yes, it was published earlier this year. We have been doing this report internally for three or four years, because we knew we were going to make the leap to a spatial knowledge infrastructure and we wanted to see the impact of implementing a knowledge graph within the data infrastructure. The Geographic Institute of Aragon has made an effort in recent years to analyse the economic benefit of having this infrastructure available for the citizens themselves, not for the administration. In other words, how much money Aragonese citizens save in their taxes by having this infrastructure. Today we know that having a geographic information platform saves approximately 2 million euros a year for the citizens of Aragon.
I would like to see the report for the next January or February, because I think the leap will be significant. The knowledge graph was implemented in April last year and this gap will be felt in the year ahead. We have noticed a significant increase in requests, both for viewing and downloading.
Basically from one year to the next, we have almost doubled both the number of accesses and downloads. This affects the technological component: you have to redesign it. More people are discovering you, more people are accessing your data and, therefore, you have to dedicate more investment to the technological component, because it is being the bottleneck.
7. What do you see as the challenges to be faced in the coming years?
Paloma Abad Power: In my opinion, the first challenge is to get to know the user in order to provide a better service. The technical user, the university students, the users on the street, etc. We are thinking of doing a survey when the user is going to use our geographic information. But of course, such surveys sometimes slow down the use of geographic information. That is the great challenge: to know the user in order to make services more user-friendly, applications, etc. and to know how to get to what they want and give it to them better.
There is also another technical challenge. When the spatial infrastructures began, the technical level was very high, you had to know what a visualisation service was, the metadata, know the parameters, etc. This has to be eliminated, the user can simply say I want, for example, to consult and visualise the length of the Ebro river, in a more user-friendly way. Or for example the word LiDAR, which was the Italian digital model with high accuracy. All these terms need to be made much more user-friendly.
Rafael Martínez Cebolla: Above all, let them be discovered. My perception is that we must continue to promote the discovery of spatial data without having to explain to the untrained user, or even to some technicians, that we must have a data, a metadata, a service..... No, no. Basically it is that generalist search engines know how to find high-value datasets without knowing that there is such a thing as spatial data infrastructure.
It is a matter of publishing the data under friendly standards, under accessible versions and, above all, publishing them in permanent URIs, which are not going to change. In other words, the data will improve in quality, but will never change.
And above all, from a technical point of view, both spatial data infrastructures and geoportals and knowledge infrastructures have to ensure that high-value information nodes are related to each other from a semantic and geographical point of view. I understand that knowledge networks will help in this regard. In other words, mobility has to be related to the observation of the territory, to public health data or to statistical data, which also have a geographical component. This geographical semantic relationship is key for me.
Interview clips
1. What are high-value datasets and why are their important?
2. Where can a user locate geographic data?
3. How is the reuse of data with a geographic component being encouraged?
Blog
Geographic data allow us to learn about the world around us. From locating optimal travel routes to monitoring natural ecosystems, from urban planning and development to emergency management, geographic data has great potential to drive development and efficiency in multiple economic and social areas. They are therefore considered high-value datasets by the European Commission, and have a specific obligations to make their publication accessible and interoperable.
In order to understand the real impact of this type of data, several reports and studies have been carried out. The following are several of them, which address the challenge of measuring the impact of geographic information.
Geospatial data in the Ministry of Transport and Sustainable Mobility. Impact of information co-produced by IGN and CNIG (2024)
- You can read the full report here.
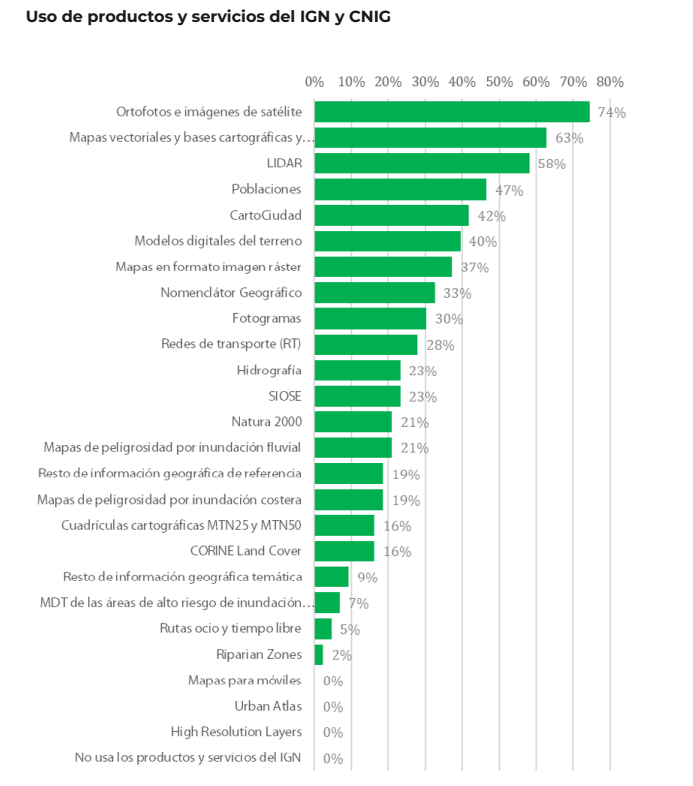
This report, produced by ASEDIE and CNIG, aims to draw conclusions about the use and perception of the services co-produced by National Geographic Institute (IGN) and National Centre for Geographic Information (CNIG) in order to understand the benefit they bring to the daily activity of the companies that use them and to society. For this purpose, a survey was carried out among companies using geospatial data, thanks to which a classification of companies reusing geographic data could be drawn up.
Of the 170 companies considered, 70.0% are self-employed and micro-enterprises (less than 10 employees). These companies are mainly located in the Community of Madrid (25.6%), Catalonia (16.3%), Andalusia (14%), Valencia (11.6%) and Castilla y León (11.6%). 53.3% claim to reuse data from Spatial Data Infrastructures (SDI) and 51% open data from INE, among others. The most used products are orthophotos and satellite images (74%), followed by vector maps and cartographic and topographic databases (63%), and LiDAR (58%).
In terms of economic impact, the report estimates an average impact of 35.7% on the sales of the companies surveyed. Specifically, open geographic information from the IGN and CNIG account for an impact of 12.4% of sales.
The report also includes the analysis of collected use cases, as well as in-depth interviews with companies in the sector as examples of best practices and, on the other hand, updates the information from Asedie's annual report on the Data Economy in its 2023 infomediary scope with respect to the economic data of the geographic subsector.
Economic benefits of the SDI central node by CNIG and University of Leuven (2021)
- You can read the full report here.
This document develops and tests a methodology for estimating the economic benefits generated by the Spanish Spatial Data Infrastructure (IDEE), which establishes the publication and accessibility of spatial data through free geographic web services for viewing and downloading produced by cartographic, environmental, cadastral and land observation organisations at national, regional and local level since 2004, in accordance with norms, standards and recommendations that guarantee their interoperability.
The study was to answer the question of what would happen if the NSDI were to disappear. For the study, only the central node of the NSDIE was considered, understanding as such the geographic services and data co-produced among the partners of the National Cartographic System, and focusing on web map services (WMS) and map tiles (WMTS). The nodes of ministries, autonomous communities and local entities were not part of its scope.
Two investigation paths were used to carry out the calculation:
- Comparison with the costs of using Google Maps. The application of the different scenarios led to a profit/value of the 6 WMTS and 13 WMS of minimum 355,646 and maximum 891,144 euros.
- Comparison with other countries' charges for the use of their data and services. Despite the difficulties in calculating the rate per application, due to the existence of different approaches in each country, the total value of the FDIE was estimated at between 34,000 and 14 million euros.
This report joins others produced by the NSDI, such as these documents to estimate the average cost of metadata generation or the implementation of visualisation and download services for Inspire-compliant datasets, both carried out in 2019.
In order to allow other organisations to adapt the study to their particularities, an Excel file has been created, as a calculator, with the following calculation template.
ICEARAGON and ARAGEA Performance Report by the Government of Aragon (2024)
- You can read the full report here.
Regional governments are also interested in knowing the impact of their geographic information services. This is the case of the Government of Aragon, which recently presented a report on the performance of the Spatial Knowledge Infrastructure of Aragon (ICEARAGON) and the Active Geodesy Network of Aragon (AREAGA).
In total, these services are estimated to have saved almost two million euros for all Aragonese citizens by 2023. According to the report, ICEARAGÓN received almost 5 million visits in 2023, an increase of 58.6% over 2022. These users made 1.7 million downloads. Most of the information downloaded (47.8%) refers to environmental layers. Information on administrative boundaries (13.8%) and maps of Aragon (13.4%) were also very successful. Regarding the user profile, 71% are from the surveying field and 27% belong to the agricultural sector.
These reports serve as a basis for the work of the European Commission on a regular basis, compiling progress in the different areas of INSPIRE implementation. As a result of this work, annual reports are generated for each country, including a section on costs and benefits.
All this work on measuring and estimating benefits highlights the economic value of providing geographic data and services to society. As a result, new products and services can be created that boost the economy of the whole country and provide benefits to all its citizens.
Evento
31 May 2024 is the date chosen to celebrate the 3rd National Open Data Meeting organised once again this year by the Provincial Council of Castellón, with the collaboration of the Provincial Council of Barcelona and the Government of Aragon. Under the slogan "Data to boost the tourism sector", experts in the field will meet in a unique setting, Peñíscola Castle, to discuss the importance of the availability and reuse of open data in this sector.
Among other issues, during the event, the importance of open data as a resource for understanding and achieving relevant and sustainable tourismwill be disseminated. This will be done by sharing resources that can benefit different users. The value of open data for implementing innovative technological solutions, e.g. based on artificial intelligence, will also be discussed.
Who is it aimed at?
This is an open event, where any citizen interested in the subject is welcome. In particular, it may be of particular interest to:
- Technicians and professionals in the field of tourism.
- Mayors' offices, councillors' offices, departments and departments of the state, territorial and local administration.
- Journalists and communication professionals.
- Tour operators.
- Responsible for data governance and open data portals of administrations.
What is the programme?
The event will start at 9:00 with the inauguration by María Tormo Casañ, representative of the Diputación de Castellón. It will be followed by the inaugural address by José Norberto Mazón López, professor of computer languages and systems at the University of Alicante.
This will be followed by a series of round tables and presentations:
- 10.00 Table 1. Tourism and the economy: a data space for growth and development.
- 11:30 Coffee break.
- 12:00 Table 2. How data can improve experiences and make tourism sustainable.
- 13.30 Presentation: conclusions of the technical challenges on open data.
- 14:15 Lunch.
- 15.45 Public management roundtable: data-driven public policies to improve tourism activity.
The event will end at 17.30, after the presentation of the conclusions.
How can I register?
The event can only be followed in person, as there will be no live broadcast. As mentioned at the beginning, the event will take place on 31 May in the Gothic hall of Peñíscola Castle. To register you must complete the form available at this link.
The importance of open data in tourism
Open data on tourism allows us to understand the state of the sector so that both tourism businesses and public bodies can make informed decisions to help boost this important economic driver. At the same time, they can serve as a basis for implementing technological solutions that improve the travellers' experience and allow them to easily organise and enjoy their trip. This is the case of some of the applications with information on accommodation, restaurants, tourist sites, activities of interest, etc.
Public bodies are aware of this situation and therefore there are more and more spaces where data on this issue can be shared. In this sense, we find national initiatives, such as Dataestur or promoted by autonomous regional bodies, such as the asturias tourism data catalogue. For its part, the Castellón Provincial Council is currently developing a specific area on tourism in its Open Data Portal specific space on tourism in its Open Data Portal, which aims to bring together all the knowledge which aims to bring together all the knowledge generated around the 3rd National Open Data Meeting.
If you are interested in the subject, in the tourism sectorial of datos.gob.es you will find featured datasets, news and analysis articles, as well as examples of applications and companies reusers that base their activity on open data from the tourism sector.
Events such as the III National Open Data Meeting are another interesting opportunity to keep up to date with developments in the sector. Remember that you can sign up through this link.
Evento
Aragón Open Data, the open data portal of the Government of Aragón, will present its most recent work on 15 March 2023 to present its lines of action and progress in the field of open data and linked data.
What does 'Aragón Open Data: Open and connect data' consist of?
In this meeting, which is part of the events framed in the Open Data Days 2023, Aragón Open Data will take the opportunity to talk about the evolution of its open data platform and the improvement of the quality of the data offered.
In this line, the conference 'Aragón Open Data: Open and connect data' will also focus on detailing the functioning of Aragopedia, its new linked data strategy.
Through a series of technical explanations, supported by a demo, attendees will learn how this service works, based on the new structure of Interoperable Information of Aragon (EI2A) that allows sharing, connecting and relating certain data available on the Aragon Open Data portal.
In order to detail as precisely as possible, the approach of the conference, we share the programme below:
- Welcome to the conference. Julián Moyano, coordinator of Aragón Open Data.
- Introduction to Aragón Open Data (Marc Garriga, Desidedatum)
- Improving the quality of the data and its semantisation (Koldo Z. / Susana G.)
- Previous situation and current situation
- New navigation focused on Aragón Open Data and Aragopedia data (Pedro M. / Beni)
- Explanation and Demo
- My experience with Aragopedia (Sofía Arguís, Documentalist and user of Aragón Open Data )
- Process of identification, processing and opening of new data (Cristina C.)
- Starting point and challenges encountered to achieve openness.
- Conclusions (Marc Garriga)
- Question/Comment Time
Where and when is it being held?
The technical conference 'Aragón Open Data: Open and connect data' will be held on 15 March from 12:00 to 13:30 online. Therefore, in order to attend it, interested users must fill in the form available at the following point.
How can I register?
To attend and access the online session you can fill in the following form and if you have any questions, do not hesitate to write to us at opendata@aragon.es.
Aragón Open Data is co-financed by the European Union, European Regional Development Fund (ERDF) "Building Europe from Aragon.