Application
Open SDG Index is a platform for managing and visualising results and progress in the fulfilment of the Sustainable Development Goals and the 2030 Agenda. It allows reporting and systematizing the progress and effort made by public and private entities to meet the SDGs. On the one hand, it facilitates the self-evaluation of this progress and, on the other, it makes the results known to the general public. It is part of the SDG system and allows any entity to incorporate and update its profile.
The portal includes advanced searches, sectoral and territorial filters and organisation profiles for open consultation. The information is verified by independent agents and presented geolocalized to facilitate comparison between organizations and territories.
For the deployment of the Open SDG Index, a proprietary methodology has been developed in collaboration with the UNDP (United Nations Development Programme). The project won the First Prize for Social Entrepreneurship "La Noria" from the Diputación de Málaga in 2020.
Blog
The European Green Deal (Green Deal) is the European Union's (EU) sustainable growth strategy, designed to drive a green transition that transforms Europe into a just and prosperous society with a modern and competitive economy. Within this strategy, initiatives such as Target 55 (Fit for 55), which aims to reduce EU emissions by at least 55% by 2030, stand out, and the Nature Restoration Regulation(, which sets binding targets to restore ecosystems, habitats and species.
The European Data Strategy positions the EU as a leader in data-driven economies, promoting fundamental values such as privacy and sustainability. This strategy envisages the creation of data spaces sectoral spaces to encourage the availability and sharing of data, promoting its re-use for the benefit of society and various sectors, including the environment.
This article looks at how environmental data spaces, driven by the European Data Strategy, play a key role in achieving the goals of the European Green Pact by fostering the innovative and collaborative use of data.
Green Pact data space from the European Data Strategy
In this context, the EU is promoting the Green Deal Data Space, designed to support the objectives of the Green Deal through the use of data. This data space will allow sharing data and using its full potential to address key environmental challenges in several areas: preservation of biodiversity, sustainable water management, the fight against climate change and the efficient use of natural resources, among others.
In this regard, the European Data Strategy highlights two initiatives:
- On the one hand, the GreenData4all initiative which carries out an update of the INSPIRE directive to enable greater exchange of environmental geospatial data between the public and private sectors, and their effective re-use, including open access to the general public.
- On the other hand, the Destination Earth project proposes the creation of a digital twin of the Earth, using, among others, satellite data, which will allow the simulation of scenarios related to climate change, the management of natural resources and the prevention of natural disasters.
Preparatory actions for the development of the Green Pact data space
As part of its strategy for funding preparatory actions for the development of data spaces, the EU is funding the GREAT project (The Green Deal Data Space Foundation and its Community of Practice). This project focuses on laying the foundations for the development of the Green Deal data space through three strategic use cases: climate change mitigation and adaptation, zero pollution and biodiversity. A key aspect of GREAT is the identification and definition of a prioritised set of high-value environmental data (minimum but scalable set). This approach directly connects this project to the concept of high-value data defined in the European Open Data Directive (i.e. data whose re-use generates not only a positive economic impact, but also social and environmental benefits).. The high-value data defined in the Implementing Regulation include data related to Earth observation and the environment, including data obtained from satellites, ground sensors and in situ data.. These packages cover issues such as air quality, climate, emissions, biodiversity, noise, waste and water, all of which are related to the European Green Pact.
Differentiating aspects of the Green Pact data space
At this point, three differentiating aspects of the Green Pact data space can be highlighted.
- Firstly, its clearly multi-sectoral nature requires consideration of data from a wide variety of domains, each with their own specific regulatory frameworks and models.
- Secondly, its development is deeply linked to the territory, which implies the need to adopt a bottom-up approach (bottom-up) starting from concrete and local scenarios.
- Finally, it includes high-value data, which highlights the importance of active involvement of public administrations, as well as the collaboration of the private and third sectors to ensure its success and sustainability.
Therefore, the potential of environmental data will be significantly increased through European data spaces that are multi-sectoral, territorialised and with strong public sector involvement.
Development of environmental data spaces in HORIZON programme
In order to develop environmental data spaces taking into account the above considerations of both the European Data Strategy and the preparatory actions under the Horizon Europe (HORIZON) programme, the EU is funding four projects:
- Urban Data Spaces for Green dEal (USAGE).. This project develops solutions to ensure that environmental data at the local level is useful for mitigating the effects of climate change. This includes the development of mechanisms to enable cities to generate data that meets the FAIR principles (Findable, Accessible, Interoperable, Reusable) enabling its use for environmentally informed decision-making.
- All Data for Green Deal (AD4GD).. This project aims to propose a set of mechanisms to ensure that biodiversity, water quality and air quality data comply with the FAIR principles. They consider data from a variety of sources (satellite remote sensing, observation networks in situ, IoT-connected sensors, citizen science or socio-economic data).
- F.A.I.R. information cube (FAIRiCUBE). The purpose of this project is to create a platform that enables the reuse of biodiversity and climate data through the use of machine learning techniques. The aim is to enable public institutions that currently do not have easy access to these resources to improve their environmental policies and evidence-based decision-making (e.g. for the adaptation of cities to climate change).
- Biodiversity Building Blocks for Policy (B-Cubed).. This project aims to transform biodiversity monitoring into an agile process that generates more interoperable data. Biodiversity data from different sources, such as citizen science, museums, herbaria or research, are considered; as well as their consumption through business intelligence models, such as OLAP cubes, for informed decision-making in the generation of adequate public policies to counteract the global biodiversity crisis.
Environmental data spaces and research data
Finally, one source of data that can play a crucial role in achieving the objectives of the European Green Pact is scientific data emanating from research results. In this context, the European Union's European Open Science Cloud (EOSC) initiativeis an essential tool. EOSC is an open, federated digital infrastructure designed to provide the European scientific community with access to high quality scientific data and services, i.e. a true research data space. This initiative aims to facilitate interoperability and data exchange in all fields of research by promoting the adoption of FAIR principles, and its federation with the Green Pact data space is therefore essential.
Conclusions
Environmental data is key to meeting the objectives of the European Green Pact. To encourage the availability and sharing of this data, promoting its re-use, the EU is developing a series of environmental data space projects. Once in place, these data spaces will facilitate more efficient and sustainable management of natural resources, through active collaboration between all stakeholders (both public and private), driving Europe's ecological transition.
Jose Norberto Mazón, Professor of Computer Languages and Systems at the University of Alicante. The contents and views reflected in this publication are the sole responsibility of the author.
Blog
Open data is a valuable tool for making informed decisions that encourage the success of a process and enhance its effectiveness. From a sectorial perspective, open data provides relevant information about the legal, educational, or health sectors. All of these, along with many other areas, utilize open sources to measure improvement compliance or develop tools that streamline work for professionals.
The benefits of using open data are extensive, and their variety goes hand in hand with technological innovation: every day, more opportunities arise to employ open data in the development of innovative solutions. An example of this can be seen in urban development aligned with the sustainability values advocated by the United Nations (UN).
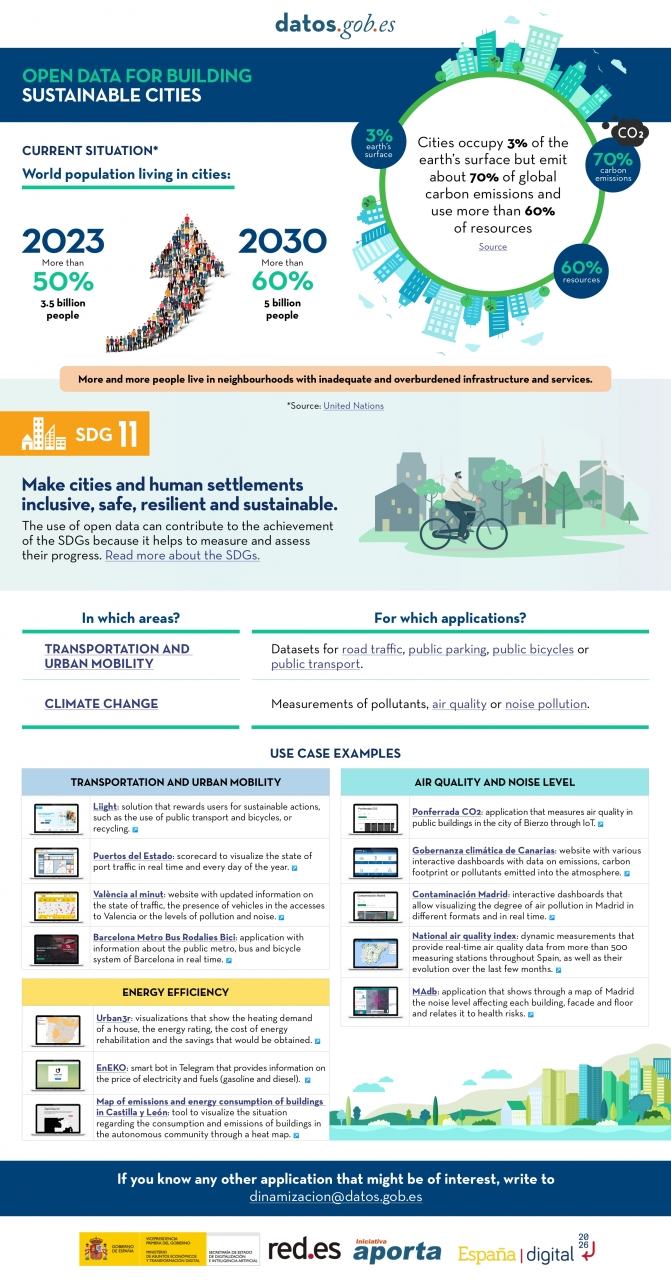
Cities cover only 3% of the Earth's surface; however, they emit 70% of carbon emissions and consume over 60% of the world's resources, according to the UN. In 2023, more than half of the global population lives in cities, and this figure is projected to keep growing. By 2030, it is estimated that over 5 billion people would live in cities, meaning more than 60% of the world's population.
Despite this trend, infrastructures and neighborhoods do not meet the appropriate conditions for sustainable development, and the goal is to "Make cities and human settlements inclusive, safe, resilient, and sustainable," as recognized in Sustainable Development Goal (SDG) number 11. Proper planning and management of urban resources are significant factors in creating and maintaining sustainability-based communities. In this context, open data plays a crucial role in measuring compliance with this SDG and thus achieving the goal of sustainable cities.
In conclusion, open data stands as a fundamental tool for the strengthening and progress of sustainable city development.
In this infographic, we have gathered use cases that utilize sets of open data to monitor and/or enhance energy efficiency, transportation and urban mobility, air quality, and noise levels. Issues that contribute to the proper functioning of urban centers.
Click on the infographic to view it in full size.
Blog
In 2015, the UN adopted the 2030 Agenda for Sustainable Development, an action plan made up of 17 global goals to eradicate poverty, protect the planet and ensure prosperity. This is what is known as the Sustainable Development Goals (SDGs).
In order to measure and evaluate the progress of the SDGs - in addition to their own development - accurate, up-to-date, sufficiently disaggregated, relevant, accessible and user-friendly data and statistics are needed. In other words, quality open data disaggregated by sex, age, municipality, etc. is needed.
In this regard, the UN itself has developed a set of indicators and statistical data aimed not only at monitoring progress, but also at informing policy and ensuring the accountability of all stakeholders. There are 232 indicators that refer to 169 targets. In addition, the Open SDG Data Hub portal provides geographically referenced data by target. Users can explore, analyse and use authoritative data sources on the SDGs to discover patterns, relationships and trends. For its part, the World Bank has an atlas where it presents interactive narratives and data visualizations on the SDGs, using its World Development Indicators database as a primary source.
But what if we want to delve deeper into what is happening in our country with respect to meeting the Sustainable Development Goals?
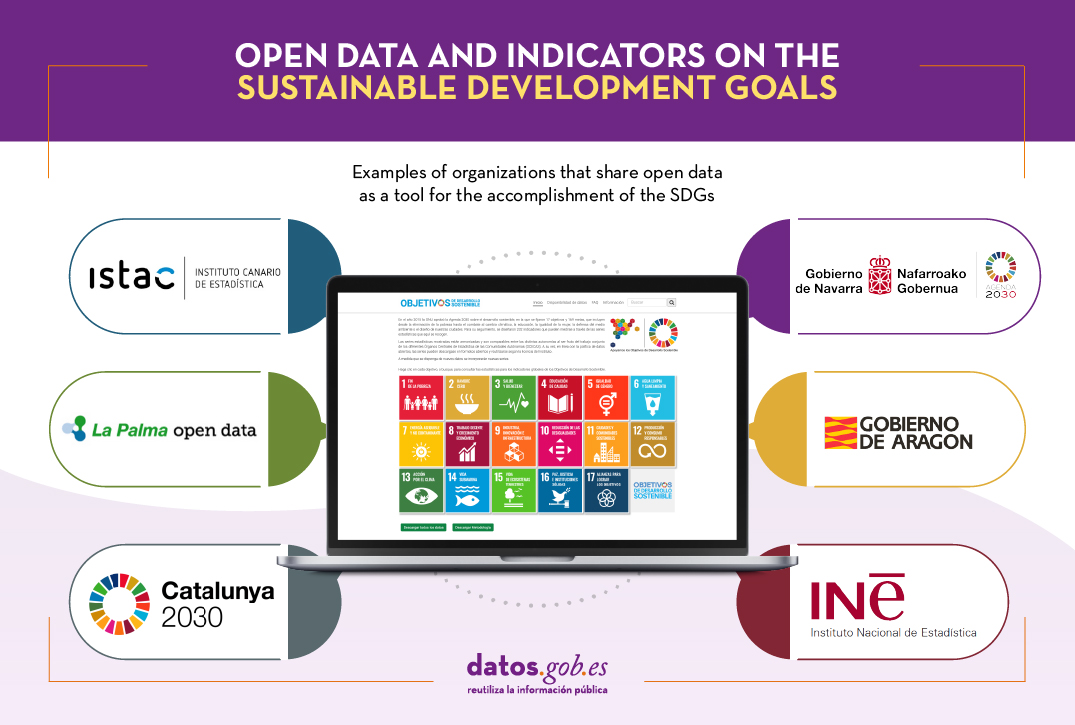
Resources related to the Sustainable Development Goals in Spain
Several organizations publish open data on the SDGs in our country. Below, we show you several examples at national and regional level.
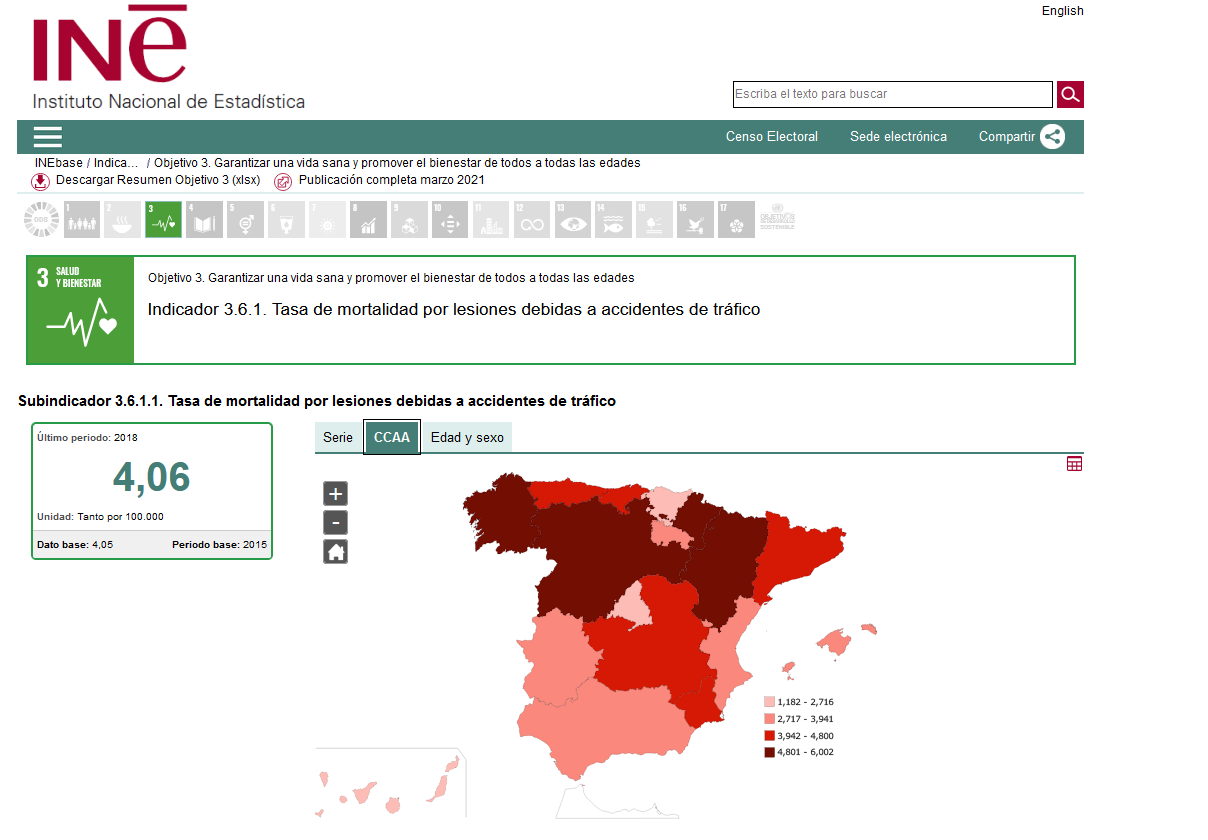
National Statistics Institute (INE)
Through its website, the INE has launched an electronic platform with updated statistical information about the global indicators established by the UN to monitor compliance with the SDGs.
When entering the available sub-indicators, the evolution of the indicator is shown graphically and, when possible, the breakdown by Autonomous Communities, age and sex. Data tables can also be accessed and downloaded in various formats (XLS, CSV, PC-Axis, etc.). These data are also available in our data catalog.
Canary Islands
The Canary Islands Statistics Institute (ISTAC) publishes in open format the indicators of compliance with the SDGs in the Canary Islands. The statistical series shown are harmonized and are comparable between the different autonomous regions as they are the result of the joint work of the different Central Statistical Bodies of the Autonomous Communities (OCECAS).
The ISTAC has created a tutorial showing how to reuse the data hosted in the application.
You can download the data from the platform itself or here.
Navarra
The Government of Navarra has launched a website to show its progress in achieving the Sustainable Development Goals (SDGs). It shows the activities being carried out to meet each of the 17 goals and their impact through graphs and indicators that show the region's progress in the different areas. It includes summaries by region. The data can be downloaded here.
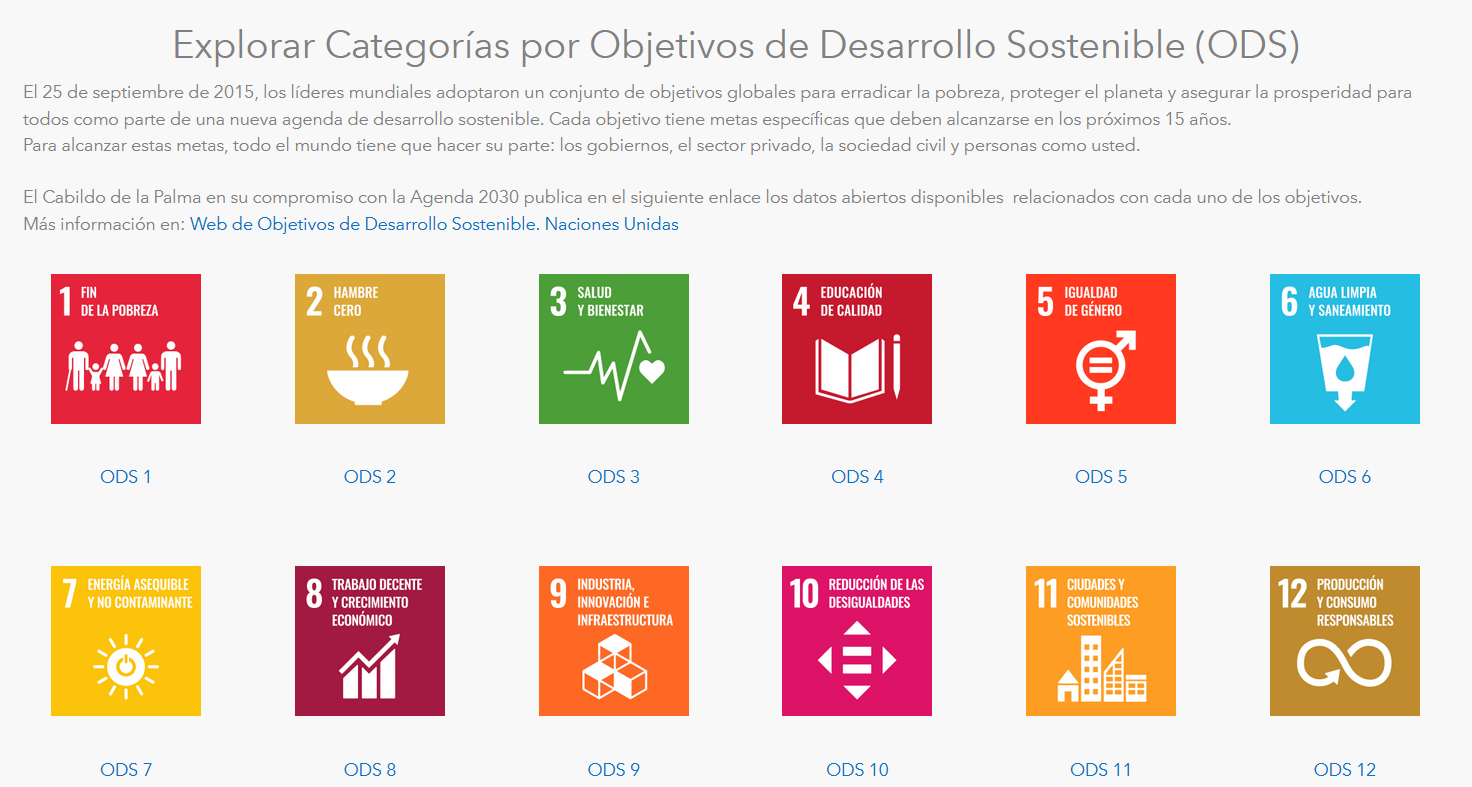
La Palma
The Open Data La Palma portal allows you to explore the available data based on the categories of the Sustainable Development Goals (SDGs). On the homepage of the portal you can click on the image of each goal to see the available data related to it. It is not about indicators, but a different way of organizing the available data.
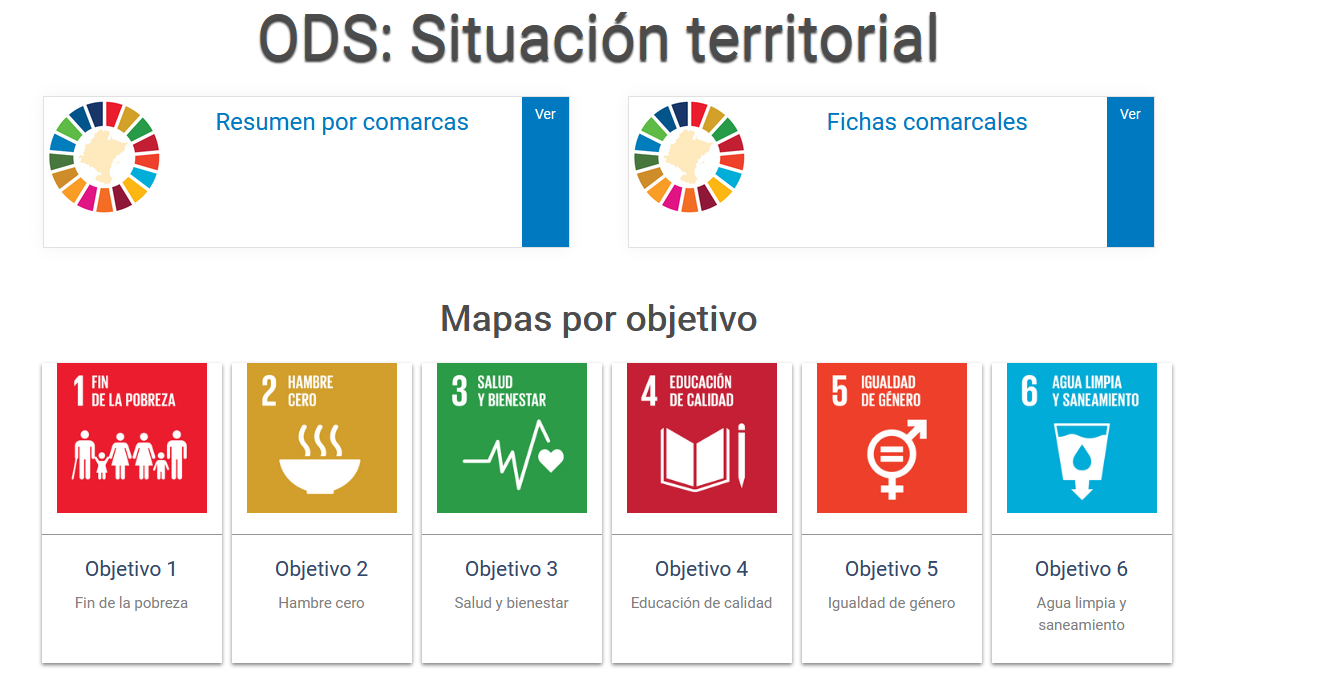
Aragón
Thanks to the work of the Aragonese Institute of Statistics, this website has been created where you can access different resources related to each of the objectives, including an Excel file with all the regional indicators. The methodological sheet is also available in Word format.
Catalonia
Since 2019, Catalonia's annual statistical action programs incorporate in the official statistics the development, maintenance, updating and dissemination of the integrated system of SDG indicators for the region. To do so, they take as a reference the indicators published by Eurostat and their criteria of quality, robustness and methodological adequacy. On this website you can see the results and download the data in CSV format.
In addition to these examples, there are many initiatives that also share open data on compliance with the SDGs on their websites. This is the case of Andalusia and the Basque Country.
In short, open data is essential for monitoring the progress achieved in the different programs. Therefore, more and more organizations are publishing data in this sense, data that are essential to know the inequalities and that policy makers can seek more accurate solutions. This will help advance implementation and the goal of achieving a fairer world for all.
Content prepared by the datos.gob.es team.
Blog
Public administrations and international organisations are increasingly using new, more practical and creative approaches to problem solving, focusing on real data and how to better understand people's needs. This will enable them to propose solutions that meet those needs more directly and effectively, rather than designing policies or products in isolation and independently, and then trying to make the recipients conform to them.
A good example of this trend is the growing popularity of people-centred design methodologies - such as design thinking - among legislators, public service designers and policy innovators. Thus, we can see how institutions such as the United Nations or governments such as those of Australia or Hong Kong have been exploring the opportunities and advantages that user-centred design offers them for some time now.
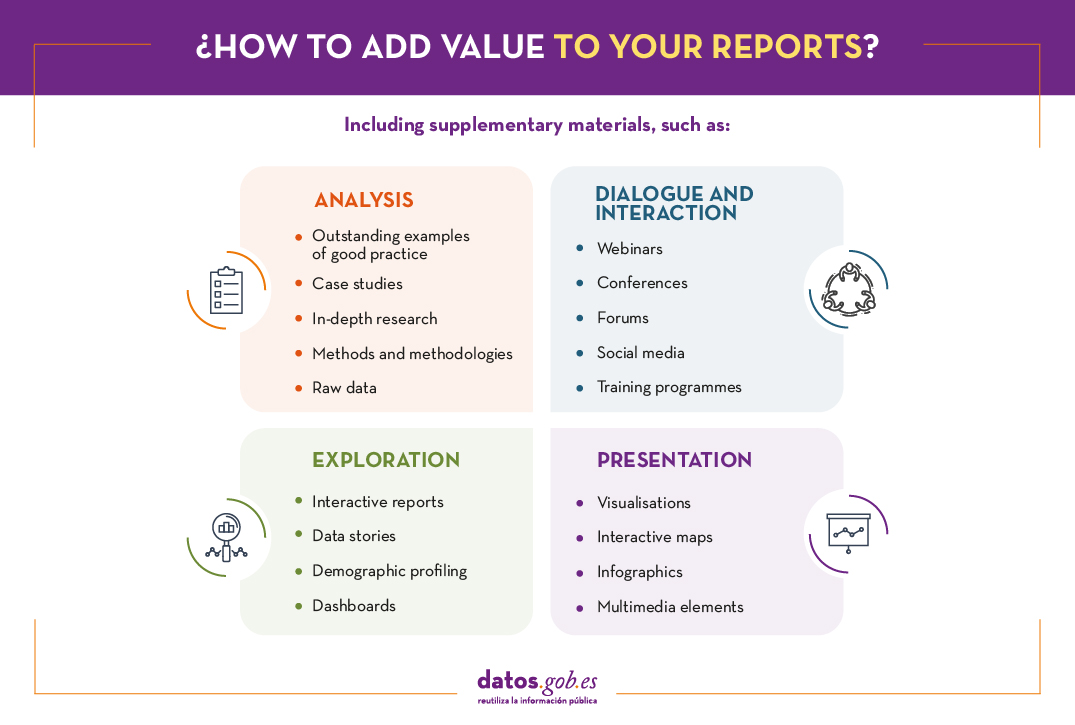
This change of mentality also means that the way in which the analysis and results of these public policies have traditionally been presented through macro-reports is also evolving to adapt to the new needs of participatory and collaborative development. Here are three current examples of how this change in philosophy is already being put into practice.
World Bank Global Development Report
About a year ago we shared the first draft of the World Bank's Development Report and already then it was striking that they had prepared a series of public consultations through which they sought to answer the main questions presented in that initial draft. Now that the rounds of consultations are over and a few months after the publication and presentation of the final version of the report, it is also pleasing to note that the World Bank is once again going a step further in presenting the results and offering us a range of options, including the following:
- Highlighted examples: A series of thematic case studies showing how data can be used to drive development in areas as diverse as road safety, environment, gender-based violence, public debt management, and weather forecasting.
- Data and analysis tools: Providing access to and the ability to explore and download all the data underpinning the report. This includes a number of time-series indicators for more than 170 countries, data on laws and regulations affecting data governance in 80 countries, and indicators on the maturity of countries' data governance practices.
- In-depth research: Provides a series of research articles that delve into some of the more detailed aspects of the issues covered in the report, such as the factors limiting internet adoption in West Africa and the cost to countries of enforcing and implementing personal data regulation.
- Case studies: where the World Bank will be incorporating real cases where it is working with countries to facilitate the implementation of appropriate data governance systems, although at the moment it only has a single case study on the data ecosystem in Jordan.
On the other hand, we can also see how this trend towards collaborative design and development not only seems to be consolidated, but also reinforced and extended through a series of online seminars in which the World Bank has been collaborating with other entities and organisations such as the G20, the OECD, the United Nations, Paris21, the Internet Society, the Open Institute or Data2X to continue analysing the results of the study from different points of view.
United Nations Sustainable Development Goals
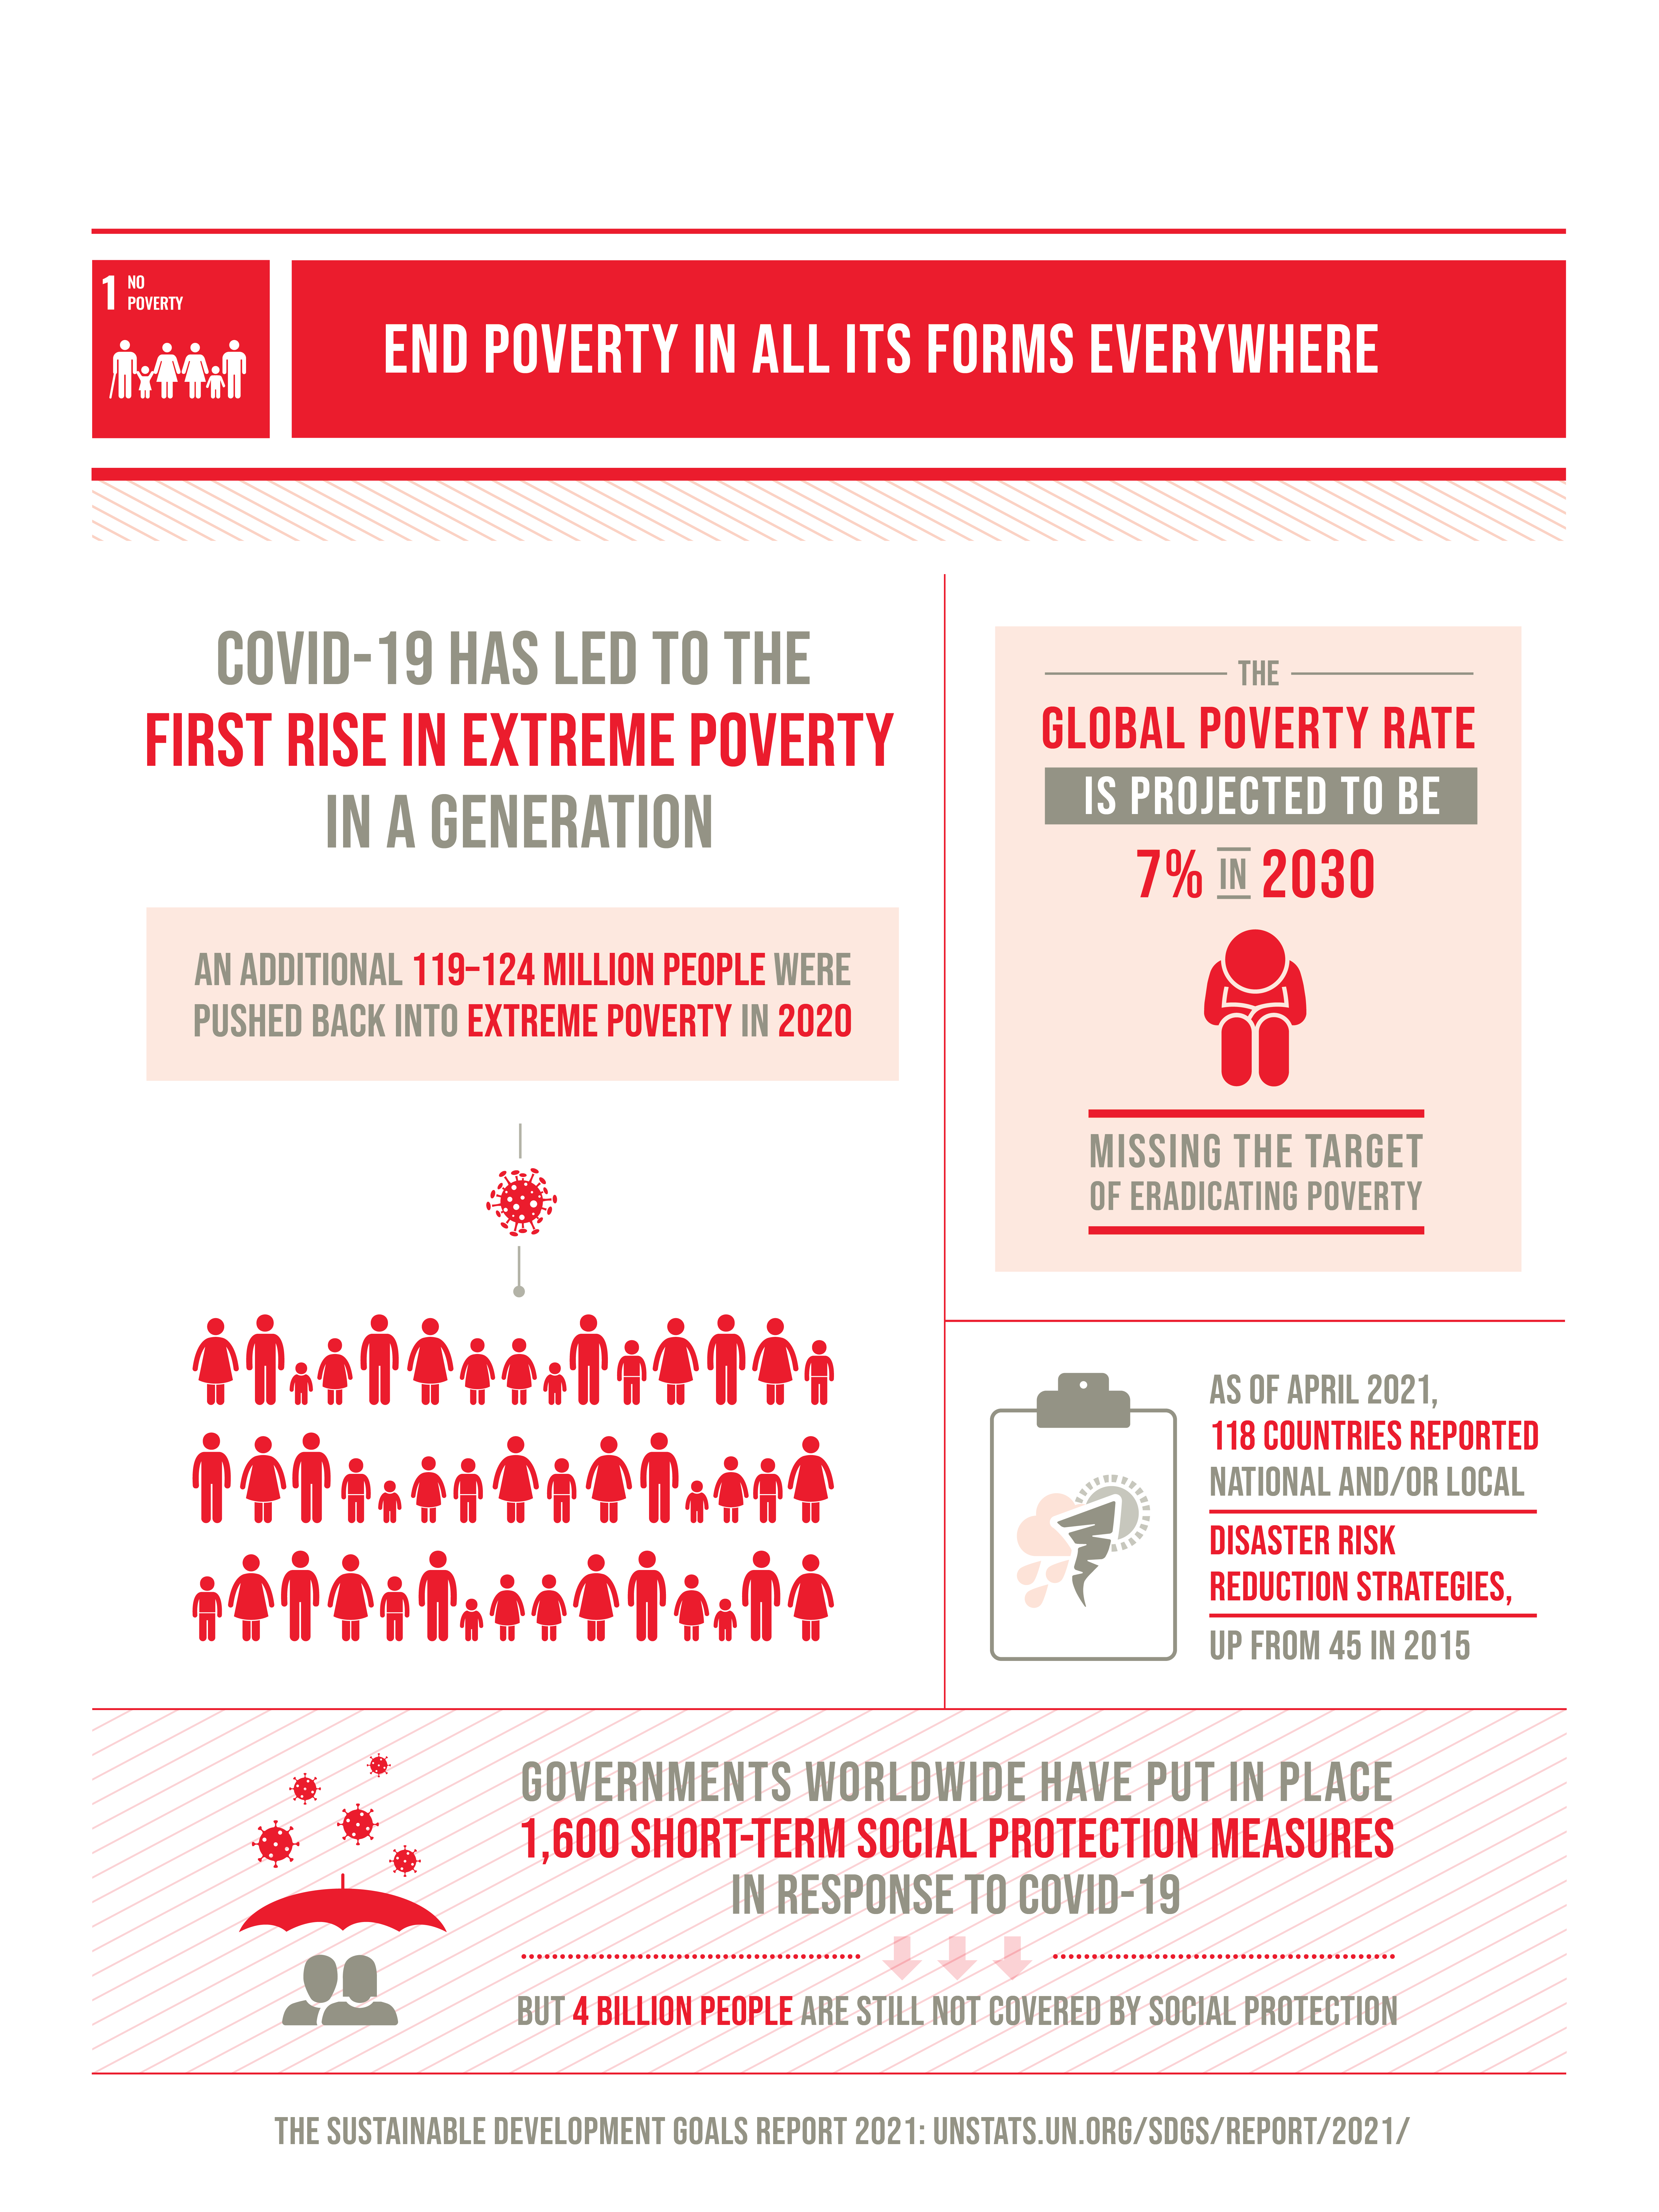
Another good example of this trend can be seen in the ambitious Sustainable Development Goals project promoted by the United Nations, which, due to its size and complexity, needs to be supported by a variety of other tools beyond the traditional global reports on sustainable development that they also continue to publish on a regular basis. This is why they offer us a huge amount of additional documentation that includes detailed information on each of the 17 development goals, summaries of each goal through infographics and detailed information on their goals and actions, as well as hundreds of publications related to each goal in particular.
But that's not all: they also have a multitude of conferences, events and webinars so that anyone who wants to learn more about the goals or become more actively involved in their development and implementation can have an opportunity to do so. There are also specific high-level forums for the direct participation of member countries ultimately responsible for implementing the goals, as well as specific training and capacity building programmes for them. And, of course, they have their own social media presence through Facebook and Twitter, where they regularly report on all developments and news of possible interest to the general public.
Finally, in addition to all of the above, the UN also provides a range of resources for the scrupulous monitoring of member countries' conversations and dialogues around the goals, as well as the extent to which the goals are being met at any given moment. These monitoring tools include data explorers, interactive maps, country profiles, and stories told through data - which offer a variety of information and visualisations, whether promoted directly by the agency itself or by the community, or carried out by other institutions specialising in more specific issues such as energy or agriculture.
ITU Digital Development Indicators
Finally, a third good example of how to go a step beyond the traditional report can be seen in the statistics that the International Telecommunication Union (ITU) publishes regularly through its digital development measurement reports, which are not limited again to the publication of traditional reports, They offer a whole range of complementary alternatives including interactive reports, a complete multimedia kit to help us disseminate the main findings of the report and a whole series of events through which we can go deeper into different aspects of the results, ranging from international symposia, online seminars, expert group meetings or courses.
In addition, the ITU has created a series of interactive websites through which you can access the main digital development indicators and check their evolution over the last few years in the different countries, or review some more specific indicators such as those related to the cost of digital services, again including historical series and comparisons between different countries. Finally, they also offer us a complete data portal dedicated to collecting all the historical data of the main statistics and indicators available to the institution. And of course, we still have the option of accessing the raw data - including several specific time series and secondary indicators - to do our own analysis.
The above examples show how this shift in thinking about high-impact policy beyond reporting puts a whole new range of tools and methods at our disposal. These in turn will help us to breathe new life into the data we work with, moving from one-way procedures and reporting to increasingly collaborative processes in which data will flow between all participants at different stages of the process, from generating evidence about the problem we want to solve, building partnerships to find solutions, collaboratively developing those solutions, and finally channelling the actions needed to put them into practice.
Content prepared by Carlos Iglesias, Open data Researcher and consultan, World Wide Web Foundation.
Contents and points of view expressed in this publication are the exclusive responsibility of its author.
Evento
Medialab-Prado organizes the sixth edition of Data Journalism Workshop. This year, it will focus on the Sustainable Development Goals (SDG). The purpose of this event is to create stories based on data related to SDGs and the fight against climate change in Madrid.
For those interested in participating with their project, the deadline for submission is now open until March 12. Registration is free, but the projects must meet the following requirements: reuse data to create a story or journalistic tool; use reliable and localized data sources, and be focused on the topic selected in this edition. The list of selected projects will be published on March 20.
This event is aimed at those professionals - from developers and analysts to journalists - who want to work with data. It is composed of five sessions that will be held in the following months.
The first session, dedicated to free software, already took place on February 13-14. The second appointment will be held on the occasion of Open Data Day. Since 2017, the Data Journalism Workshop is linked to International Open Data Day celebration. For this reason, on March 2-3, Medialab organizes different activities to learn how to make open data requests into open data catalogs, how to use linked data, how to understand scraping techniques or how to delve into different aspects such as ontologies.
The second session agenda will include a talk on open data, within the framework of the Sustainable Development Goals, as well as six work stations, during the course of the day, where it will be showed how to leverage the potential of Madrid data catalog, how to search data on the Net or how to work with sources such as Wikidata.
Later, in the following session of Data Journalism workshop (April 17-22), the selected projects will be presented and the work teams will be established; every team will work from June 8 to 10, supporting by mentors and associated journalists. For all those interested in working on any of the projects presented, Medialab-Prado will open the call for contributors on March 6.
Finally, the workshop will end with the fifth session (June 22-24): the working groups can finalize the projects and show them to the rest of the participants.