Blog
Until relatively recently, talking about art and data in the same conversation might seem strange. However, recent advances in data science and artificial intelligence seem to open the door to a new discipline in which science, art and technology go hand in hand.

The cover image has been extracted from the blog https://www.r-graph-gallery.com and was originally created by Marcus Volz on his website.
The image above could be an abstract painting created by some modern art author and exhibited at the MoMA in New York. However, it is an image created with some R-code lines that use complex mathematical expressions. Despite the spectacularity of the resulting figure, the beautiful shape of the strokes does not represent a real form. But the ability to create art with data is not limited to generating abstract forms. The possibilities of creating art with code go much further. Here you are two examples:
Real art and representation of plants

With less than 100 lines of R code we can create this plant and infinite variations in terms of branches, symmetry and complexity. Without being an expert in plants and algae, I am sure that I have seen plants and algae similar to this in many occasions. With these representations, we just try to reproduce what nature creates naturally, taking into account physics and mathematics laws. The figures shown below have been created using the R code originally extracted from Antonio Sánchez Chinchón blog.

Variations of plants artificially created by R code and fractal expressions.
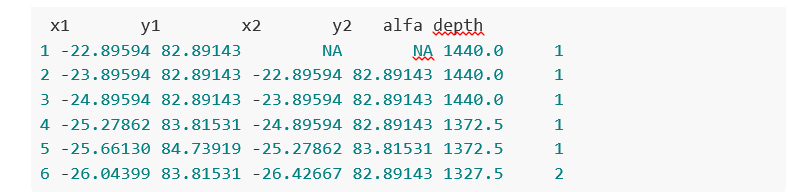
As an example, these are the data that make up some of the figures discussed above:
Photography and art with data
But it is not just possible to construct abstract figures or representations that imitate the forms of plants. With the help of data tools and artificial intelligence we can imitate, and even create new works. In the following example, we obtain simplified versions of photographs, using subsets of pixels from the original photograph. Let's see this example in detail.
We take a photograph of a bank of open images, in this case Wikimedia Commons website, such as the following:

By Finetooth - Own work, CC BY-SA 3.0, https://commons.wikimedia.org/w/index.php?curid=11692574
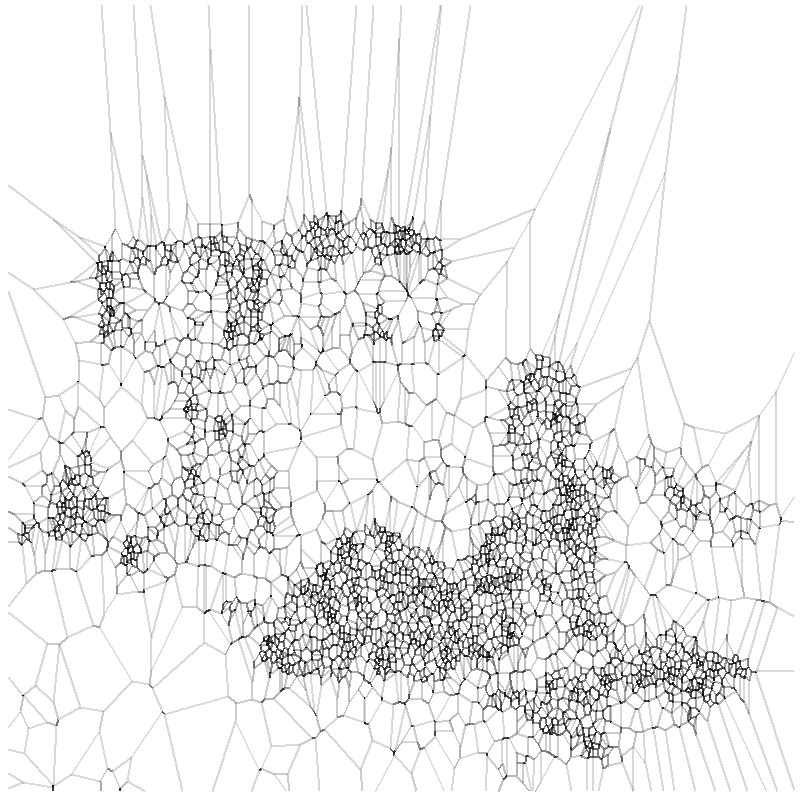
Next, we execute a relatively simple algorithm that generates polygonal shapes around the main pixels of the original image. In addition to a simple images treatment to turn this photograph into a flat black and white image, this algorithm applies a mathematical method called Voronoid diagram. When the subset of data (on which we apply the Voronoid diagram) is small, the result of the treatment is poor and we can barely distinguish the underlying form of the figure.
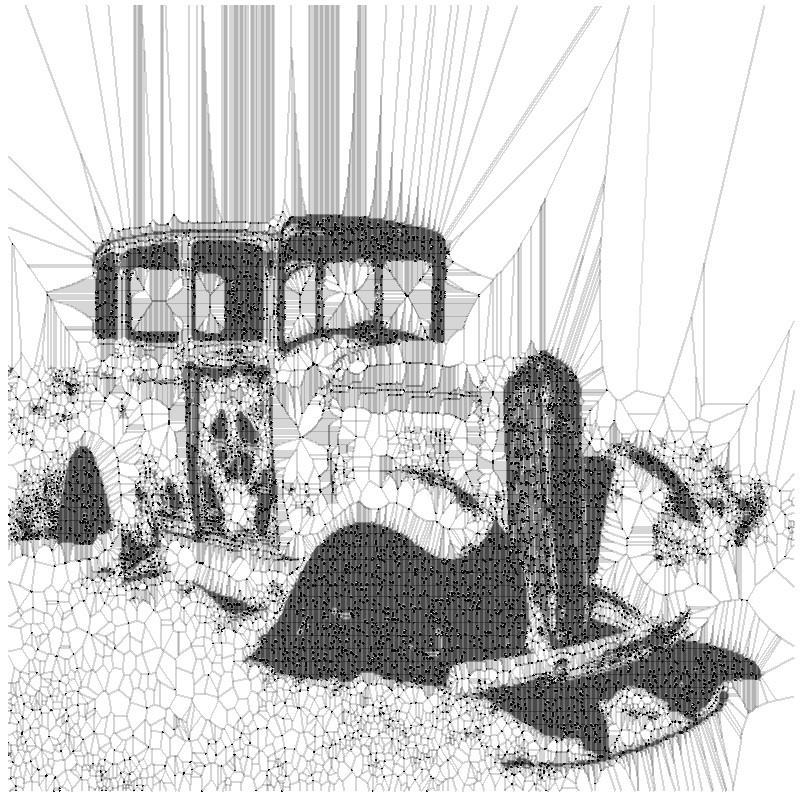
However, as we increase the subset of points to reproduce the initial photograph, we begin to find fascinating results. Finally, with less than 20% of all the points that make up the original image, we obtain a really beautiful and artistic result. This experiment is based on the original post by Antonio Sánchez Chinchón on his blog Fronkostin.
The ability to generate art with the powerful combination of mathematics and programming codes is absolutely powerful. In the following link it is possible to appreciate some of the most impressive works that exist in this art form. The author of this blog is Marcus Volz, researcher at the University of Melbourne. Marcus works with R to generate the figures in two dimensions and with Houdini for 3D and animation.
Content prepared by Alejandro Alija, expert in Digital Transformation and innovation.
Contents and points of view expressed in this publication are the exclusive responsibility of its author.
Empresa reutilizadora
Vizzuality use geospatial and big data to create digital products designed to empower people to make the right decisions and enable and encourage positive changes.
They work, together with NGOs, governments, corporations and citizens on challenges concerning the climate emergency, the global loss of biodiversity, supply-chain transparency and inequality.
Empresa reutilizadora
dotGIS is focused on the development of solutions and applications related to the management, integration and analysis of data with geospatial component.
Empresa reutilizadora
EpData is the platform created by Europa Press to facilitate the use of public data by journalists, with the aim of both enriching news with graphics and context analysis and verifying the figures offered by various sources. The database is maintained by a multidisciplinary team of computer scientists and journalists who use new technologies and data analysis to improve the efficiency of data consumption and find relevant and informative patterns in the data.
Evento
In 2018, the cities of Barcelona and Kobe celebrate 25 years of twinning agreement, and to commemorate it, both municipalities have launched the World Data Viz Challenge 2018 Barcelona-Kobe.
Promoting policy improvements through data visualizations
A similar challenges have been launched in each city: participants will have to generate visualizations based on open data to show the challenges of an intelligent city, which can be useful to optimize public policies. In the case of Barcelona, it will be necessary to use at least one of the more than 440 datasets included in Open Data BCN. These datasets are classified into five major themes: city and services, territory, population, administration and economy and business.
A group of experts will select the 10 best datavizs or infographics. These datavizs will be presented at the Smart City Expo World Congress 2018, on November 14. This international event has been held in Barcelona since 2011, with the aim of promoting innovation and identifying opportunities to create smart cities that respond to the needs of citizens.
Pre-registration is open until October 26
Any citizen can participate. It is only necessary to have "the skills and capabilities to understand, analyze and visualize open data”
Those interested in joining the World Data Viz Challenge 2018 Barcelona-Kobe must pre-register before October 26, by filling out this form. The deadline to submit the visualizations will be from October 2 to November 2 through this other form. The works, which may be presented in Catalan, Spanish or English, must be carried out by a maximum of two people. You can consult the full terms of participation in this link.
With this challenge, the Barcelona City Council seeks to encourage the use of open data from smart cities and tools and techniques for analyzing data and visualizations. In addition, the contest will also serve to develop the critical thinking of citizens, who are a fundamental piece to promote policies that improve our environment.
Evento
DataLab Madrid organizes a new edition of Visualizar'18, a data visualization workshop. Its objective is to create a spaces for collaborative work, knowledge exchange and theoretical and practical training to investigate the social, cultural and artistic implications of data culture, opening up avenues for participation and criticism.
The meeting will take place from September 21 to October 5 at Medialab Prado. On this occasion, the event will revolve around the power of personal data. Citizens’ concerns about this issue continue growing in a year marked by the entry into force of GDPR or scandals such as Cambridge Analytica. Therefore, it is a good opportunity to develop projects that enrich the debate on privacy and the use of our personal data.
The workshop will have 3 parts: an opening day, a workshop focused on the development of ideas and a final presentation. The opening day will take place on Friday, September 21 and Saturday, September 22. Those days, organizers will introduce the workshop, the selected projects and the teams’ members, and the exhibition The Glass Room will be inaugurated. The following days, it will be time for the workshop, where the different groups will work together for developing their projects. The results will be presented on Friday, October 5.
The 6 selected projects are:
- A-9. Black Eyes: The project consists of a video-installation whit a map that integrates roads from all over the world. The user can interact directly with the work by selecting any point on the map to view real-time imagen. The objective is to raise awareness about the power of information and its influence in a globalized world.
- Microblogs and micropolitics: Participants will be able to export, scrape, encode and visualize, in an original way, the personal data that they daily produce on their public Twitter timeline. If time permits, the process will be repeated with data from public institutions and elected politicians.
- My [inte] gration. This project seeks to change the perception of the migration crisis based on the data. Through big data and thick data technologies, the rights and needs of migrants, refugees, minorities and vulnerable communities will be analyzed, with the ultimate goal of creating spaces, cities and inclusive policies. Although the proposal focuses on the city of Madrid, it is intended to be scaled to other cities and regions.
- Bad Data Challenge. During this Project, the participants will investigate erroneous data problems (that is, data sets that contain lost data, incompatible data, corrupt data, outdated data, etc.), using various tools and methodologies.
- Personal Data Game. This project want to create a board game with modeled visualizations of personal data in order to raise awareness about this topic. Those data (physical characteristics, identification properties, social features, political ideas, etc.) will give rise to attractive objects that complement each other or not. The objective of the game is to cross the board keeping the greatest amount of personal data, protecting them from the enemy (who can steal or exchange them).
- The big G and his henchmen. Those people who participate in this project will be able to develop a web tool to know what personal information store the different applications. Once this information is gathered, the participants will develop a webcomic to show how the devices collect data from users through mobile devices.
In addition, during the event various lectures and workshops will take place, as well as a meeting of citizen initiatives for privacy and personal data security.
Those people who wish to participate in visualize'18, can still sign up as collaborators. Registration, which is free up to 30 participants, will be open until Wednesday 19 at 23:59 CEST.
Noticia
If we analyze it with perspective, the concept of open data is not so revolutionary or novel in itself. On one hand, the philosophy of openness and/ or re-use on which open data are based had long been established between us before its formal definition. On the other hand, the objectives of the open data movement are also very similar to those promoted by other communities which could in a certain way be considered similar, such as open source, open hardware, open content, open government or open science, among many others..
However, both the term "open data" and the community associated with it can both be considered relatively recent, beginning to gain popularity about ten years ago when a group of open government advocates established the eight principles of government open data during the meeting that took place in Sebastopol (California) in December 2007. Next, official open data initiatives of reference were launched by the United States (data.gov)) and the United Kingdom (data.gov.uk) , giving it the final push needed to become a new movement with its own identity.
Since then, the global open data community has made enormous progress, but it is also still far away from its initial objectives. At the same time, data in general is consolidating itself as the most valuable asset that most organizations have today. That is why, on the tenth anniversary since its formalization, the open data community reflects on its role in the past - looking at the achievements obtained so far - and also on its role in the upcoming future dominated for the data.
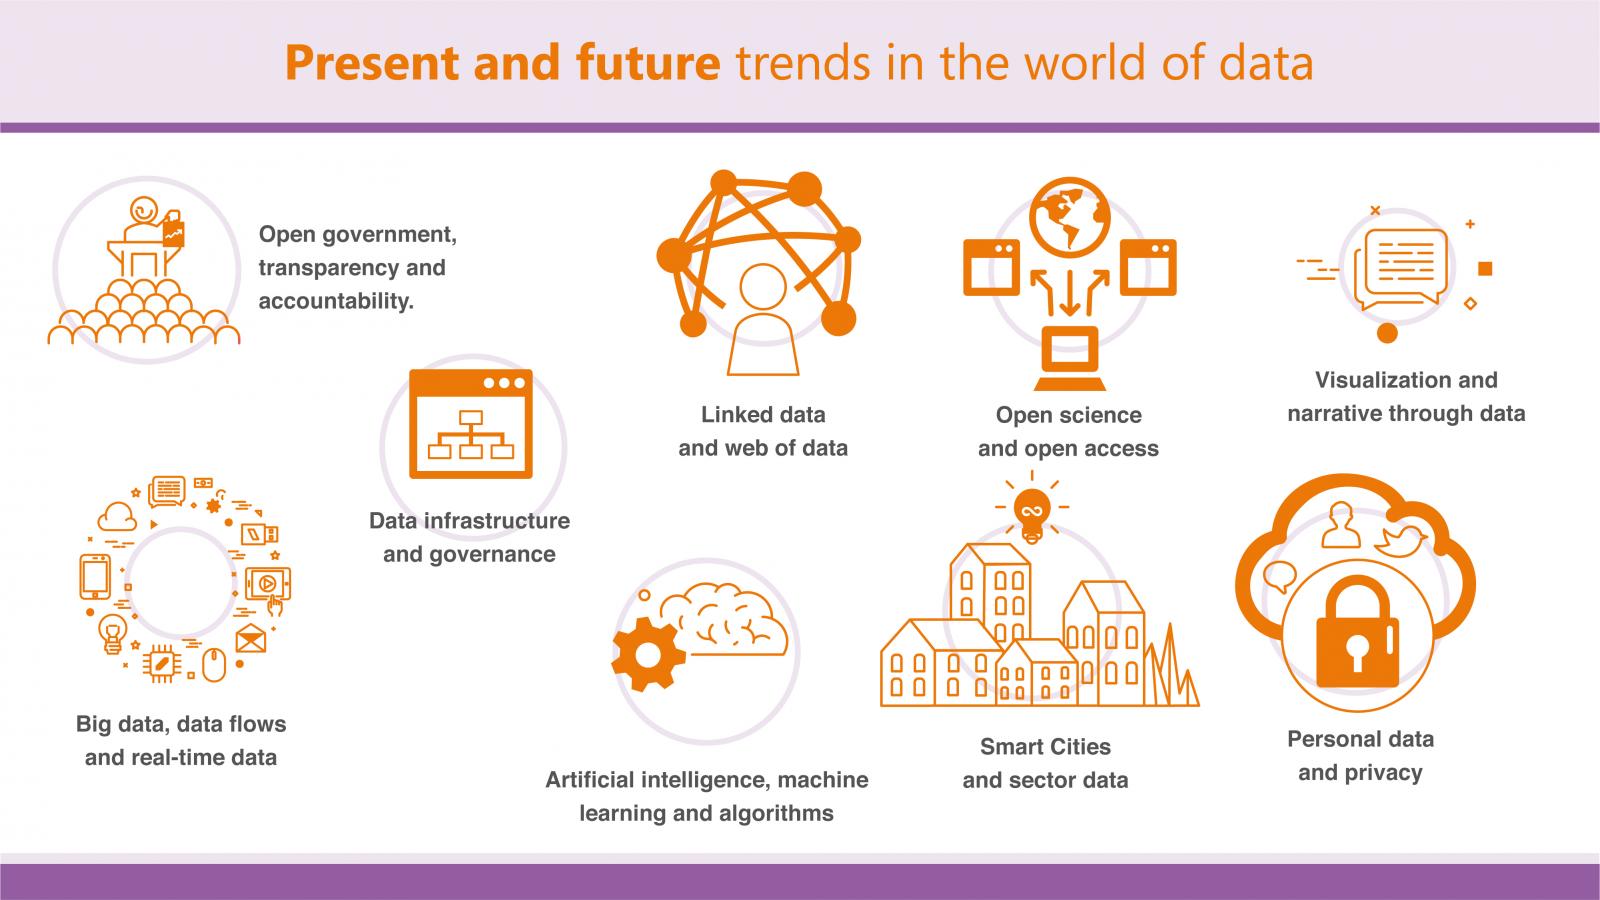
In this context, it makes sense to briefly review some of the current trends in the data world and what role open data could play in each of them, starting with those that are more related:
Open government, transparency and accountability
Although freedom of information and open data communities sometimes differ in their strategies, both share the common goal of facilitating citizens access to the information needed to improve transparency and public services. The potential benefit that can be obtained from the collaboration between both groups is, therefore, very significant, evolving from the right to information to the right to data. Nevertheless, after several efforts, collaboration has not yet been achieved as effectively as it would be desirable and there are also doubts about whether open data is really being used as an effective tool for transparency or as an excuse for not making a deeper transparency exercise.
Linked data and web of data
The goal of the Web of data is being able to create explicit connections between those data that are related to each other and those already available on the web, but not conveniently related. Not all linked data necessarily needs to be open, but it is clear from the very purpose of the linked data that the combination of both is what would let reach its maximum joint potential, as it is already the case, for example, with some large global data bases such as DBPedia, LexInfo, Freebase, NUTS or BabelNet.
Open Science and Open Access
Ironically, at this very moment in history when we have the best tools and technologies to distribute science and knowledge throughout the world, we are very busy putting new barriers to the use of those valuable data and that knowledge. The thriving movement of open access bet precisely to apply again the criteria of open data to scientific production, so that it becomes an intangible asset and thus accelerate our collaborations ability to generate new achievements for humanity.
Visualization and narrative through data
As more and more data is available to any organization or individual, the next key step will be providing the means so the value can be extracted from them. The ability, based on specific data, to be able to understand them, process them, extract their value and communicate it adequately, will be a very demanded skill in the next decade. The elaboration of stories from data is nothing more than a structured approach when communicating the knowledge that the data transmit uthrough three key elements: data, visualizations and narrative.
Big data, data flows and real-time data
In the present, organizations have to deal with a growing volume and variety of data. Big data processing techniques allow them to analyze these large volumes of information to reveal different patterns and correlations that will serve to improve decision-making processes. However, the great challenge is still how to perform this process efficiently on continuous data flows in real time. While big data promises an unprecedented analytical capacity, its combination with the open data philosophy will allow that power to be shared by all improving public services.
Artificial intelligence, machine learning and algorithms
Although artificial intelligence is increasingly present in several aspects of our daily lives, we could consider that we are still at a very early stage of what could become a global revolution. Artificial intelligence already has a relative success in some tasks that traditionally had always required of what we consider human intelligence to be carried out. For this to be possible, data-powered algorithms that support these automated systems are also necessary. A greater availability and quality of the open data will serve to feed these algorithms and, at the same time, also be able to improve them and audit their correct operation
Smart Cities and sector data
The open data movement is also in a period of transition in which they are beginning to focus efforts on publishing the data necessary to respond to specific problems instead of simply trying to publish any data in general. This thematic or sectorial approach is generally more efficient because it not only requires fewer resources for its execution, but is also more focused on the user needs and final beneficiaries of the data. In this regard, the specific area of Smart Cities or open cities stands out as an example of the integration of different technologies and data philosophies to improve the services offered to citizens.
Personal data and privacy
Today we spend a good part of our lives online and that is contributing to generate a lot of information about us. Thanks to these data we can enjoy new services of great utility, but this also have an important negative counterpart. In the case of a data leak, important personal information about our economic capacity, political positioning or consumption habits, among others, could be public. On the other hand, there are also increasingly unethical uses by some companies. Using the same principles of open data there are new forms of self-management of our personal data to achieve a balance between regaining control of our own data and the benefits we can obtain through exploitation, always with our express knowledge and consent.
Data infrastructures and data governance
The day-to-day management of data begins to be a task as valuable as complex for any organization in general, but particularly complicated for the administration due to its own volume and the need to combine different management models that also correspond to the different administrative levels. To face this management task with guarantees, it will be necessary to invest in the appropriate data infrastructures, both at a physical and management level. Establishing the technological frameworks and data governance models needed to be shared with agility will be an essential requirement to achieve an efficient management model in the future.
Taking into account the above aspects, it is possible that in the not too distant future we will stop treating open data as the only possible solution for the challenges posed to governments and begin to treat it as another key tool at our disposal that will be used in a more diluted and integrated way together with the other current trends in the data world and the openness that we have reviewed.
Evento
The international data visualisation programme Visualizar (Visualise), organised by MediaLab Prado, this year celebrates its tenth anniversary with a symposium open to the public on September 15 and 16 and a practical workshop dedicated to Migrations that will be developed over the second half of the month.
On Friday September 15 the public symposium starts, which will last until Saturday 16, and includes project presentations, presentation of collaborators and team training. The symposium will have a talk on Visualizar: 10 years, by José Luis de Vicente, founder of Visualizar. The presentation from Festival Transeuropa, talks on “Artistic Data Visualisation: new narrative forms” and “Code for South Africa”, from Lucila Rodríguez Alarcón and Hannah Williams, respectively, as well as participation from Julie Freeman, member of the Open Data Institute.
On Saturday September 16 the presentation of projects and collaborators will take place, as well as the methodology of projects: text editor, Markdown and Github. During the second day of the symposium Visulaizar’17 different national and international specialists in data visualisation will attend including Pau García and Polo Trías Coica (Domestic Data Streamers), José Luis Esteban Aparicio (Grupo Haskell Madrid), Álvaro Anguix and Javier Rodrigo (gvSIG), Gonzalo Fanjul (PorCausa), Samuel Granados (graphic editor at The Washington Post) and Alison Killing (architect and visual artist).
The following workshop, dedicated to the migration of people and the migration of data, made in partnership with PorCausa, aims to develop the eight selected projects between September 17 and 29, whose results will be presented publicly on September 30. To develop the projects there is a team of international and national mentors: graphic editors, data scientist, visualizers, cartographers and interaction designers, among others. This workshop focuses on the features, processes and behaviours of migration understood as a movement across the world territory -local, global or glocal- by species (flora and fauna), people, data or substances, with the aim of giving greater visibility to migrations, to decipher stories that hide numbers and connect data to creativity and technology
Visualizar is an international workshop for prototyping data visualisation projects from Medialab-Prado who advocates for developing the field of data visualisation. Since 2007, the programme Visualizar has researched social, cultural and artistic implications of data culture, and proposes methodologies to make them more understandable and to open up ways to participate and critique.
More information: Visualizar´17
Documentación
There is increasingly more information, to such extent that the current society lives surrounded by data. Nevertheless, one of the most common criticisms of this mass of information is its lack of usability. It is not only a matter of publishing data on the web, but we should focus on their treatment, re-use and consumption by the end user. Only when we approach them and apply an interpretation they make sense and become knowledge.
In this technological context, data exploitation has evolved in the last decades to design interpretation mechanisms that are increasingly robust and affordable. And among these exploitation mechanisms, the most important is data visualization.
In this framework, Iniciativa Aporta has elaborated the report “Data visualization: definition, technologies and tools”, a handbook based on the analysis on two distinct but complementary aspects. On one hand, the visualization technologies are explained in detail as frameworks and coding libraries that allow the construction of applications and data based services; including exclusively the cutting-edge web technology and especially that which is built on standards, such as HTML5 (Canvas), SVG and WebGL.
On the other hand, this documents takes a journey through the available visualization platforms, analysing the applications that allow the construction of dashboards and comprehensive interactive visualizations. Those platforms that are more web-oriented and can be applied to the exploitation of open data, those coming from the world of BI and data analysis, are presented in detail: Tableau Soft, Qlik and Tabulae. Or, failing this, open data publishing tools that incorporate certain features of visualization: CKAN and Socrata.
Currently the number of tools and platforms for data visualization that can be accessed is very extensive. Thus, this report includes together with these instruments a set of real examples, some of them more closely linked to the data analysis and visualizations, whereas others provide support to data publication, which add to their functionality capabilities of graphic representation of data for their consumption.
In order to help in the treatment of such information and transformation into more readable formats, the report includes seven examples of data visualizations, from public sector and independent entities both national and international. It concludes analysing future trends on data treatment: Visualization and large volumes of data, visualizations that can be built by the end user and the development of 3D visualization technologies.
Nowadays, visualization is a powerful tool to discover and understand the logic behind a dataset, open or not, and to share this interpretation with others from an objective point of view. For this reason, this report is an opportunity to show to stakeholders of the national open data community the way to treat and transform the raw material into a useful resource for any purpose.
Noticia
En noviembre de 2013 nacía OpenDataMonitor, una iniciativa panaeuropea que permitirá identificar y caracterizar los conjuntos de datos públicos puestos a disposición en 25 países europeos a través de una serie de herramientas que están siendo desarrolladas en el marco del proyecto. Gracias a diferentes métodos de visualización y analítica, el usuario final tendrá la oportunidad de conocer en mayor profundidad los repositorios de datos abiertos a escala local, regional, nacional y europea.
Los equipos integrantes de OpenDataMonitor finalizarán sus trabajos en el plazo de un año. Hasta la fecha se han ido presentando los avances alcanzados a través de diferentes publicaciones disponibles en la página web del proyecto, entre las que cabe resaltar las siguientes:
- Armonización de topologías, catálogos y metadatos
Este estudio muestra una fotografía actualizada del movimiento de datos abiertos, principalmente en Europa, identifica buena parte de los retos a los que se enfrenta la comunidad open data y propone posible soluciones, especialmente en aspectos clave como son la necesaria armonización de vocabularios y de esquemas de representación de la información.
- Buenas prácticas de visualización, cuadros de mando y métricas
El documento presenta un conjunto de métricas que se entienden necesarias para la comprensión de las tendencias open data, detalla técnicas de visualización que se consideran relevantes para este fin, así como posibles combinaciones de las visualizaciones que se presentarán en el futuro cuadro de mandos a desarrollar.
- Informe de stakeholders en el campo de datos abiertos (1º parte, septiembre 2014).
Este informe ofrece una fotografía general de los agentes involucrados en el movimiento de datos abiertos: qué papel juegan, qué les interesa y qué requisitos debe cumplir el ecosistema open data para que los reutilizadores de los datos puedan obtener el máximo provecho de ellos.
En la iniciativa participan siete entidades europeas expertas en materia open data, visualización de la información e ingeniería de software. Entre los colaboradores se encuentra el Proyecto Aporta, encargado de la investigación de las topologías de datos abiertos; del control de las funcionalidades y usabilidad de la infraestructura, así como de la divulgación y formación de los usuarios finales de la herramienta de OpenDataMonitor.