4 documents found
Characteristics of the Spanish University students and most demanded degrees
1. Introduction
Visualizations are graphical representations of data that allow to transmit in a simple and effective way the information linked to them. The visualization potential is very wide, from basic representations, such as a graph of lines, bars or sectors, to visualizations configured on…
- Data exercises

Help videos for data reusers in datos.gob.es
In a platform such as datos.gob.es, where the frequency of dataset updates is constant, it is necessary to have mechanisms that facilitate massive and automatic queries.
In datos.gob.es we have an API and a SPARQL point to facilitate this task. Both tools allow querying the metadata associated with…
- Guides

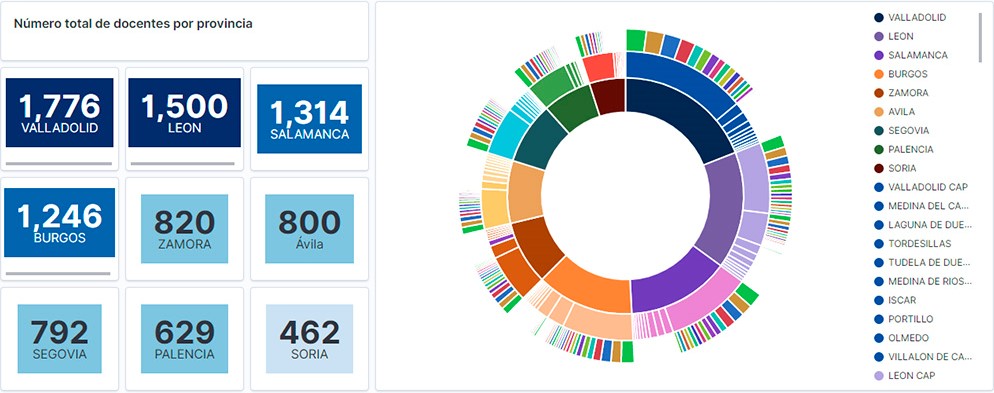
Teachers of public schools in Castilla y León
1. Introduction
Data visualization is a task linked to data analysis that aims to graphically represent underlying data information. Visualizations play a fundamental role in the communication function that data possess, since they allow to drawn conclusions in a visual and understandable way,…
- Data exercises
Data-driven education technology to improve learning in the classroom and at home
The pandemic that originated last year has brought about a significant change in the way we see the world and how we relate to it. As far as the education sector is concerned, students and teachers at all levels have been forced to change the face-to-face teaching and learning methodology for a…
- Reports and studies