9 documents found
A practical introductory guide to exploratory data analysis in Python
The following presents a new guide to Exploratory Data Analysis (EDA) implemented in Python, which evolves and complements the version published in R in 2021. This update responds to the needs of an increasingly diverse community in the field of data science.
Exploratory Data Analysis (EDA)…
- Guides

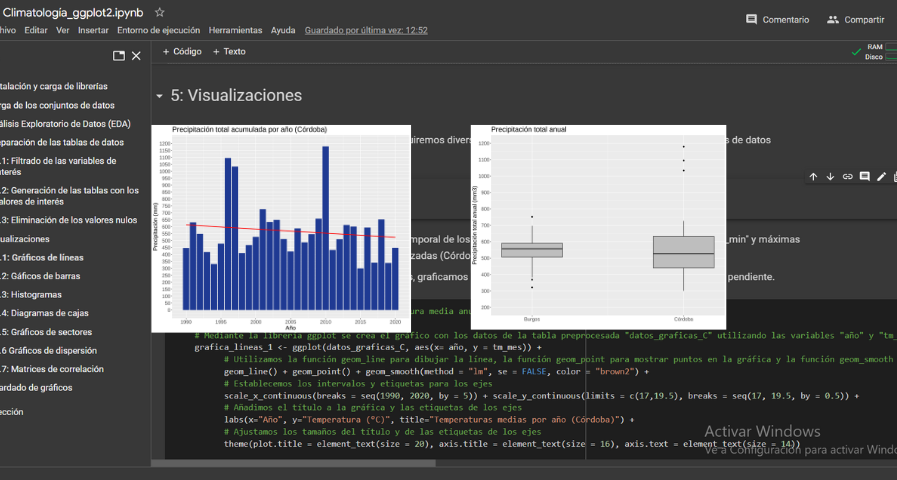
Analysis of meteorological data using the "ggplot2" library
1. Introduction
Visualizations are graphical representations of data that allow the information linked to them to be communicated in a simple and effective way. The visualization possibilities are very wide, from basic representations, such as a line chart, bars or sectors, to visualizations…
- Data exercises
Analysis of toxicological findings in road traffic accidents
1. Introduction
Visualizations are graphical representations of data that allows comunication in a simple and effective way the information linked to it. The visualization possibilities are very wide, from basic representations, such as a graph of lines, bars or sectors, to visualizations…
- Data exercises

Characteristics of the Spanish University students and most demanded degrees
1. Introduction
Visualizations are graphical representations of data that allow to transmit in a simple and effective way the information linked to them. The visualization potential is very wide, from basic representations, such as a graph of lines, bars or sectors, to visualizations configured on…
- Data exercises

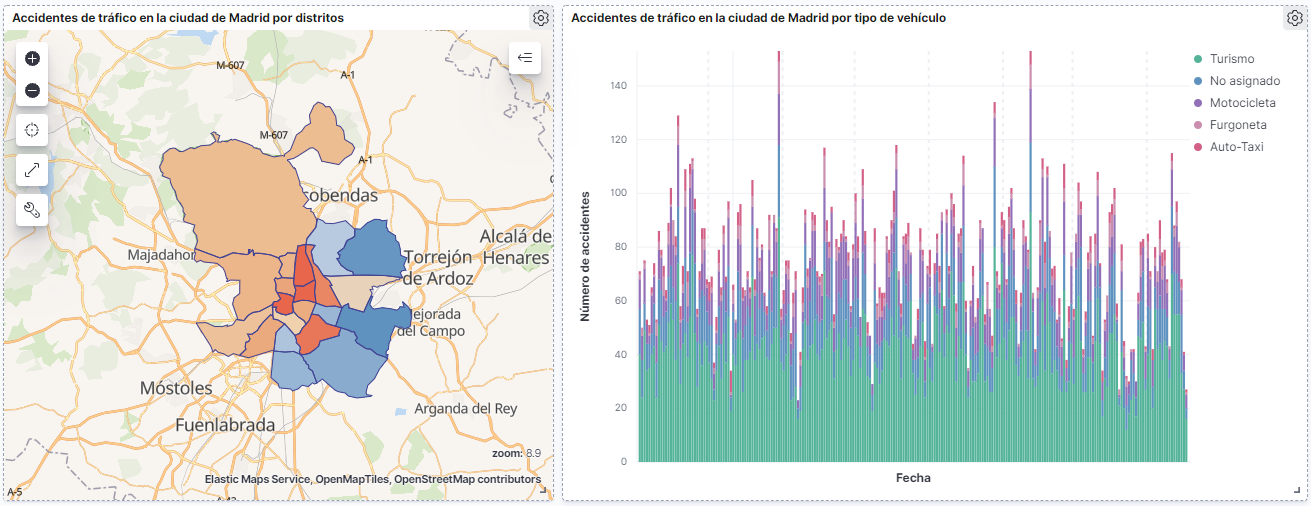
How many accidents occur in the city of Madrid?
1. Introduction
Data visualization is a task linked to data analysis that aims to graphically represent underlying data information. Visualizations play a fundamental role in the communication function that data possess, since they allow to drawn conclusions in a visual and understandable way,…
- Data exercises
Characterization of the employment demand and registered contracting in Spain
1. Introduction
Data visualization is a task linked to data analysis that aims to represent graphically the underlying information. Visualizations play a fundamental role in data communication, since they allow to draw conclusions in a visual and understandable way, also allowing detection of…
- Data exercises

A practical introductory guide to exploratory data analysis
Before performing data analysis, for statistical or predictive purposes, for example through machine learning techniques, it is necessary to understand the raw material with which we are going to work. It is necessary to understand and evaluate the quality of the data in order to, among other…
- Guides
How to generate value from data: formats, techniques and tools to analyse open data
In the digital world, data becomes a fundamental asset for companies. Thanks to them, they can better understand their environment, business and competition, and make convenient decisions at the right time.
In this context, it is not surprising that an increasing number of companies are looking for…
- Reports and studies

Open data and health: technological context, stakeholders and legal framework
Spain is the second country with the highest life expectancy in the world, only behind Japan. Spaniards live 83 years on average. This positive data is stained by a negative one: the low birth rate, which is leading us towards a population aging. This situation means that we need a more efficient…
- Reports and studies
