5 documents found
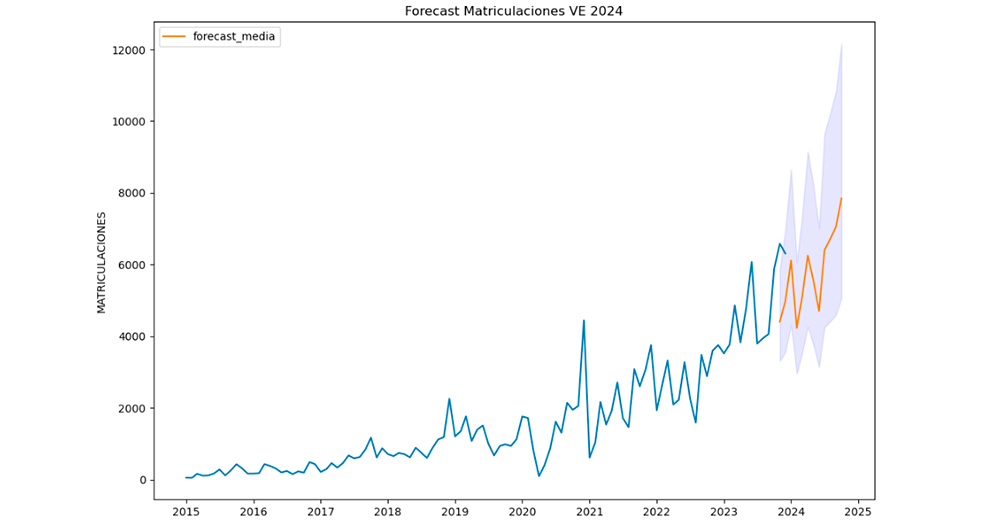
Road to electrification: Deciphering electric vehicle growth in Spain through data analytics
1. Introduction
Visualisations are graphical representations of data that allow to communicate, in a simple and effective way, the information linked to the data. The visualisation possibilities are very wide ranging, from basic representations such as line graphs, bar charts or relevant metrics,…
- Data exercises
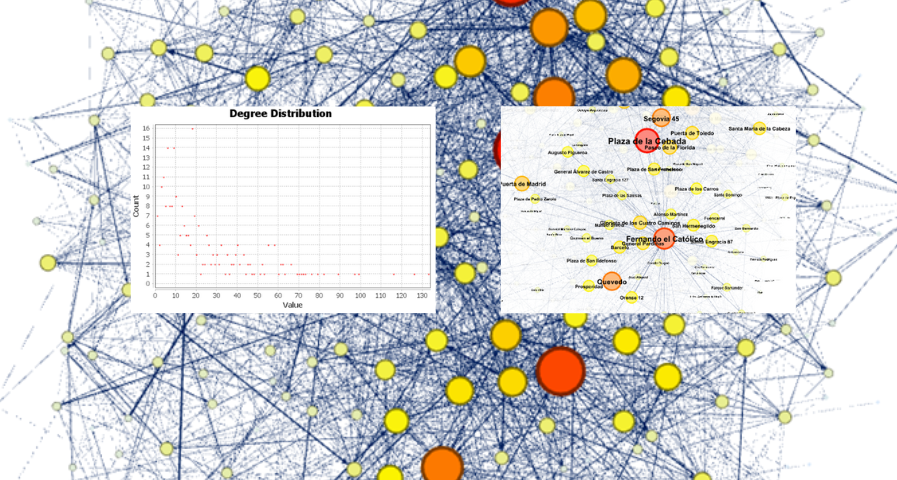
Analysis of travel networks in BICIMAD
1. Introduction
Visualizations are graphical representations of data that allow the information linked to them to be communicated in a simple and effective way. The visualization possibilities are very wide, from basic representations, such as line, bar or sector graphs, to visualizations…
- Data exercises
Analysis of toxicological findings in road traffic accidents
1. Introduction
Visualizations are graphical representations of data that allows comunication in a simple and effective way the information linked to it. The visualization possibilities are very wide, from basic representations, such as a graph of lines, bars or sectors, to visualizations…
- Data exercises

Practical guide for improving the quality of open data
When publishing open data, it is essential to ensure its quality. If data is well documented and of the required quality, it will be easier to reuse, as there will be less additional work for cleaning and processing. In addition, poor data quality can be costly for publishers, who may spend more…
- Guides

Share-PSI 2.0: Las mejores prácticas para compartir información del sector público
Iniciativa Aporta – Datos.gob.es ha actualizado y enriquecido las 56 mejores prácticas para compartir información del sector público que fueron recopiladas por la red temática Share-PSI 2.0. El repositorio de Share-PSI 2.0. concebido para servir de orientación a todas las organizaciones públicas a…
- Guías
