Entrevista
In recent years, artificial intelligence (AI) has gone from being a futuristic promise to becoming an everyday tool: today we live with language models, generative systems and algorithms capable of learning more and more tasks. But as their popularity grows, so does an essential question: how do we ensure that these technologies are truly reliable and trustworthy? Today we are going to explore that challenge with two invited experts in the field:
- David Escudero, director of the Artificial Intelligence Center of the University of Valladolid.
- José Luis Marín, senior consultant in strategy, innovation and digitalisation.
Listen to the podcast (availible in spanish) completo
Summary / Transcript of the interview
1. Why is it necessary to know how artificial intelligences work and evaluate this behavior?
Jose Luis Marín: It is necessary for a very simple reason: when a system influences important decisions, it is not enough that it seems to work well in an eye-catching demo, but we have to know when it gets it right, when it can fail and why. Right now we are already in a phase in which AI is beginning to be applied in such delicate issues as medical diagnoses, the granting of public aid or citizen care itself in many scenarios. For example, if we ask ourselves whether we would trust a system that operates like a black box and decides whether to grant us a grant, whether we are selected for an interview or whether we pass an exam without being able to explain to us how that decision was made, surely the answer would be that we would not trust it; And not because the technology is better or worse, but simply because we need to understand what is behind these decisions that affect us.
David Escudero: Indeed, it is not so much to understand how algorithms work internally, how the logic or mathematics behind all these systems works, but to understand or make users see that this type of system has degrees of reliability that have their limits, just like people. People can also make mistakes, they can fail at a certain time, but you have to give guarantees for users to use them with a certain level of security. Providing metrics on the performance of these algorithms and making them appear reliable to some degree is critical.
2. A concept that arises when we talk about these issues is that of explainable artificial intelligence . How would you define this idea and why is it so relevant now?
David Escudero: Explainable AI is a technicality that arises from the need for the system not only to offer decisions, not only to say whether a certain file has to be classified in a certain way or another, but to give the reasons that lead the system to make that decision. It's opening that black box. We talk about a black box because the user does not see how the algorithm works. It doesn't need it either, but it does at least give you some clues as to why the algorithm has made a certain decision or another, which is extremely important. Imagine an algorithm that classifies files to refer them to one administration or another. If the end user feels harmed, he needs to have a reason why this has been so, and he will ask for it; He can ask for it and he can demand it. And if from a technological point of view we are not able to provide that solution, artificial intelligence has a problem. In this sense, there are techniques that advance in providing not only solutions, but also in saying what are the reasons that lead an algorithm to make certain decisions.
Jose Luis Marín: I can't explain it much better than David has explained it. What we are really looking for with explainable artificial intelligence is to understand the reason for those answers or those decisions made by artificial intelligence algorithms. To simplify it a lot, I think that we are not really talking about anything other than applying the same standards as when those decisions are made by people, whom we also make responsible for the decisions. We need to be able to explain why a decision has been made or what rules have been followed, so that we can trust those decisions.
3. How is this need for explainability and rigorous evaluation being addressed? Which methodologies or frameworks are gaining the most weight? And what is the role of open data in them?
Jose Luis Marín: This question has many dimensions. I would say that several layers are converging here. On the one hand, specific explainability techniques such as LIME (Interpretable Model-agnostic Explanations) or SHAP (SHapley Additive exPlanations) or many others. I usually follow, for example, the catalog of reliable AI tools and metrics of the OECD's Observatory of Public Policies on Artificial Intelligence, because there progress in the domain is recorded quite well. But, on the other hand, we have broader evaluation frameworks, which do not only look at purely technical issues, but also issues such as biases, robustness, stability over time and regulatory compliance. There are different frameworks such as the NIST (National Institute of Standards and Technology) risk management framework, the impact assessment of the algorithms of the Government of Canada or our own AI Regulations. We are in a phase in which a lot of public and private initiatives are emerging that will help us to have better and better tools.
David Escudero: For research, it is still a fairly open field. There are methodologies, indeed, but new models based on neural networks have opened up a huge challenge. The artificial intelligence that had been developed in the years prior to the generative AI boom, to a large extent, was based on expert systems that accumulated a lot of knowledge rules about the domain. In this type of technology, explainability was given because, since what was done was to trigger a series of rules to make decisions, following backwards the order in which the rules had been applied, you had an explanation; But now with neural systems, especially with large models, where we are talking about billions and billions of parameters, these types of approximations have become impossible, unapproachable, and other types of methodologies are applied that are mainly based on knowing, when you train a machine learning model, what are the properties or attributes in the training that lead you to make one decision or another. Let's say, what are the weights of each of the properties they are using.
For example, if you're using a machine learning system to decide whether to advertise a certain car to a bunch of potential customers, the machine learning system is trained based on an experience. In the end, you are left with a neural model where it is very difficult to enter, but you can do it by analyzing the weight of each of the input variables that you have used to make that decision. For example, the person's income will be one of the most important attributes, but there may be other issues that lead you to very important considerations, such as biases. Imagine that one of the most important variables is the gender of the person. There you enter into a series of considerations that are delicate. In other types of algorithms, for example, that are based on images, an explainable AI algorithm can tell you which part of the image was most relevant. For example, if you are using an algorithm to, based on the image of a person's face - I am talking about a hypothetical, a future, which would also be an extreme case - decide whether that person is trustworthy or not. Then you could look at what traits of that person artificial intelligence is paying more attention to, for example, in the eyes or expression. This type of consideration is what AI would make explainable today: to know which are the variables or which are the input data of the algorithm that take on greater value when making decisions.
This brings me to another part of your question about the importance of data. The quality of the training data is absolutely important. This data, these explainable algorithms, can even lead you to derive conclusions that indicate that you need data of more or less quality, because it may be giving you some surprising result, which may indicate that some training or input data is deriving outputs and should not. Then you have to check your own input data. Have quality reference data like you can find in datos.gob.es. It is absolutely essential to be able to contrast the information that this type of system gives you.
José Luis Marín: I think open data is key in two dimensions. First, because they allow evaluations to be contrasted and replicated with greater independence. For example, when there are validation datasets that are public, it not only assesses who builds the system, but also that third parties can evaluate (universities, administrations or civil society itself). That openness of evaluation data is very important for AI to be verifiable and much less opaque. But I also believe that open data for training and evaluation also provides diversity and context. In any minority context in which we think, surely large systems have not paid the same attention to these aspects, especially commercial systems. Surely they have not been tested at the same level in majority contexts as in minority contexts and hence many biases or poor performances appear. So, open datasets can go a long way toward filling those gaps and correcting those problems.
I think that open data in explainable artificial intelligence fits very well, because deep down they share a very similar objective, related to transparency.
4. Another challenge we face is the rapid evolution in the artificial intelligence ecosystem. We started talking about the popularity of chatbots and LLMs, but we find that we are still moving towards agentic AI, systems capable of acting more autonomously. What do these systems consist of and what specific challenges do they pose from an ethical point of view?
David Escudero: Agent AI seems to be the big topic of 2026. It is not such a new term, but if last year we were talking about AI agents, now we are talking about agent AI as a new technology that coordinates different agents to solve more complex tasks. To simplify, if an agent serves you to carry out a specific activity, for example, to book a plane ticket, what the agent AI would do is: plan the trip, contrast different offers, book the plane, plan the outward trip, the stay, again the return and, finally, evaluate the entire activity. What the system based on agent AI does is coordinate different agents. In addition, with a nuance. When we talk about the word agéntica – which we don't have a very direct translation in Spanish – we think of a system that takes the initiative. In the end, it is no longer just you who, as a user, ask artificial intelligence for things, but AI is already capable of knowing how it can solve things. It will ask you for information when it needs it and will try to adapt to give you a final solution as a user, but more or less autonomously, making decisions in intermediate processes.
Here precision and explainability are fundamental because a very important challenge is opened again. If at any given moment one of these agents used by the agentic AI fails, the effect of summing errors can be created and in the end it ends up like the phone smashed. From one system to another, from one agent to another, information is passed and if that information is not as accurate as it should be, in the end the solution can be catastrophic. Then new elements are introduced that make the problem even more exciting from a technological point of view. But we also have to understand that it is absolutely necessary, because in the end we have to move from systems that provide a very specific solution for a very particular case to systems that combine the output of different systems to be a little more ambitious in the response given to possible users.
Jose Luis Marín: Indeed. The moment we go from a type of system that, in principle, we give the "ability to think" about the actions that should be done and tell us about them, to other systems that it is as if they have hands to interact with the digital world - and we begin to see systems that even interact with the physical world and can execute those actions, that do not stop at telling you or recommending them to you – very interesting opportunities open up. But the complexity of the evaluation is also multiplied. The problem is no longer just whether the answer is right or wrong, but it is beginning to be who controls what the system does, what margin of decision it has, who supervises it and, above all, who responds if something goes wrong, because we are not only talking about recommendations, we are talking about actions that sometimes may not be so easy to undo. This leads to new or at least more intense risks: if traceability is lost in the execution of actions that were not foreseen or that should not have occurred at a certain time; or there may be misuses of information, or many other risks. I believe that agentic AI requires even more governance and a much more careful design aligned with people's rights.
5. Let's talk about real applications, where do you see the most potential and need for evaluation and explainability in the public sector?
Jose Luis Marín: I would say that the need for evaluation and explainability is greater where AI can influence decisions that affect people. The greater the impact on rights or opportunities or, even on trust in institutions, the greater this demand must be. If we think, for example, of areas such as health, social services, employment, education... In all of them, logically, the need for evaluation in the public sector is unavoidable.
In all cases, AI can be very useful in supporting decisions to achieve efficiencies in multiple scenarios. But we need to know very well how it behaves and what criteria are being used. This doesn't just affect the most complex systems. I think we have to look at the systems that at first may seem more or less sensitive at first glance, such as virtual assistants that we are already starting to see in many administrations or automatic translation systems... There is no final decision made by the AI, but a bad recommendation or a wrong answer can also have consequences for people. In other words, I think it does not depend so much on technological complexity as on the context of use. In the public sector, even a seemingly simple system can have a lot of impact.
David Escudero: I'll throw the rag at you to make another podcast about the concept that is also very fashionable, which is Human in the loop or Human on the loop. In the public sector we have a body of public officials who know their work very well and who can help. Human in the loop would be the role that the civil servant can play when it comes to generating data that can be useful for training systems, checking that the data with which systems can be trained is reliable, etc.; and Human on the loop would be the supervision of the decisions that artificial intelligence can make. The one who can review, who can know if that decision made by an automatic system is good or bad, is a public official.
In this sense, and also related to agentic AI, we have a project with the Spanish Foundation for Science and Technology to advise the Provincial Council of Valladolid on artificial intelligence tasks in the administration. And we see that many of the tasks that the civil servants themselves ask us do not have so much to do with AI, but with the interoperability of the services they already offer and that are automatic. Maybe in an administration they have a service developed by an automatic system, next to another service that offers them a form with results, but then they have to type in the data communicated by both services by hand. There we would also be talking about possibilities for the agency AI to intercommunicate. The challenge is to involve in this entire process the role of the civil servant as a watchdog that public functions are carried out rigorously.
Jose Luis Marín: The concept of Human in the loop is key in many of the projects we work on. In the end, it is the combination not only of technology, but of people who really know the processes and can supervise them and complement those actions that the Agent AI can perform. In any system of simple care, such supervision is already necessary in many cases, because a bad recommendation can also have many consequences, not only in the action of a complex system.
6. In closing, I'd like each of you to share a key idea about what we need to move towards a more trustworthy, assessable, and explainable AI.
David Escudero: I would point out, taking advantage of the fact that we are on the datos.gob.es podcast, the importance of data governance: to make sure that institutions, both public and private, are very concerned about the quality of the data, about having well-shared data that is representative, well documented and, of course, accessible. Data from public institutions is essential for citizens to have these guarantees and for companies and institutions to prepare algorithms that can use this information to improve services or provide guarantees to citizens. Data governance is critical.
Jose Luis Marín: If I had to summarise everything in a single idea, I would say that we are still a long way from assessment being a common practice. In AI systems we will have to make it mandatory within the development and deployment processes. Evaluating is not trying once and taking it for granted, it is necessary to continuously check how and where they can fail, what risks they introduce and if they are still appropriate when the context in which a certain system was designed has changed. I think we are still far from this.
Indeed, open data is key to contributing to this process. An AI is going to be more reliable the more we can observe it and improve it with shared criteria, not only with those of the organization that designs them. That is why open data provides transparency, can help us facilitate verification and build a more solid basis so that services are really aligned with the general interest.
David Escudero Mancebo: In that sense, I would also like to thank spaces like this that undoubtedly serve to promote that culture of data, quality and evaluation that is so necessary in our society. I think a lot of progress has been made, but that, without a doubt, there is still a long way to go and opening spaces for dissemination is very important.
Blog
There's an idea that is repeated in almost any data initiative: "if we connect different sources, we'll get more value". And it is usually true. The nuance is that value appears when we can combine data without friction, without misunderstandings and without surprises. The Public Sector Data reuser´s decalogue sums it up nicely: interoperability is especially critical just when we're trying to mix data from a variety of sources, which is where open data tends to bring the most in.
In practice, interoperability is not just "that there is an API" or "that the file is downloadable". It is a broader concept, with several layers: if we only take care of one, the others end up breaking the reuse. We connect... But we don't understand what each field means. We understand... but there is no stability or versioning. There is stability... but there is no common process for resolving incidents. And, even with all of the above, clear rules of use may be lacking. For this reason, it is also a mistake to think that interoperability is a purely computer problem that can be fixed by "buying the right software": technology is only the tip of the iceberg. If we want data to truly flow between public administration, business and research centres, we need a holistic vision.
And here is the good news: it can be tackled incrementally, step by step. To do it well, the first thing is to clarify what type of interoperability we are looking for in each case, because not all barriers are technical or solved in the same way.
In this post we are going to break down the different types of interoperability, to identify what each one brings and what fails when we leave it out.
The different types of interoperability
Following the European Interoperability Framework (EIF), it is convenient to think of interoperability as a building with four main layers: technical, semantic, organisational and legal. If one fails, the whole suffers.
We then unify the four layers with a data-centric approach, including examples applied to different industries.
1. Technical interoperability: systems can exchange data
It is the "visible" layer: infrastructures, protocols and mechanisms to reliably send/receive data.
But what does it mean in practice?
-
Machine-readable formats: such as CSV, JSON, XML, RDF, avoiding human-readable documents only (such as PDF).
-
Stable APIs and endpoints: with documentation, authentication when applicable, and versioning.
-
Non-functional requirements: availability, performance, security and technical traceability.
What are the typical errors or failures that generate problems?
In the specific case of technical interoperability, these issues mainly arise from ‘silent’ changes, for example, columns and/or structure being altered and breaking integrations, or the presence of non‑persistent URLs, APIs without versioning, or lacking documentation.
Example: let's land it in a specific case for the mobility domain
Let's imagine that a city council publishes in real time the occupancy of parking lots. If the API changes the name of a field or the endpoint without warning, the navigation apps stop showing available spaces, even if "the data exists". The problem is technical: there is a lack of stability, versioning, and interface contract.
2. Semantic interoperability: they also understand each other
If technical interoperability is "the pipes", semantics is the language. We can have perfectly connected systems and still get disastrous results if each part interprets the data differently.
But what does it mean in practice?
-
Glossaries of clear terms: definition of each field, unit, format, range, business rules, granularity, and examples.
-
Controlled vocabularies , taxonomies, and ontologies for unambiguous classification and encoding of values.
-
Unique identifiers and standardised references through reference data with official codes, common catalogues, etc.
What are the typical errors or failures that generate problems?
These issues usually arise when there is ambiguity (for example, if it only says ‘date’, we don’t know whether it refers to the registration date, publication date, or effective date), different units (for example, the unit of measurement of the data is not known: kWh vs MWh, euros vs thousands of euros), incompatible codes (M/F vs 1/2 vs male/female) or even changes in meaning in historical series without explaining it.
Example: let's land it on a specific case in the energy sector
An administration publishes data on electricity consumption by building. A reuser crosses this data with another regional dataset, but one is in kWh and the other in MWh, or one measures "final" consumption and the other "gross". The crossing "fits" technically, but the conclusions go wrong because there is a lack of semantics: definitions and shared units.
3. Organisational interoperability: processes must maintain consistency
Here we talk less about systems and more about people, responsibilities and processes. Data doesn't stand on its own: it's published, updated, corrected, and explained because there's an organization behind it that makes it possible.
But what does it mean in practice?
-
Clear roles and responsibilities: who defines, who validates, who publishes, who maintains and who responds to incidents.
-
Change management: what is a major/minor change, how it is versioned, how it is communicated, and whether the history is preserved.
-
Incident management: single channel, response times, prioritization, traceability and closure.
-
Operational commitments (such as service level agreements or SLAs): update frequency, maintenance windows, quality criteria and periodic reviews.
Here, for example, the UNE specifications on data governance and management can help us, where the keys to establishing organisational models, roles, management processes and continuous improvement are given. Therefore, they fit precisely into this layer: they help to ensure that publishing and sharing data does not depend on the "heroic effort" of a team, but on a stable way of working in which the team matures.
What are the typical errors or failures that generate problems?
The classics: "each unit publishes in its own way", there is no clear responsible, there is no circuit to correct errors, it is updated without warning, it is not preserved historical or the feedback of the reuser is lost in a generic mailbox without tracking.
Example: let's land it in a specific case in the environment
A confederation publishes water quality data and several units provide measurements. Without a common validation process, a coordinated schedule, and an incident channel, the dataset begins to have inconsistent values, gaps, and late corrections. The problem is not the API or the format: it is organizational, because maintenance is not governed.
4. Legal interoperability: that the exchange is viable and compliant
This is the layer that makes the exchange secure and scalable. You can have perfect data at a technical, semantic and organizational level... and even so, not being able to reuse them if there is no legal clarity.
But what does it mean in practice?
-
Clear license and terms of use: attribution, redistribution, commercial use, obligations, etc.
-
Compatibility between licenses when mixing sources: avoiding unfeasible combinations.
-
Data protection compliance: such as the General Data Protection Regulation (GDPR), intellectual property, trade secrets or industry boundaries.
-
Explicit rules on what can and cannot be done: also indicating with what requirements).
What are the typical errors or failures that generate problems?
The classic "jungle": absent or ambiguous licenses, contradictory conditions between datasets, doubts about whether there is personal data or risk of re-identification, or restrictions that are discovered when the project is already advanced.
Example: let's land it in a specific case in culture and heritage
A public archive publishes images and metadata from a collection. Technically everything is fine, and the metadata is rich, but the license is confusing or incompatible with other data that you want to cross (for example, a private repository with restrictions). Result: a company or a university decides not to reuse due to legal uncertainty. The blockade is not technical: it is legal.
In short, interoperability works as a "pack" of four layers: connect (technical), understand the same (semantics), maintain it in a sustained way (organizational) and be able to reuse without risk (legal).
For a quick overview with real-world examples, the following infographic summarizes how each layer is implemented across different sectors (standards, models, practices, and regulatory frameworks) and which components are typically used as references in each case.
Figure 1. Infographic: “Interoperability: the key to working with data from diverse sources”. An accessible version is available here. Source: own elaboration - datos.gob.es.
The infographic above makes a clear idea: interoperability does not depend on a single decision, but on combining standards, agreements and rules that change according to the sector. From here, it makes sense to go down one level and see what references and tools are used in Spain and in Europe so that these four layers (technical, semantic, organisational and legal) do not remain in theory.
A practical reference in Spain: NTI-RISP (and why it makes sense to cite it)
In the Spanish context, the NTI‑RISP is a very useful guide because it clearly lays out what needs to be taken care of when publishing information so that others can reuse it: identification, description (metadata), formats, and terms of use, among other aspects.
Metadata as glue: DCAT-AP and DCAT-AP-ES
In open data, the place where interoperability is most noticeable in everyday practice is in catalogs: if datasets are not described consistently, they become harder to find, understand, and federate.
-
DCAT-AP provides a common metadata model for data catalogues in Europe, based on widely reused vocabularies.
-
In Spain, DCAT-AP-ES is promoted precisely to reinforce the interoperability of catalogues with a common profile that facilitates exchange and federation between portals.
How to approach interoperability without dying of ambition
Rather than "fixing it all at once," it often works better to treat interoperability as continuous improvement because it breaks down with changes in technology, organization, or regulation. A simple and realistic approach:
-
Start with the "why": Do you want to integrate into a service, cross for analysis, build comparable indicators, enrich entities...? The objective determines the level of rigor required.
-
It ensures the minimum level of stability: machine-readable access and formats, persistent identifiers, minimal documentation, and some versioning (even if it is basic). This prevents "useful today" datasets that break tomorrow.
-
Apply semantics where it hurts (Pareto principle: 80/20 - states that 80% of the results come from 20% of the causes or actions-): define very well the critical fields (those that intersect/filter), units, code tables and the exact meaning of dates/states. You don't need to "model it all" to reduce most errors.
-
Put minimum operating agreements: who maintains, when it is updated, how incidents are reported, how changes are announced, and if the history is preserved. This is where a data governance approach (and guidelines like NTI-RISP) makes the difference between "published dataset" and "sustainable dataset".
-
Pilot with a real crossover: a small pilot quickly detects whether the problem was technical, semantic, organizational or legal, and gives you a specific list of frictions to eliminate.
In conclusion, interoperability is not simply "having an API": it is the result of aligning four layers – technical, semantic, organizational and legal – to be able to combine data without friction, without misunderstandings and with security. Each layer solves a different problem: the technical one avoids integration breaks, the semantic one avoids misinterpretations, the organizational one makes publication and maintenance sustainable over time, and the legal one eliminates the uncertainty about what can be done with the data.
In this context, sectoral frameworks and standards act as practical shortcuts to accelerate agreements and reduce ambiguity, and that is why it is useful to see examples by sector. In addition, interoperable metadata and catalogs are a real multiplier: When a dataset is well described, it is found more quickly, better understood, and can be federated at lower cost. Finally, an incremental and measurable approach is usually most effective: start with the "why", ensure technical stability, reinforce critical semantics (80/20), formalize minimum operational agreements and validate with a real crossover, instead of trying to "solve interoperability" as a single closed project.
Content created by Dr. Fernando Gualo, Professor at UCLM and Government and Data Quality Consultant. The content and views expressed in this publication are the sole responsibility of the author.
Blog
"I'm going to upload a CSV file for you. I want you to analyze it and summarize the most relevant conclusions you can draw from the data". A few years ago, data analysis was the territory of those who knew how to write code and use complex technical environments, and such a request would have required programming or advanced Excel skills. Today, being able to analyse data files in a short time with AI tools gives us great professional autonomy. Asking questions, contrasting preliminary ideas and exploring information first-hand changes our relationship with knowledge, especially because we stop depending on intermediaries to obtain answers. Gaining the ability to analyze data with AI independently speeds up processes, but it can also cause us to become overconfident in conclusions.
Based on the example of a raw data file, we are going to review possibilities, precautions and basic guidelines to explore the information without assuming conclusions too quickly.
The file:
To show an example of data analysis with AI we will use a file from the National Institute of Statistics (INE) that collects information on tourist flows in Europe, specifically on occupancy in rural tourism accommodation. The data file contains information from January 2001 to December 2025. It contains disaggregations by sex, age and autonomous community or city, which allows comparative analyses to be carried out over time. At the time of writing, the last update to this dataset was on January 28, 2026.

Figure 1. Dataset information. Source: National Institute of Statistics (INE).
1. Initial exploration
For this first exploration we are going to use a free version of Claude, the AI-based multitasking chat developed by Anthropic. It is one of the most advanced language models in reasoning and analysis benchmarks, which makes it especially suitable for this exercise, and it is the most widely used option currently by the community to perform tasks that require code.
Let's think that we are facing the data file for the first time. We know in broad strokes what it contains, but we do not know the structure of the information. Our first prompt, therefore, should focus on describing it:
PROMPT: I want to work with a data file on occupancy in rural tourism accommodation. Explain to me what structure the file has: what variables it contains, what each one measures and what possible relationships exist between them. It also points out possible missing values or elements that require clarification.
Figure 2. Initial exploration of the data file with Claude. Source: Claude.
Once Claude has given us the general idea and explanation of the variables, it is good practice to open the file and do a quick check. The objective is to assess that, at a minimum, the number of rows, the number of columns, the names of the variables, the time period and the type of data coincide with what the model has told us.
If we detect any errors at this point, the LLM may not be reading the data correctly. If after trying in another conversation the error persists, it is a sign that there is something in the file that makes it difficult to read automatically. In this case, it is best not to continue with the analysis, as the conclusions will be very apparent, but will be based on misinterpreted data.
2. Anomaly management
Second, if we have discovered anomalies, it is common to document them and decide how to handle them before proceeding with the analysis. We can ask the model to suggest what to do, but the final decisions will be ours. For example:
- Missing values: if there are empty cells, we need to decide whether to fill them with an "average" value from the column or simply delete those rows.
- Duplicates: we have to eliminate repeated rows or rows that do not provide new information.
- Formatting errors or inconsistencies: we must correct these so that the variables are coherent and comparable. For example, dates represented in different formats.
- Outliers: if a number appears that does not make sense or is exaggeratedly different from the rest, we have to decide whether to correct it, ignore it or treat it as it is.
Figure 3. Example of missing values analysis with Claude. Source: Claude.
In the case of our file, for example, we have detected that in Ceuta and Melilla the missing values in the Total variable are structural, there is no rural tourism registered in these cities, so we could exclude them from the analysis.
Before making the decision, a good practice at this point is to ask the LLM for the pros and cons of modifying the data. The answer can give us some clue as to which is the best option, or indicate some inconvenience that we had not taken into account.
Figure 4. Claude's analysis on the possibility of eliminating or not securities. Source: Claude.
If we decide to go ahead and exclude the cities of Ceuta and Melilla from the analysis, Claude can help us make this modification directly on the file. The prompt would be as follows:
PROMPT: Removes all rows corresponding to Ceuta and Melilla from the file, so that the rest of the data remains intact. Also explain the steps you're following so they can review them.

Figura 5. Step by step in the modification of data in Claude. Source: Claude.
At this point, Claude offers to download the modified file again, so a good checking practice would be to manually validate that the operation was done correctly. For example, check the number of rows in one file and another or check some rows at random with the first file to make sure that the data has not been corrupted.
3. First questions and visualizations
If the result so far is satisfactory, we can already start exploring the data to ask ourselves initial questions and look for interesting patterns. The ideal when starting the exploration is to ask big, clear and easy to answer questions with the data, because they give us a first vision.
PROMPT: It works with the file without Ceuta and Melilla from now on. Which have been the five communities with the most rural tourism in the total period?
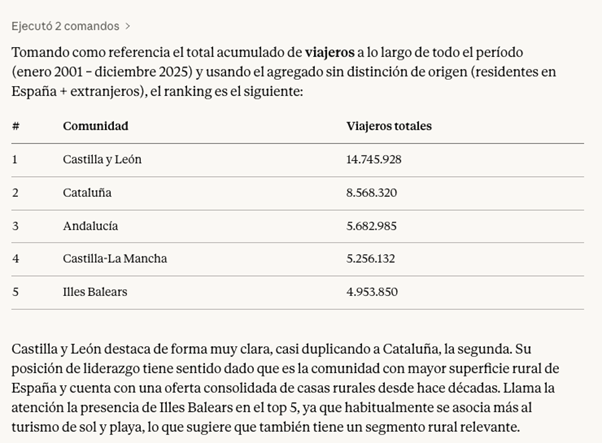
Figure 6. Claude's response to the five communities with the most rural tourism in the period. Source: Claude.
Finally, we can ask Claude to help us visualize the data. Instead of making the effort to point you to a particular chart type, we give you the freedom to choose the format that best displays the information.
PROMPT: Can you visualize this information on a graph? Choose the most appropriate format to represent the data.
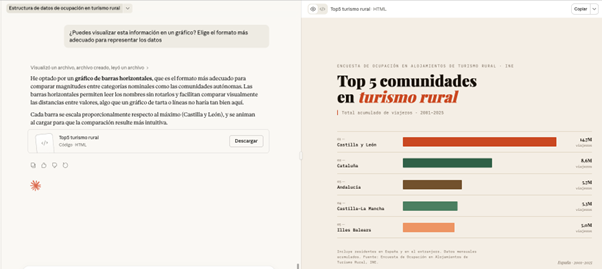
Figure 7. Graph prepared by Cloude to represent the information. Source: Claude.
Here, the screen unfolds: on the left, we can continue with the conversation or download the file, while on the right we can view the graph directly. Claude has generated a very visual and ready-to-use horizontal bar chart. The colors differentiate the communities and the date range and type of data are correctly indicated.
What happens if we ask you to change the color palette of the chart to an inappropriate one? In this case, for example, we are going to ask you for a series of pastel shades that are hardly different.
PROMPT: Can you change the color palette of the chart to this? #E8D1C5, #EDDCD2, #FFF1E6, #F0EFEB, #EEDDD3

.Figure 8. Adjustments made to the graph by Claude to represent the information. Source: Claude.
Faced with the challenge, Claude intelligently adjusts the graphic himself, darkens the background and changes the text on the labels to maintain readability and contrast
All of the above exercise has been done with Claude Sonnet 4.6, which is not Anthropic's highest quality model. Its higher versions, such as Claude Opus 4.6, have greater reasoning capacity, deep understanding and finer results. In addition, there are many other tools for working with AI-based data and visualizations, such as Julius or Quadratic. Although the possibilities are almost endless in them, when we work with data it is still essential to maintain our own methodology and criteria.
Contextualizing the data we are analyzing in real life and connecting it with other knowledge is not a task that can be delegated; We need to have a minimum prior idea of what we want to achieve with the analysis in order to transmit it to the system. This will allow us to ask better questions, properly interpret the results and therefore make a more effective prompting.
Content created by Carmen Torrijos, expert in AI applied to language and communication. The content and views expressed in this publication are the sole responsibility of the author.
Documentación
The adoption of the new DCAT-AP-ES profile aligns Spain with the application profile in Europe (DCAT-AP), facilitating automatic federation between data catalogs defined in RDF (Resource Description Framework).
In this RDF graph environment where flexibility is the norm, the absence of traditional rigid schemas can lead to a silent degradation of data quality, if the standard is not rigorously followed. To mitigate this risk, there is SHACL (Shapes Constraint Language), a recommendation of the W3C. These guidelines make it possible to define "shapes" that function as true guardians of quality and compliance with interoperability.
The stages of the SHACL validation process are as follows:
- An RDF data graph is available
- A subset from the previous graph is selected
- The SHACL constraints that apply to the previous subgraph are checked
- A validation report is obtained with the compliant elements, with errors or with recommendations.
The following figure shows these stages:
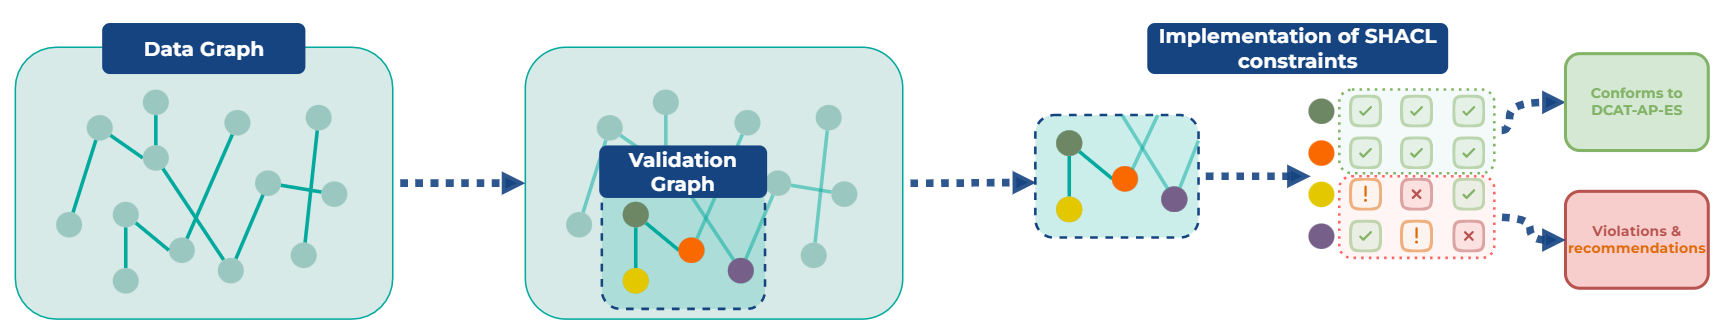
Figure 1: Main stages of the SHACL validation process
Objectives and target audience
This technical guide aims to help publishers and reusers incorporate SHACL validation as a continuous quality improvement practice, through a didactic and accessible approach, inspired by clear resources and open validation tools from the data ecosystem.
In addition, its relationship with DCAT-AP-ES is deepened in a special way, detailing a practical and exhaustive case of the complete workflow of validation and governance of a catalog according to this profile.
Structure and contents
The document follows a progressive approach, starting from theoretical foundations to technical implementation and automatic integration, structured in the following key blocks:
- Fundamentals of semantic validation: RDF and the challenge of the “open world, as well as SHACL as a mechanism to perform validations, defining key concepts such as Shape or Validation Report.
- DCAT-AP-ES and the adoption of SHACL for validation: the SHACL forms defined in DCAT-AP-ES and the case of their application in the federation process of the National Catalogue are explained.
- Case Study: RDF Graph Validation: A step-by-step tutorial on how to validate a catalog with DCAT-AP-ES SHACL forms, troubleshooting common issues, and available tools.
- Conclusions: Reflections on the advantages of integrating SHACL validation to improve data catalog governance.
SHACL validation represents a paradigm shift in metadata quality management in data catalogs. This guide walks through the entire process from theoretical foundations to practical application, demonstrating that the adoption of SHACL is not simply a technical requirement, but an opportunity to strengthen and improve data governance.
Blog
We live in an era where science is increasingly reliant on data. From urban planning to the climate transition, data governance has become a structural pillar of evidence-based decision-making. However, there is one area where the traditional principles of data management, validation and control are subjected to extreme tensions: the universe.
Space data—produced by scientific satellites, telescopes, interplanetary probes, and exploration missions— do not describe accessible or repeatable realities. They observe phenomena that occurred millions of years ago, at distances impossible to travel and under conditions that can never be replicated in the laboratory. There is no "in situ" measurement that directly confirms these phenomena.
In this context, data governance ceases to be an organizational issue and becomes a structural element of scientific trust. Quality, traceability and reproducibility cannot be supported by direct physical references, but by methodological transparency, comprehensive documentation and the robustness of instrumental and theoretical frameworks.
Governing data in the universe therefore involves facing unique challenges: managing structural uncertainty, documenting extreme scales, and ensuring trust in information we can never touch.
Below, we explore the main challenges posed by data governance when the object of study is beyond Earth.
I. Specific challenges of the datum of the universe
1. Beyond Earth: new sources, new rules
When we talk about space data, we mean much more than satellite images of the Earth's surface. We delve into a complex ecosystem that includes space and ground-based telescopes, interplanetary probes, planetary exploration missions, and observatories designed to detect radiation, particles, or extreme physical phenomena.
These systems generate data with clearly different challenges compared to other scientific domains:
| Challenge | Impact on data governance |
|---|---|
| Non-existent physical access | There is no direct validation; Trust lies in the integrity of the channel. |
| Instrumental dependence | The data is a direct "child" of the sensor's design. If the sensor fails or is out of calibration, reality is distorted. |
| Uniqueness | Many astronomical events are unique. There is no "second chance" to capture them. |
| Extreme cost | The value of each byte is very high due to the investment required to put the sensor into orbit |
Figure 1. Challenges in data governance across the universe. Source: own elaboration - datos.gob.es.
Unlike Earth observation data -which in many cases can be contrasted by field campaigns or redundant sensors -data from the universe depend fundamentally on the mission architecture, instrument calibration, and physical models used to interpret the captured signal.
In many cases, what is recorded is not the phenomenon itself, but an indirect signal: spectral variations, electromagnetic emissions, gravitational alterations or particles detected after traveling millions of kilometers. The data is, in essence, an instrumental translation of an inaccessible phenomenon.
For all these reasons, in space data cannot be understood without the technical context that generates it.
2. Structural uncertainty and extreme scales
Uncertainty refers to the degree of margin of error or indeterminacy associated with a scientific measurement, interpretation, or result due to the limits of the instruments, observing conditions, and models used to analyze the data. If in other areas uncertainty is a factor that is tried to be reduced by direct, repeatable and verifiable measurements, in the observation of the universe uncertainty is part of the knowledge process itself. It is not simply a matter of "not knowing enough", but of facing physical and methodological limits that cannot be completely eliminated.
Therefore, in the observation of the universe, uncertainty is structural. It is not a specific anomaly, but a condition inherent to the object of study.
There are several critical dimensions:
- Extreme spatial and temporal scales: cosmic distances prevent any direct validation. Timescales imply that the data often captures an "instant" of the remote past and not a verifiable present reality.
- Weak signals and unavoidable noise: the instruments capture extremely subtle emissions. The useful signal coexists with interference, technological limitations and background noise. Interpretation depends on advanced statistical treatments and complex physical models.
- Limited-observation phenomena: Some astrophysical phenomena—such as certain supernovae, gamma-ray bursts, or singular gravitational configurations—cannot be experimentally recreated and can only be observed when they occur. In these cases, the available record may be unique or profoundly limited, increasing the responsibility for documentation and preservation.
Not all phenomena are unrepeatable, but in many cases the opportunities for observation are scarce or depend on exceptional conditions.
II. Building trust when we can't touch the object observed
In the face of these challenges, data governance takes on a structural role. It is not limited to guaranteeing storage or availability, but defines the rules by which scientific processes are documented, traceable and auditable.
In this context, governing does not mean producing knowledge, but rather ensuring that its production is transparent, verifiable and reusable.
1. Quality without direct physical validation
When the observed phenomenon cannot be directly verified, the quality of the data is based on:
- Rigorous calibration protocols: instruments must undergo systematic calibration processes before, during, and after operation. This involves adjusting your measurements against known baselines, characterizing your margins of error, documenting deviations, and recording any modifications to your configuration. Calibration is not a one-off event, but an ongoing process that ensures that the recorded signal reflects, as accurately as possible, the observed phenomenon within the physical boundaries of the system.
- Cross-validation between independent instruments: when different instruments – either on the same mission or on different missions – observe a similar phenomenon, the comparison of results allows the reliability of the data to be reinforced. The convergence between observations obtained with different technologies reduces the probability of instrumental bias or systematic errors. This inter-instrumental coherence acts as an indirect verification mechanism.
- Observational repetition when possible: although not all phenomena can be repeated, many observations can be made at different times or under different conditions. Repetition allows to evaluate the stability of the signal, identify anomalies and estimate natural variability against measurement error. Consistency over time strengthens the robustness of the result.
- Peer review and progressive scientific consensus: the data and their interpretations are subject to evaluation by the scientific community. This process involves methodological scrutiny, critical analysis of assumptions, and verification of consistency with existing knowledge. Consensus does not emerge immediately, but through the accumulation of evidence and scientific debate. Quality, in this sense, is also a collective construction.
Quality is not just a technical property; it is the result of a documented and auditable process.
2. Complete scientific traceability
In the spatial context, data is inseparable from the technical and scientific process that generates it. It cannot be understood as an isolated result, but as the culmination of a chain of instrumental, methodological and analytical decisions.
Therefore, traceability must explicitly and documented:
- Instrument design and configuration: information about the technical characteristics of the instrument that captured the signal, such as its architecture, sensing capabilities, resolution limits, and operational configurations, needs to be retained. These conditions determine what type of signal can be recorded and how accurately.
- Calibration parameters: The adjustments applied to ensure that the instrument operates within the intended margins must be recorded, as well as the modifications made over time. The calibration parameters directly influence the interpretation of the obtained signal.
- Processing software versions: the processing of raw data depends on specific IT tools. Preserving the versions used allows you to understand how the results were generated and avoid ambiguities if the software evolves.
- Algorithms applied in noise reduction: since signals are often accompanied by interference or background noise, it is essential to document the methods used to filter, clean, or transform the information before analysis. These algorithms influence the final result.
- Scientific assumptions used in the interpretation: the reading of the data is not neutral: it is based on theoretical frameworks and physical models accepted at the time of analysis. Recording these assumptions allows you to contextualize the conclusions and understand possible future revisions.
- Successive transformations from the raw data to the published data: from the original signal to the final scientific product, the data goes through different phases of processing, aggregation and analysis. Each transformation must be able to be reconstructed to understand how the communicated result was reached.
Without exhaustive traceability, reproducibility is weakened and future interpretability is compromised. When it is not possible to reconstruct the entire process that led to a result, its independent evaluation becomes limited and its scientific reuse loses its robustness.
3. Long-term reproducibility
Space missions can span decades, and their data can remain relevant long after the mission has ended. In addition, scientific interpretation evolves over time: new models, new tools, and new questions may require reanalyzing information generated years ago.
Therefore, data must remain interpretable even when the original equipment no longer exists, technological systems have changed, or the scientific context has evolved.
This requires:
- Rich and structured metadata: the contextual information that accompanies the data – about its origin, acquisition conditions, processing and limitations – must be organized in a clear and standardized way. Without sufficient metadata, the data loses meaning and becomes difficult to reinterpret in the future.
- Persistent identifiers: Each dataset must be able to be located and cited in a stable manner over time. Persistent identifiers allow the reference to be maintained even if storage systems or technology infrastructures change.
- Robust digital preservation policies: Long-term preservation requires strategies that take into account format obsolescence, technological migration, and archive integrity. It is not enough to store; It is necessary to ensure that the data remains accessible and readable over time.
- Accessible documentation of processing pipelines: the process that transforms raw data into scientific product must be described in a comprehensible way. This allows future researchers to reconstruct the analysis, verify the results, or apply new methods on the same original data.
Reproducibility, in this context, does not mean physically repeating the observed phenomenon, but being able to reconstruct the analytical process that led to a given result. Governance doesn't just manage the present; It ensures the future reuse of knowledge and preserves the ability to reinterpret information in the light of new scientific advances.
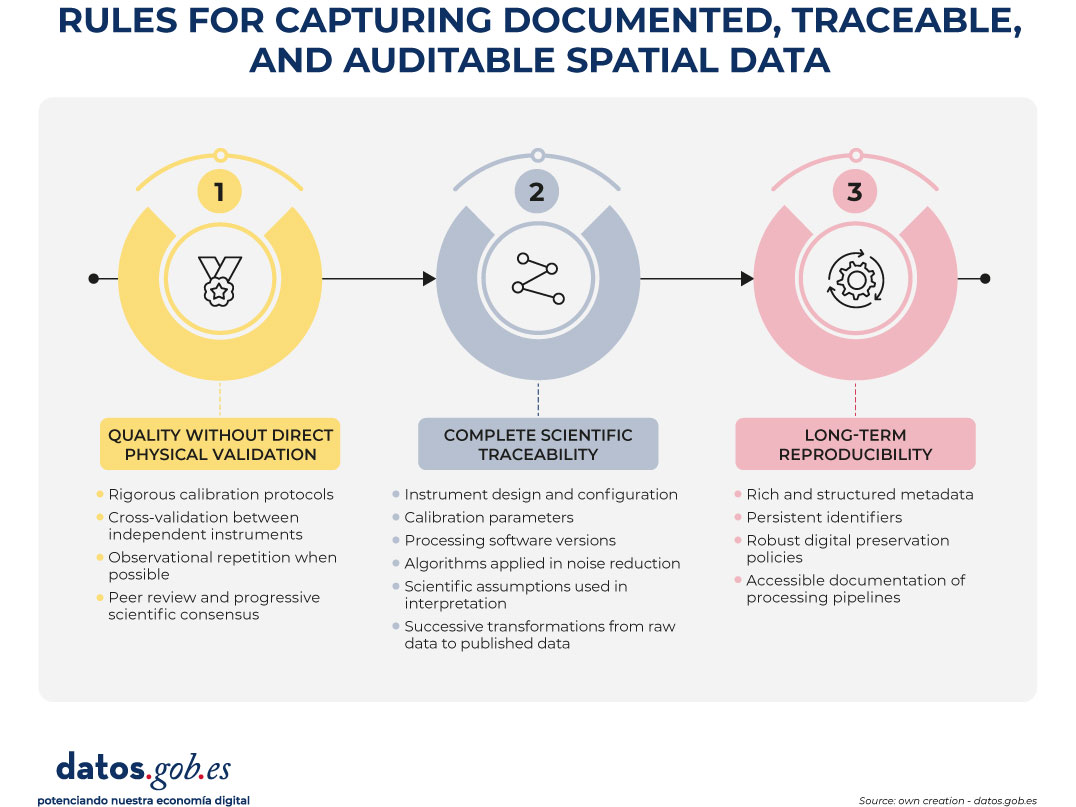
Figure 2. Rules for capturing documented, traceable, and auditable spatial data. Source: own elaboration - datos.gob.es.
Conclusion: Governing What We Can't Touch
The data of the universe forces us to rethink how we understand and manage information. We are working with realities that we cannot visit, touch or verify directly. We observe phenomena that occur at immense distances and in times that exceed the human scale, through highly specialized instruments that translate complex signals into interpretable data.
In this context, uncertainty is not a mistake or a weakness, but a natural feature of the study of the cosmos. The interpretation of data depends on scientific models that evolve over time, and quality is not based on direct verification, but on rigorous processes, well documented and reviewed by the scientific community. Trust, therefore, does not arise from direct experience, but from the transparency, traceability and clarity with which the methods used are explained.
Governing spatial data does not only mean storing it or making it available to the public. It means keeping all the information that allows us to understand how they were obtained, how they were processed and under what assumptions they were interpreted. Only then can they be evaluated, reinterpreted and reused in the future.
Beyond Earth, data governance is not a technical detail or an administrative task. It is the foundation that sustains the credibility of human knowledge about the universe and the basis that allows new generations to continue exploring what we cannot yet achieve physically.
Content prepared by Mayte Toscano, Senior Consultant in technologies related to the data economy. The contents and viewpoints expressed in this publication are the sole responsibility of the author.
Blog
Since its origins, the open data movement has focused mainly on promoting the openness of data and promoting its reuse. The objective that has articulated most of the initiatives, both public and private, has been to overcome the obstacles to publishing increasingly complete data catalogues and to ensure that public sector information is available so that citizens, companies, researchers and the public sector itself could create economic and social value.
However, as we have taken steps towards an economy that is increasingly dependent on data and, more recently, on artificial intelligence – and in the near future on the possibilities that autonomous agents bring us through agentic artificial intelligence – priorities have been changing and the focus has been shifting towards issues such as improving the quality of published data.
It is no longer enough for the datasets to be published in an open data portal complying with good practices, or even for the data to meet quality standards at the time of publication. It is also necessary that this publication of the datasets meets service levels that transform the mere provision into an operational commitment that mitigates the uncertainties that often hinder reuse.
When a developer integrates a real-time transportation data API into their mobility app, or when a data scientist works on an AI model with historical climate data, they are taking a risk if they are uncertain about the conditions under which the data will be available. If at any given time the published data becomes unavailable because the format changes without warning, because the response time skyrockets, or for any other reason, the automated processes fail and the data supply chain breaks, causing cascading failures in all dependent systems.
In this context, the adoption of service level agreements (SLAs) could be the next step for open data portals to evolve from the usual "best effort" model to become critical, reliable and robust digital infrastructures.
What are an SLA and a Data Contract in the context of open data?
In the context of site reliability engineering (SRE), an SLA is a contract negotiated between a service provider and its customers in order to set the level of quality of the service provided. It is, therefore, a tool that helps both parties to reach a consensus on aspects such as response time, time availability or available documentation.
In an open data portal, where there is often no direct financial consideration, an SLA could help answer questions such as:
- How long will the portal and its APIs be available?
- What response times can we expect?
- How often will the datasets be updated?
- How are changes to metadata, links, and formatting handled?
- How will incidents, changes and notifications to the community be managed?
In addition, in this transition towards greater operational maturity, the concept, still immature, of the data contract (data contract) emerges. If the SLA is an agreement that defines service level expectations, the data contract is an implementation that formalizes this commitment. A data contract would not only specify the schema and format, but would act as a safeguard: if a system update attempts to introduce a change that breaks the promised structure or degrades the quality of the data, the data contract allows you to detect and block such an anomaly before it affects end users.
INSPIRE as a starting point: availability, performance and capacity
The European Union's Infrastructure for Spatial Information (INSPIRE) has established one of the world's most rigorous frameworks for quality of service for geospatial data. Directive 2007/2/EC, known as INSPIRE, currently in its version 5.0, includes some technical obligations that could serve as a reference for any modern data portal. In particular , Regulation (EC) No 976/2009 sets out criteria that could well serve as a standard for any strategy for publishing high-value data:
- Availability: Infrastructure must be available 99% of the time during normal operating hours.
- Performance: For a visualization service, the initial response should arrive in less than 3 seconds.
- Capacity: For a location service, the minimum number of simultaneous requests served with guaranteed throughput must be 30 per second.
To help comply with these service standards, the European Commission offers tools such as the INSPIRE Reference Validator. This tool helps not only to verify syntactic interoperability (that the XML or GML is well formed), but also to ensure that network services comply with the technical specifications that allow those SLAs to be measured.
At this point, the demanding SLAs of the European spatial data infrastructure make us wonder if we should not aim for the same for critical health, energy or mobility data or for any other high-value dataset.
What an SLA could cover on an open data platform
When we talk about open datasets in the broad sense, the availability of the portal is a necessary condition, but not sufficient. Many issues that affect the reuser community are not complete portal crashes, but more subtle errors such as broken links, datasets that are not updated as often as indicated, inconsistent formats between versions, incomplete metadata, or silent changes in API behavior or dataset column names.
Therefore, it would be advisable to complement the SLAs of the portal infrastructure with "data health" SLAs that can be based on already established reference frameworks such as:
- Quality models such as ISO/IEC 25012, which allows the quality of the data to be broken down into measurable dimensions such as accuracy (that the data represents reality), completeness (that necessary values are not missing) and consistency (that there are no contradictions between tables or formats) and convert them into measurable requirements.
- FAIR Principles, which stands for Findable, Accessible, Interoperable, and Reusable. These principles emphasize that digital assets should not only be available, but should be traceable using persistent identifiers, accessible under clear protocols, interoperable through the use of standard vocabularies, and reusable thanks to clear licenses and documented provenance. The FAIR principles can be put into practice by systematically measuring the quality of the metadata that makes location, access and interoperability possible. For example, data.europa.eu's Metadata Quality Assurance (MQA) service helps you automatically evaluate catalog metadata, calculate metrics, and provide recommendations for improvement.
To make these concepts operational, we can focus on four examples where establishing specific service commitments would provide a differential value:
- Catalog compliance and currency: The SLA could ensure that the metadata is always aligned with the data it describes. A compliance commitment would ensure that the portal undergoes periodic validations (following specifications such as DCAT-AP-ES or HealthDCAT-AP) to prevent the documentation from becoming obsolete with respect to the actual resource.
- Schema stability and versioning: One of the biggest enemies of automated reuse is "silent switching." If a column changes its name or a data type changes, the data ingestion flows will fail immediately. A service level commitment might include a versioning policy. This would mean that any changes that break compatibility would be announced at least notice, and preferably keep the previous version in parallel for a reasonable amount of time.
- Freshness and refresh frequency: It's not uncommon to find datasets labeled as daily but last actually modified months ago. A good practice could be the definition of publication latency indicators. A possible SLA would establish the value of the average time between updates and would have alert systems that would automatically notify if a piece of data has not been refreshed according to the frequency declared in its metadata.
- Success rate: In the world of data APIs, it's not enough to just receive an HTTP 200 (OK) code to determine if the answer is valid. If the response is, for example, a JSON with no content, the service is not useful. The service level would have to measure the rate of successful responses with valid content, ensuring that the endpoint not only responds, but delivers the expected information.
A first step, SLA, SLO, and SLI: measure before committing
Since establishing these types of commitments is really complex, a possible strategy to take action gradually is to adopt a pragmatic approach based on industry best practices. For example, in reliability engineering, a hierarchy of three concepts is proposed that helps avoid unrealistic compromises:
- Service Level Indicator (SLI): it is the measurable and quantitative indicator. It represents the technical reality at a given moment. Examples of SLI in open data could be the "percentage of successful API requests", "p95 latency" (the response time of 95% of requests) or the "percentage of download links that do not return error".
- Service Level Objective (SLO): this is the internal objective set for this indicator. For example: "we want 99.5% of downloads to work correctly" or "p95 latency must be less than 800ms". It is the goal that guides the work of the technical team.
- Service Level Agreement (SLA): is the public and formal commitment to those objectives. This is the promise that the data portal makes to its community of reusers and that includes, ideally, the communication channels and the protocols for action in the event of non-compliance.
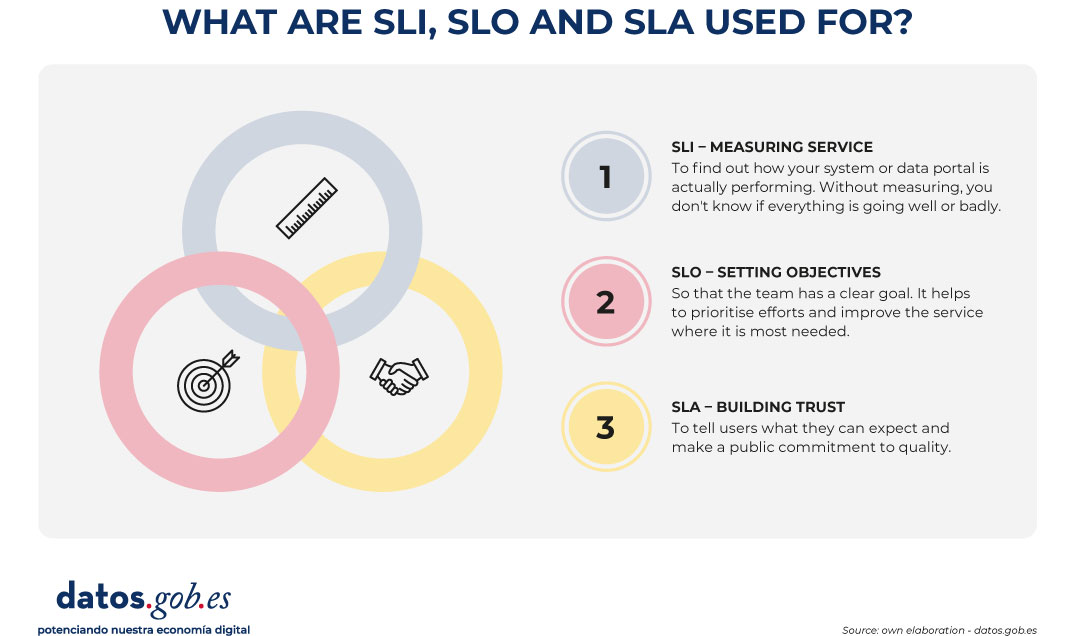
Figure 1. Visual to explain the difference between SLI, SLO and SLA. Source: own elaboration - datos.gob.es.
This distinction is especially valuable in the open data ecosystem due to the hybrid nature of a service in which not only an infrastructure is operated, but the data lifecycle is managed.
In many cases, the first step might be not so much to publish an ambitious SLA right away, but to start by defining your SLIs and looking at your SLOs. Once measurement was automated and service levels stabilized and predictable, it would be time to turn them into a public commitment (SLA).
Ultimately, implementing service tiers in open data could have a multiplier effect. Not only would it reduce technical friction for developers and improve the reuse rate, but it would make it easier to integrate public data into AI systems and autonomous agents. New uses such as the evaluation of generative Artificial Intelligence systems, the generation and validation of synthetic datasets or even the improvement of the quality of open data itself would benefit greatly.
Establishing a data SLA would, above all, be a powerful message: it would mean that the public sector not only publishes data as an administrative act, but operates it as a digital service that is highly available, reliable, predictable and, ultimately, prepared for the challenges of the data economy.
Content created by Jose Luis Marín, Senior Consultant in Data, Strategy, Innovation & Digitalisation. The content and views expressed in this publication are the sole responsibility of the author.
Blog
For more than a decade, open data platforms have measured their impact through relatively stable indicators: number of downloads, web visits, documented reuses, applications or services created based on them, etc. These indicators worked well in an ecosystem where users – companies, journalists, developers, anonymous citizens, etc. – directly accessed the original sources to query, download and process the data.
However, the panorama has changed radically. The emergence of generative artificial intelligence models has transformed the way people access information. These systems generate responses without the need for the user to visit the original source, which is causing a global drop in web traffic in media, blogs and knowledge portals.
In this new context, measuring the impact of an open data platform requires rethinking traditional indicators to incorporate new ones to the metrics already used that also capture the visibility and influence of data in an ecosystem where human interaction is changing.
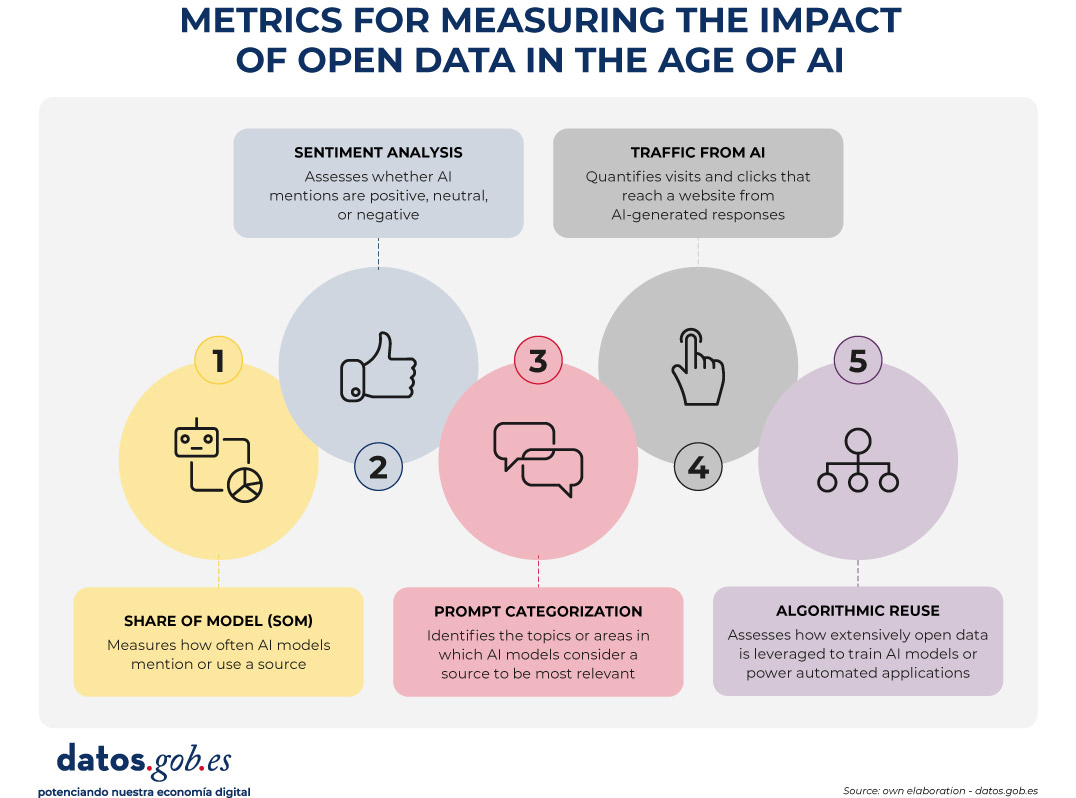
Figure 1. Metrics for measuring the impact of open data in the age of AI.
A structural change: from click to indirect consultation
The web ecosystem is undergoing a profound transformation driven by the rise of large language models (LLMs). More and more people are asking their questions directly to systems such as ChatGPT, Copilot, Gemini or Perplexity, obtaining immediate and contextualized answers without the need to resort to a traditional search engine.
At the same time, those who continue to use search engines such as Google or Bing are also experiencing relevant changes derived from the integration of artificial intelligence on these platforms. Google, for example, has incorporated features such as AI Overviews, which offers automatically generated summaries at the top of the results, or AI Mode, a conversational interface that allows you to drill down into a query without browsing links. This generates a phenomenon known as Zero-Click: the user performs a search on an engine such as Google and gets the answer directly on the results page itself. As a result, you don't need to click on any external links, which limits visits to the original sources from which the information is extracted.
All this implies a key consequence: web traffic is no longer a reliable indicator of impact. A website can be extremely influential in generating knowledge without this translating into visits.
New metrics to measure impact
Faced with this situation, open data platforms need new metrics that capture their presence in this new ecosystem. Some of them are listed below.
-
Share of Model (SOM): Presence in AI models
Inspired by digital marketing metrics, the Share of Model measures how often AI models mention, cite, or use data from a particular source. In this way, the SOM helps to see which specific data sets (employment, climate, transport, budgets, etc.) are used by the models to answer real questions from users, revealing which data has the greatest impact.
This metric is especially valuable because it acts as an indicator of algorithmic trust: when a model mentions a web page, it is recognizing its reliability as a source. In addition, it helps to increase indirect visibility, since the name of the website appears in the response even when the user does not click.
-
Sentiment analysis: tone of mentions in AI
Sentiment analysis allows you to go a step beyond the Share of Model, as it not only identifies if an AI model mentions a brand or domain, but how it does so. Typically, this metric classifies the tone of the mention into three main categories: positive, neutral, and negative.
Applied to the field of open data, this analysis helps to understand the algorithmic perception of a platform or dataset. For example, it allows detecting whether a model uses a source as an example of good practice, if it mentions it neutrally as part of an informative response, or if it associates it with problems, errors, or outdated data.
This information can be useful to identify opportunities for improvement, strengthen digital reputation, or detect potential biases in AI models that affect the visibility of an open data platform.
-
Categorization of prompts: in which topics a brand stands out
Analyzing the questions that users ask allows you to identify what types of queries a brand appears most frequently in. This metric helps to understand in which thematic areas – such as economy, health, transport, education or climate – the models consider a source most relevant.
For open data platforms, this information reveals which datasets are being used to answer real user questions and in which domains there is greater visibility or growth potential. It also allows you to spot opportunities: if an open data initiative wants to position itself in new areas, it can assess what kind of content is missing or what datasets could be strengthened to increase its presence in those categories.
-
Traffic from AI: clicks from digests generated
Many models already include links to the original sources. While many users don't click on such links, some do. Therefore, platforms can start measuring:
- Visits from AI platforms (when these include links).
- Clicks from rich summaries in AI-integrated search engines.
This means a change in the distribution of traffic that reaches websites from the different channels. While organic traffic—traffic from traditional search engines—is declining, traffic referred from language models is starting to grow.
This traffic will be smaller in quantity than traditional traffic, but more qualified, since those who click from an AI usually have a clear intention to go deeper.
It is important that these aspects are taken into account when setting growth objectives on an open data platform.
-
Algorithmic Reuse: Using Data in Models and Applications
Open data powers AI models, predictive systems, and automated applications. Knowing which sources have been used for their training would also be a way to know their impact. However, few solutions directly provide this information. The European Union is working to promote transparency in this field, with measures such as the template for documenting training data for general-purpose models, but its implementation – and the existence of exceptions to its compliance – mean that knowledge is still limited.
Measuring the increase in access to data through APIs could give an idea of its use in applications to power intelligent systems. However, the greatest potential in this field lies in collaboration with companies, universities and developers immersed in these projects, so that they offer a more realistic view of the impact.
Conclusion: Measure what matters, not just what's easy to measure
A drop in web traffic doesn't mean a drop in impact. It means a change in the way information circulates. Open data platforms must evolve towards metrics that reflect algorithmic visibility, automated reuse, and integration into AI models.
This doesn't mean that traditional metrics should disappear. Knowing the accesses to the website, the most visited or the most downloaded datasets continues to be invaluable information to know the impact of the data provided through open platforms. And it is also essential to monitor the use of data when generating or enriching products and services, including artificial intelligence systems. In the age of AI, success is no longer measured only by how many users visit a platform, but also by how many intelligent systems depend on its information and the visibility that this provides.
Therefore, integrating these new metrics alongside traditional indicators through a web analytics and SEO strategy * allows for a more complete view of the real impact of open data. This way we will be able to know how our information circulates, how it is reused and what role it plays in the digital ecosystem that shapes society today.
*SEO (Search Engine Optimization) is the set of techniques and strategies aimed at improving the visibility of a website in search engines.
Blog
Access to data through APIs has become one of the key pieces of today's digital ecosystem. Public administrations, international organizations and private companies publish information so that third parties can reuse it in applications, analyses or artificial intelligence projects. In this situation, talking about open data is, almost inevitably, also talking about APIs.
However, access to an API is rarely completely free and unlimited. There are restrictions, controls and protection mechanisms that seek to balance two objectives that, at first glance, may seem opposite: facilitating access to data and guaranteeing the stability, security and sustainability of the service. These limitations generate frequent doubts: are they really necessary, do they go against the spirit of open data, and to what extent can they be applied without closing access?
This article discusses how these constraints are managed, why they are necessary, and how they fit – far from what is sometimes thought – within a coherent open data strategy.
Why you need to limit access to an API
An API is not simply a "faucet" of data. Behind it there is usually technological infrastructure, servers, update processes, operational costs and equipment responsible for the service working properly.
When a data service is exposed without any control, well-known problems appear:
- System saturation, caused by an excessive number of simultaneous queries.
- Abusive use, intentional or unintentional, that degrades the service for other users.
- Uncontrolled costs, especially when the infrastructure is deployed in the cloud.
- Security risks, such as automated attacks or mass scraping.
In many cases, the absence of limits does not lead to more openness, but to a progressive deterioration of the service itself.
For this reason, limiting access is not usually an ideological decision, but a practical necessity to ensure that the service is stable, predictable and fair for all users.
The API Key: basic but effective control
The most common mechanism for managing access is the API Key. While in some cases, such as the datos.gob.es National Open Data Catalog API , no key is required to access published information, other catalogs require a unique key that identifies each user or application and is included in each API call.
Although from the outside it may seem like a simple formality, the API Key fulfills several important functions. It allows you to identify who consumes the data, measure the actual use of the service, apply reasonable limits and act on problematic behavior without affecting other users.
In the Spanish context there are clear examples of open data platforms that work in this way. The State Meteorological Agency (AEMET), for example, offers open access to high-value meteorological data, but requires requesting a free API Key for automated queries. Access is free of charge, but not anonymous or uncontrolled.
So far, the approach is relatively familiar: consumer identification and basic limits of use. However, in many situations this is no longer enough.
When API becomes a strategic asset
Leading API management platforms, such as MuleSoft or Kong among others, were pioneers in implementing advanced mechanisms for controlling and protecting access to APIs. Its initial focus was on complex business environments, where multiple applications, organizations, and countries consume data services intensively and continuously.
Over time, many of these practices have also been extended to open data platforms. As certain open data services gain relevance and become key dependencies for applications, research, or business models, the challenges associated with their availability and stability become similar. The downfall or degradation of large-scale open data services—such as those related to Earth observation, climate, or science—can have a significant impact on multiple systems that depend on them.
In this sense, advanced access management is no longer an exclusively technical issue and becomes part of the very sustainability of a service that becomes strategic. It's not so much about who publishes the data, but the role that data plays within a broader ecosystem of reuse. For this reason, many open data platforms are progressively adopting mechanisms that have already been tested in other areas, adapting them to their principles of openness and public access. Some of them are detailed below.
Limiting the flow: regulating the pace, not the right of access
One of the first additional layers is the limitation of the flow of use, which is usually known as rate limiting. Instead of allowing an unlimited number of calls, it defines how many requests can be made in a given time interval.
The key here is not to prevent access, but to regulate the rhythm. A user can still use the data, but it prevents a single application from monopolizing resources. This approach is common in the Weather, Mobility, or Public Statistics APIs, where many users access it simultaneously.
More advanced platforms go a step further and apply dynamic limits, which are adjusted based on system load, time of day, or historical consumer behavior. The result is fairer and more flexible control.
Context, Origin, and Behavior: Beyond Volume
Another important evolution is to stop looking only at how many calls are made and start analyzing where and how they are made from. This includes measures such as restriction by IP addresses, geofencing, or differentiation between test and production environments.
In some cases, these limitations respond to regulatory frameworks or licenses of use. In others, they simply allow you to protect more sensitive parts of the service without shutting down general access. For example, an API can be globally accessible in query mode, but limit certain operations to very specific situations.
Platforms also analyze behavior patterns. If an application starts making repetitive, inconsistent queries or very different from its usual use, the system can react automatically: temporarily reduce the flow, launch alerts or require an additional level of validation. It is not blocked "just because", but because the behavior no longer fits with a reasonable use of the service.
Measuring impact, not just calls
A particularly relevant trend is to stop measuring only the number of requests and start considering the real impact of each one. Not all queries consume the same resources: some transfer large volumes of data or execute more expensive operations.
A clear example in open data would be an urban mobility API. Checking the status of a stop or traffic at a specific point involves little data and limited impact. On the other hand, downloading the entire vehicle position history of a city at once for several years is a much greater load on the system, even if it is done in a single call.
For this reason, many platforms introduce quotas based on the volume of data transferred, type of operation, or query weight. This avoids situations where seemingly moderate usage places a disproportionate load on the system.
How does all this fit in with open data?
At this point, the question inevitably arises: is data still open when all these layers of control exist?
The answer depends less on technology and more on the rules of the game. Open data is not defined by the total absence of technical control, but by principles such as non-discriminatory access, the absence of economic barriers, clarity in licensing, and the real possibility of reuse.
Requesting an API Key, limiting flow, or applying contextual controls does not contradict these principles if done in a transparent and equitable manner. In fact, in many cases it is the only way to guarantee that the service continues to exist and function correctly in the medium and long term.
The key is in balance: clear rules, free access, reasonable limits and mechanisms designed to protect the service, not to exclude. When this balance is achieved, control is no longer perceived as a barrier and becomes a natural part of an ecosystem of open, useful and sustainable data.
Content created by Juan Benavente, senior industrial engineer and expert in technologies related to the data economy. The content and views expressed in this publication are the sole responsibility of the author.
Documentación
Data possesses a fluid and complex nature: it changes, grows, and evolves constantly, displaying a volatility that profoundly differentiates it from source code. To respond to the challenge of reliably managing this evolution, we have developed the new 'Technical Guide: Data Version Control'.
This guide addresses an emerging discipline that adapts software engineering principles to the data ecosystem: Data Version Control (DVC). The document not only explores the theoretical foundations but also offers a practical approach to solving critical data management problems, such as the reproducibility of machine learning models, traceability in regulatory audits, and efficient collaboration in distributed teams.
Why is a guide on data versioning necessary?
Historically, data versioning has been done manually (files with suffixes like "_final_v2.csv"), an error-prone and unsustainable approach in professional environments. While tools like Git have revolutionized software development, they are not designed to efficiently handle large files or binaries, which are intrinsic characteristics of datasets.
This guide was created to bridge that technological and methodological gap, explaining the fundamental differences between code versioning and data versioning. The document details how specialized tools like DVC (Data Version Control) allow you to manage the data lifecycle with the same rigor as code, ensuring that you can always answer the question: "What exact data was used to obtain this result?"
Structure and contents
The document follows a progressive approach, starting from basic concepts and progressing to technical implementation, and is structured in the following key blocks:
- Version Control Fundamentals: Analysis of the current problem (the "phantom model", impossible audits) and definition of key concepts such as Snapshots, Data Lineage and Checksums.
- Strategies and Methodologies: Adaptation of semantic versioning (SemVer) to datasets, storage strategies (incremental vs. full) and metadata management to ensure traceability.
- Tools in practice: A detailed analysis of tools such as DVC, Git LFS and cloud-native solutions (AWS, Google Cloud, Azure), including a comparison to choose the most suitable one according to the size of the team and the data.
- Practical case study: A step-by-step tutorial on how to set up a local environment with DVC and Git, simulating a real data lifecycle: from generation and initial versioning, to updating, remote synchronization, and rollback.
- Governance and best practices: Recommendations on roles, retention policies and compliance to ensure successful implementation in the organization.
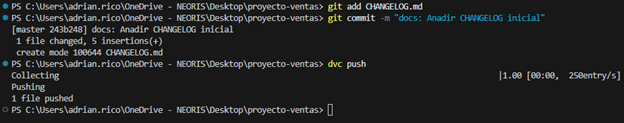
Figure 1: Practical example of using GIT and DVC commands included in the guide.
Who is it aimed at?
This guide is designed for a broad technical profile within the public and private sectors: data scientists, data engineers, analysts and data catalog managers.
It is especially useful for professionals looking to streamline their workflows, ensure the scientific reproducibility of their research, or guarantee regulatory compliance in regulated sectors. While basic knowledge of Git and the command line is recommended, the guide includes practical examples and detailed explanations to facilitate learning.
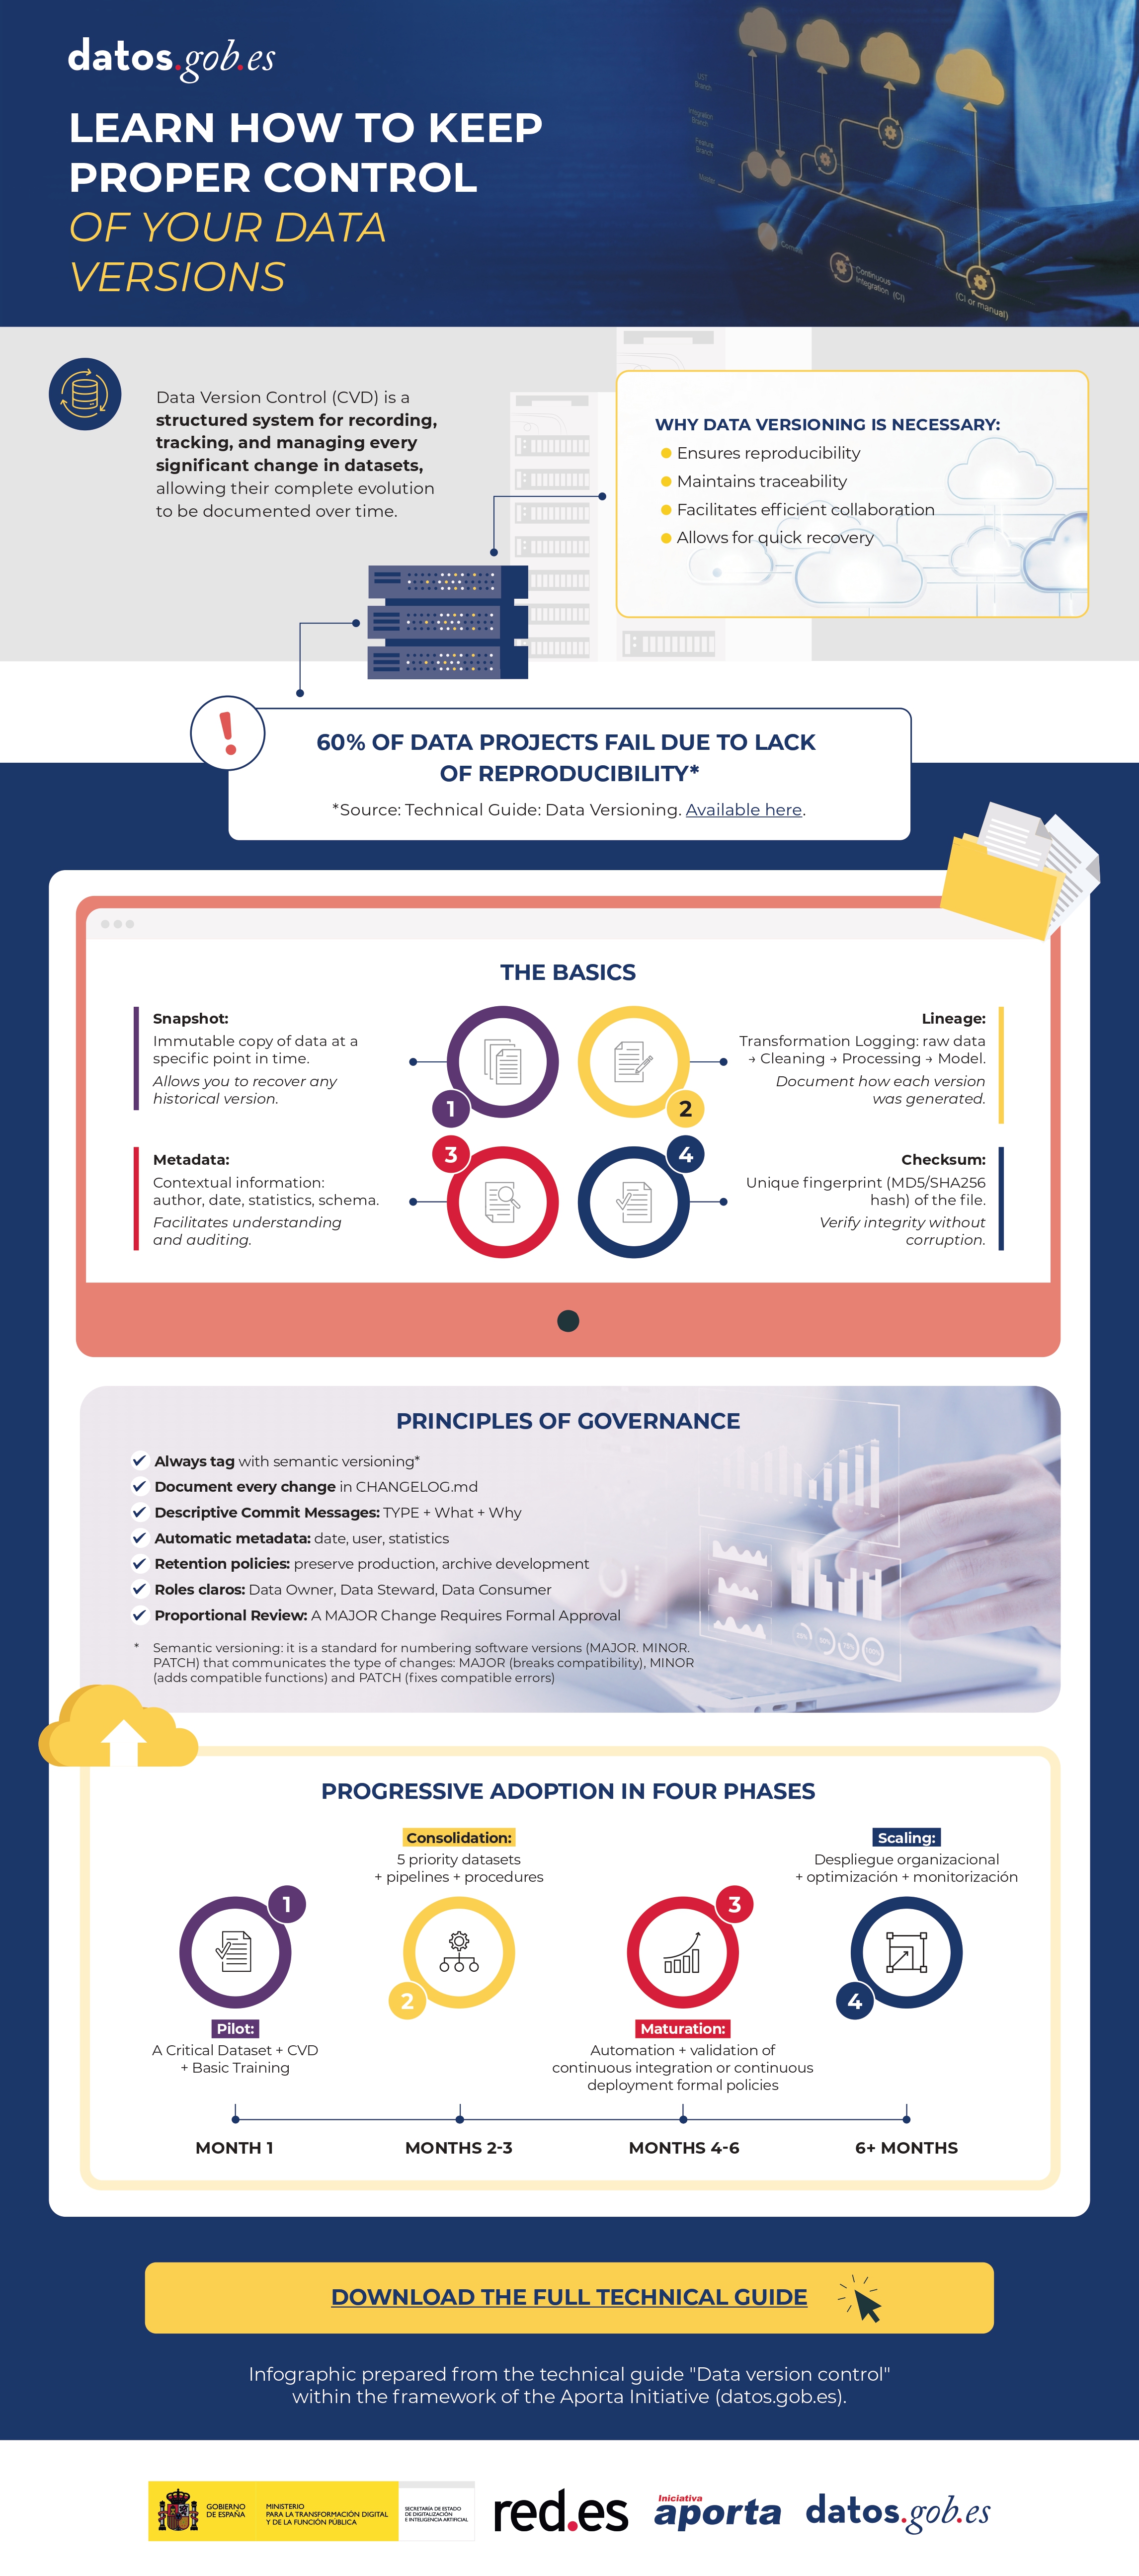
Blog
We live surrounded by AI-generated summaries. We have had the option of generating them for months, but now they are imposed on digital platforms as the first content that our eyes see when using a search engine or opening an email thread. On platforms such as Microsoft Teams or Google Meet, video call meetings are transcribed and summarized in automatic minutes for those who have not been able to be present, but also for those who have been there. However, what a language model has considered important, is it really important for the person receiving the summary?
In this new context, the key is to learn to recover the meaning behind so much summarized information. These three strategies will help you transform automatic content into an understanding and decision-making tool.
1. Ask expansive questions
We tend to summarize to reduce content that we are not able to cover, but we run the risk of associating brief with significant, an equivalence that is not always fulfilled. Therefore, we should not focus from the beginning on summarizing, but on extracting relevant information for us, our context, our vision of the situation and our way of thinking. Beyond the basic prompt "give me a summary", this new way of approaching content that escapes us consists of cross-referencing data, connecting dots and suggesting hypotheses, which they call sensemaking. And it happens, first of all, to be clear about what we want to know.
Practical situation:
Imagine a long meeting that we have not been able to attend. That afternoon, we received in our email a summary of the topics discussed. It's not always possible, but a good practice at this point, if our organization allows it, is not to just stay with the summary: if allowed, and always respecting confidentiality guidelines, upload the full transcript to a conversational system such as Copilot or Gemini and ask specific questions:
-
Which topic was repeated the most or received the most attention during the meeting?
-
In a previous meeting, person X used this argument. Was it used again? Did anyone discuss it? Was it considered valid?
-
What premises, assumptions or beliefs are behind this decision that has been made?
-
At the end of the meeting, what elements seem most critical to the success of the project?
-
What signs anticipate possible delays or blockages? Which ones have to do with or could affect my team?
Beware of:
First of all, review and confirm the attributions. Generative models are becoming more and more accurate, but they have a great ability to mix real information with false or generated information. For example, they can attribute a phrase to someone who did not say it, relate ideas as cause and effect that were not really connected, and surely most importantly: assign tasks or responsibilities for next steps to someone who does not correspond.
2. Ask for structured content
Good summaries are not shorter, but more organized, and the written text is not the only format we can use. Look for efficiency and ask conversational systems to return tables, categories, decision lists or relationship maps. Form conditions thought: if you structure information well, you will understand it better and also transmit it better to others, and therefore you will go further with it.
Practical situation:
In this case, let's imagine that we received a long report on the progress of several internal projects of our company. The document has many pages with paragraphs descriptive of status, feedback, dates, unforeseen events, risks and budgets. Reading everything line by line would be impossible and we would not retain the information. The good practice here is to ask for a transformation of the document that is really useful to us. If possible, upload the report to the conversational system and request structured content in a demanding way and without skimping on details:
-
Organize the report in a table with the following columns: project, responsible, delivery date, status, and a final column that indicates if any unforeseen event has occurred or any risk has materialized. If all goes well, print in that column "CORRECT".
-
Generate a visual calendar with deliverables, their due dates, and assignees, starting on October 1, 2025 and ending on January 31, 2026, in the form of a Gantt chart.
-
I want a list that only includes the name of the projects, their start date, and their due date. Sort by delivery date, closest first.
-
From the customer feedback section that you will find in each project, create a table with the most repeated comments and which areas or teams they usually refer to. Place them in order, from the most repeated to the least.
-
Give me the billing of the projects that are at risk of not meeting deadlines, indicate the price of each one and the total.
Beware of:
The illusion of veracity and completeness that a clean, orderly, automatic text with fonts will provide us is enormous. A clear format, such as a table, list, or map, can give a false sense of accuracy. If the source data is incomplete or wrong, the structure only makes up the error and we will have a harder time seeing it. AI productions are usually almost perfect. At the very least, and if the document is very long, do random checks ignoring the form and focusing on the content.
3. Connect the dots
Strategic sense is rarely in an isolated text, let alone in a summary. The advanced level in this case consists of asking the multimodal chat to cross-reference sources, compare versions or detect patterns between various materials or formats, such as the transcript of a meeting, an internal report and a scientific article. What is really interesting to see are comparative keys such as evolutionary changes, absences or inconsistencies.
Practical situation:
Let's imagine that we are preparing a proposal for a new project. We have several materials: the transcript of a management team meeting, the previous year's internal report, and a recent article on industry trends. Instead of summarizing them separately, you can upload them to the same conversation thread or chat you've customized on the topic, and ask for more ambitious actions.
-
Compare these three documents and tell me which priorities coincide in all of them, even if they are expressed in different ways.
-
What topics in the internal report were not mentioned at the meeting? Generate a hypothesis for each one as to why they have not been treated.
-
What ideas in the article might reinforce or challenge ours? Give me ideas that are not reflected in our internal report.
-
Look for articles in the press from the last six months that support the strong ideas of the internal report.
-
Find external sources that complement the information missing in these three documents on topic X, and generate a panoramic report with references.
Beware of:
It is very common for AI systems to deceptively simplify complex discussions, not because they have a hidden purpose but because they have always been rewarded for simplicity and clarity in training. In addition, automatic generation introduces a risk of authority: because the text is presented with the appearance of precision and neutrality, we assume that it is valid and useful. And if that wasn't enough, structured summaries are copied and shared quickly. Before forwarding, make sure that the content is validated, especially if it contains sensitive decisions, names, or data.
AI-based models can help you visualize convergences, gaps, or contradictions and, from there, formulate hypotheses or lines of action. It is about finding with greater agility what is so valuable that we call insights. That is the step from summary to analysis: the most important thing is not to compress the information, but to select it well, relate it and connect it with the context. Intensifying the demand from the prompt is the most appropriate way to work with AI systems, but it also requires a previous personal effort of analysis and landing.
Content created by Carmen Torrijos, expert in AI applied to language and communication. The content and views expressed in this publication are the sole responsibility of the author.