Blog
In an increasingly data-driven world, all organisations, both private companies and public bodies, are looking to leverage their information to make better decisions, improve the efficiency of their processes and meet their strategic objectives. However, creating an effective data strategy is a challenge that should not be underestimated.
Often, organisations in all sectors fall into common mistakes that can compromise the success of their strategies from the outset. From ignoring the importance of data governance to not aligning strategic objectives with the real needs of the institution, these failures can result in inefficiencies, non-compliance with regulations and even loss of trust by citizens, employees or users.
In this article, we will explore the most common mistakes in creating a data strategy, with the aim of helping both public and private entities to avoid them. Our goal is to provide you with the tools to build a solid foundation to maximise the value of data for the benefit of your mission and objectives.
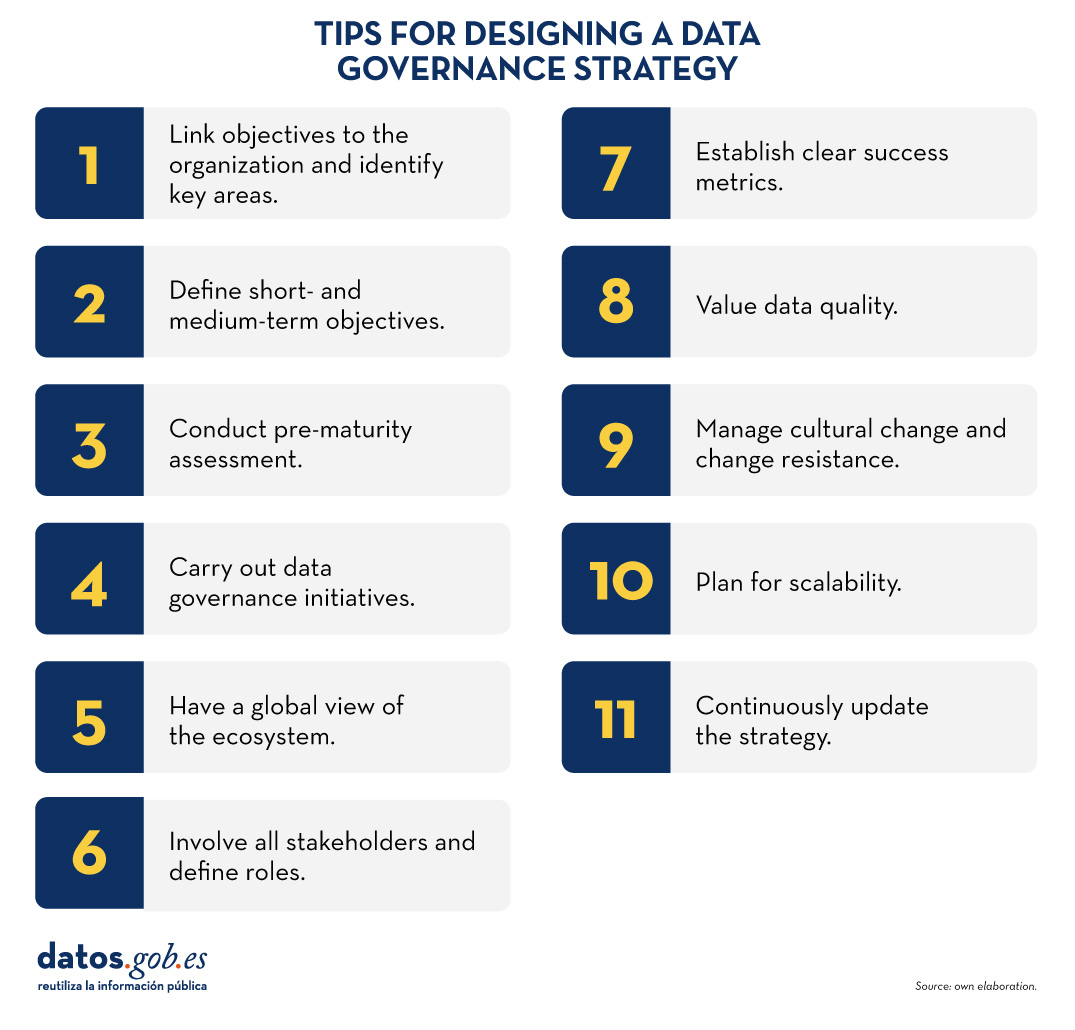
Figure 1. Tips for designing a data governance strategy. Source: own elaboration.
The following are some of the most common mistakes in developing a data strategy, justifying their impact and the extent to which they can affect an organisation:
Lack of linkage to organisational objectives and failure to identify key areas
For data strategy to be effective in any type of organisation, it is essential that it is aligned with its strategic objectives. These objectives include key areas such as revenue growth, service improvement, cost optimisation and customer/citizen experience. In addition, prioritising initiatives is essential to identify the areas of the organisation that will benefit most from the data strategy. This approach not only allows maximising the return on data investment, but also ensures that initiatives are clearly connected to desired outcomes, reducing potential gaps between data efforts and strategic objectives.
Failure to define clear short- and medium-term objectives
Defining specific and achievable goals in the early stages of a data strategy is very important to set a clear direction and demonstrate its value from the outset. This boosts the motivation of the teams involved and builds trust between leaders and stakeholders. Prioritising short-term objectives, such as implementing a dashboard of key indicators or improving the quality of a specific set of critical data, delivers tangible results quickly and justifies the investment in the data strategy. These initial achievements not only consolidate management support, but also strengthen the commitment of the teams.
Similarly, medium-term objectives are essential to build on initial progress and prepare the ground for more ambitious projects. For example, the automation of reporting processes or the implementation of predictive models for key areas can be intermediate goals that demonstrate the positive impact of the strategy on the organisation. These achievements allow us to measure progress, evaluate the success of the strategy and ensure that it is aligned with the organisation's strategic priorities.
Setting a combination of short- and medium-term goals ensures that the data strategy remains relevant over time and continues to generate value. This approach helps the organisation to move forward in a structured way, strengthening its position both vis-à-vis its competitors and in fulfilling its mission in the case of public bodies.
Failure to conduct a maturity assessment beforehand to define the strategy as narrowly as possible.
Before designing a data strategy, it is crucial to conduct a pre-assessment to understand the current state of the organisation in terms of data and to realistically and effectively scope it. This step not only prevents efforts from being dispersed, but also ensures that the strategy is aligned with the real needs of the organisation, thus maximising its impact. Without prior assessment, it is easy to fall into the error of taking on initiatives that are too broad or poorly connected to strategic priorities .
Therefore, conducting this pre-assessment is not only a technical exercise, but a strategic tool to ensure that resources and efforts are well targeted from the outset. With a clear diagnosis, the data strategy becomes a solid roadmap, capable of generating tangible results from the earliest stages. It should be recalled that the UNE 0080:2023, which focuses on the assessment of the maturity of data governance and management, provides a structured framework for this initial assessment. This standard allows for an objective analysis of the organisation's processes, technologies and capabilities around data..
Failure to carry out data governance initiatives
The definition of a sound strategy is fundamental to the success of data governance initiatives. It is essential to have an area or unit responsible for data governance, such as a data office or a centre of excellence, where clear guidelines are established and the necessary actions are coordinated to achieve the committed strategic objectives. These initiatives must be aligned with the organisation's priorities, ensuring that the data is secure, usable for its intended purpose and compliant with applicable laws and regulations.
A robust data governance framework is key to ensuring consistency and quality of data, strengthening confidence in reporting and analysis that generates both internal and external value. In addition, an appropriate approach reduces risks such as non-compliance, promoting effective use of data and protecting the organisation's reputation.
It is therefore important to design these initiatives with a holistic approach, prioritising collaboration between different areas and aligning them with the overall data strategy. For more information on how to structure an effective data governance system, see this series of articles: From data strategy to data governance system - Part 1.
Focusing exclusively on technology
Many organisations have the mistaken view that acquiring sophisticated tools and platforms will be the ultimate solution to their data problems. However, technology is only one part of the ecosystem. Without the right processes, governance framework and, of course, people, even the best technology will fail. This is problematic because it can lead to huge investments with no clear return, as well as frustration among teams when they do not get the expected results.
Failure to involve all stakeholders and define roles and responsibilities
A sound data strategy needs to bring together all relevant actors, whether in a public administration or in a private company. Each area, department or unit has a unique vision of how data can be useful to achieve objectives, improve services or make more informed decisions. Therefore, involving all stakeholders from the outset not only enriches the strategy, but also ensures that they are aligned with the real needs of the organisation.
Likewise, defining clear roles and responsibilities is key to avoid confusion and duplication. Knowing who is responsible for the data, who manages it and who uses it ensures a more efficient workflow and fosters collaboration between teams. In both the public and private spheres, this approach helps to maximise the impact of the data strategy, ensuring that efforts are coordinated and focused towards a common goal.
Failure to establish clear metrics of success
Establishing key performance indicators (KPIs) is essential to assess whether initiatives are generating value. KPIs help demonstrate the results of the data strategy, reinforcing leadership support and encouraging willingness to invest in the future. By measuring the impact of actions, organisations can guarantee the sustainability and continuous development of their strategy, ensuring that it is aligned with strategic objectives and delivers tangible benefits.
Failure to place data quality at the centre
A sound data strategy must be built on a foundation of reliable and high quality data. Ignoring this aspect can lead to wrong decisions, inefficient processes and loss of trust in data by teams. Data quality is not just a technical aspect, but a strategic enabler: it ensures that the information used is complete, consistent, valid and timely.
Integrating data quality from the outset involves defining clear metrics, establishing validation and cleansing processes, and assigning responsibilities for their maintenance. Furthermore, by placing data quality at the heart of the strategy, organisations can unlock the true potential of data, ensuring that it accurately supports business objectives and reinforces user confidence. Without quality, the strategy loses momentum and becomes a wasted opportunity.
Failure to manage cultural change and resistance to change
The transition to a data-driven organisation requires not only tools and processes, but also a clear focus on change management to engage employees. Promoting an open mind towards new practices is key to ensuring the adoption and success of the strategy. By prioritising communication, training and team engagement, organisations can facilitate this cultural change, ensuring that all levels work in alignment with strategic objectives and maximising the impact of the data strategy.
Not planning for scalability
It is critical for organisations to consider how their data strategy can scale as the volume of information grows. Designing a strategy ready to handle this growth ensures that systems can support the increase in data without the need for future restructuring, optimising resources and avoiding additional costs. By planning for scalability, organisations can ensure long-term sustainable operational efficiency and maximise the value of their data as their needs evolve.
Lack of continuous updating and review of the strategy
Data and organisational needs are constantly evolving, so it is important to regularly review and adapt the strategy to keep it relevant and effective. A flexible and up-to-date data strategy allows you to respond nimbly to new opportunities and challenges, ensuring that you continue to deliver value as market or organisational priorities change. This proactive approach ensures that the strategy remains aligned with strategic objectives and reinforces its long-term positive impact.
In conclusion, it is important to highlight that the success of a data strategy lies in its ability to align with the strategic objectives of the organisation, setting clear goals and encouraging the participation of all areas involved. A good data governance system, accompanied by metrics to measure its impact, is the basis for ensuring that the strategy generates value and is sustainable over time.
In addition, addressing issues such as data quality, cultural change and scalability from the outset is essential to maximise its effectiveness. Focusing exclusively on technology or neglecting these elements can limit results and jeopardise the organisation's ability to adapt to new opportunities and challenges. Finally, continuously reviewing and updating the strategy ensures its relevance and reinforces its positive impact.
To learn more about how to structure an effective data strategy and its connection with a solid data governance system, we recommend exploring the articles published in datos.gob.es: From Data Strategy to Data Governance System - Part 1 and Part 2.. These resources complement the concepts presented in this article and offer practical insights for implementation in any type of organisation.
Content elaborated by Dr. Fernando Gualo, Professor at UCLM and Data Governance and Quality Consultant. The content and the point of view reflected in this publication are the sole responsibility of its author.
Blog
The ability to collect, analyse and share data plays a crucial role in the context of the global challenges we face as a society today. From pollution and climate change, through poverty and pandemics, to sustainable mobility and lack of access to basic services. Global problems require solutions that can be adapted on a large scale. This is where open data can play a key role, as it allows governments, organisations and citizens to work together in a transparent way, and facilitates the process of achieving effective, innovative, adaptable and sustainable solutions.
The World Bank as a pioneer in the comprehensive use of open data
One of the most relevant examples of good practices that we can find when it comes to expressing the potential of open data to tackle major global challenges is, without a doubt, the case of the World Bank, a benchmark in the use of open data for more than a decade now as a fundamental tool for sustainable development.
Since the launch of its open data portal in 2010, the institution has undergone a complete transformation process in terms of data access and use. This portal, totally innovative at the time, quickly became a reference model by offering free and open access to a wide range of data and indicators covering more than 250 economies. Moreover, its platform is constantly being updated and bears little resemblance to the initial version at present, as it is continuously improving and providing new datasets and complementary and specialised tools with the aim of making data always accessible and useful for decision making. Examples of such tools include:
- The Poverty and Inequality Platform (PIP): designed to monitor and analyse global poverty and inequality. With data from more than 140 countries, this platform allows users to access up-to-date statistics and better understand the dynamics of collective well-being. It also facilitates data visualisation through interactive graphs and maps, helping users to gain a clear and quick understanding of the situation in different regions and over time.
- The Microdata Library: provides access to household and enterprise level survey and census data in several countries. The library has more than 3,000 datasets from studies and surveys conducted by the Bank itself, as well as by other international organisations and national statistical agencies. The data is freely available and fully accessible for downloading and analysis.
- The World Development Indicators (WDI): are an essential tool for tracking progress on the global development agenda. This database contains a vast collection of economic, social and environmental development indicators, covering more than 200 countries and territories. It has data covering areas such as poverty, education, health, environmental sustainability, infrastructure and trade. The WDIs provide us with a reliable frame of reference for analysing global and regional development trends.

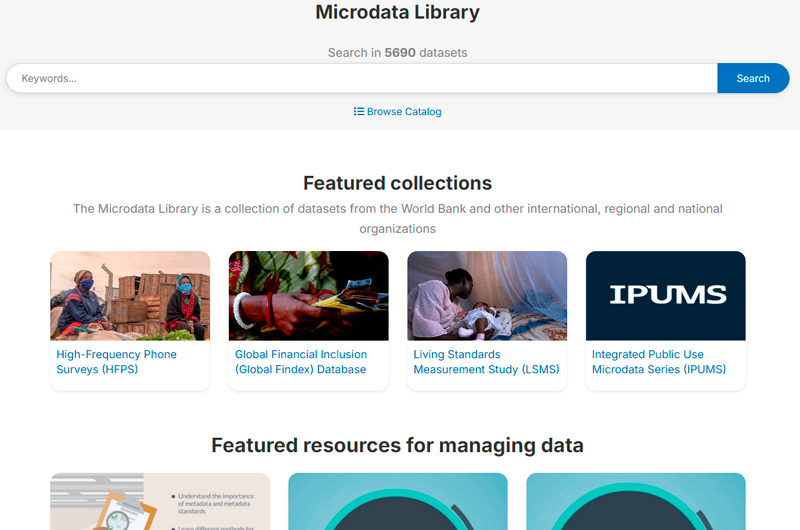

Figure 1. Screenshots of the web portals Poverty and Inequality Platform (PIP), Microdata Library and World Development Indicators (WDI).
Data as a transformative element for change
A major milestone in the World Bank's use of data was the publication of the World Development Report 2021, entitled "data for better lives". This report has become a flagship publication that explores the transformative potential of data to address humanity's grand challenges, improve the results of development efforts and promote inclusive and equitable growth. Through the report, the institution advocates a new social agenda for data, including robust, ethical and responsible governance of data, maximising its value in order to generate significant economic and social benefit.
The report examines how data can be integrated into public policy and development programmes to address global challenges in areas such as education, health, infrastructure and climate change. But it also marked a turning point in reinforcing the World Bank's commitment to data as a driver of change in tackling major challenges, and has since adopted a new roadmap with a more innovative, transformative and action-oriented approach to data use. Since then, they have been moving from theory to practice through their own projects, where data becomes a fundamental tool throughout the strategic cycle, as in the following examples:
- Open Data and Disaster Risk Reduction: the report "Digital Public Goods for Disaster Risk Reduction in a Changing Climate" highlights how open access to geospatial and meteorological data facilitates more effective decision-making and strategic planning. Reference is also made to tools such as OpenStreetMap that allow communities to map vulnerable areas in real time. This democratisation of data strengthens emergency response and builds the resilience of communities at risk from floods, droughts and hurricanes.
- Open data in the face of agri-food challenges: the report "What's cooking?" shows how open data is revolutionising global agri-food systems, making them more inclusive, efficient and sustainable. In agriculture, access to open data on weather patterns, soil quality and market prices empowers smallholder farmers to make informed decisions. In addition, platforms that provide open geospatial data serve to promote precision agriculture, enabling the optimisation of key resources such as water and fertilisers, while reducing costs and minimising environmental impact.
- Optimising urban transport systems: in Tanzania, the World Bank has supported a project that uses open data to improve the public transport system. The rapid urbanisation of Dar es Salaam has led to considerable traffic congestion in several areas, affecting both urban mobility and air quality. This initiative addresses traffic congestion through a real-time information system that improves mobility and reduces environmental impact. This approach, based on open data, not only increases transport efficiency, but also contributes to a better quality of life for city dwellers.
Leading by example
Finally, and within this same comprehensive vision, it is worth noting how this international organization closes the circle of open data through its use as a tool for transparency and communication of its own activities.That is why among the outstanding data tools in its catalogue we can find some of them:
- Its project and operations portal: a tool that provides detailed access to the development projects that the institution funds and implements around the world. This portal acts as a window into all its global initiatives, providing information on objectives, funding, expected results and progress for the Bank's thousands of projects.
- The Finances One platform: on which they centralise all their financial data of public interest and those corresponding to the project portfolio of all the group's entities. It aims to simplify the presentation of financial information, facilitating its analysis and sharing by customers and partners.
The future impact of open data on major global challenges
As we have also seen above, opening up data offers immense potential to advance the sustainable development agenda and thus be able to address global challenges more effectively. The World Bank has been demonstrating how this practice can evolve and adapt to current challenges. Its leadership in this area has served as a model for other institutions, showing the positive impact that open data can have on sustainable development and in tackling the major challenges affecting the lives of millions of people around the world.
However, there is still a long way to go, as transparency and access to information policies need to be further improved so that data can reach the benefit of society as a whole in a more equitable way. In addition, another key challenge is to strengthen the capacities needed to maximise the use and impact of this data, particularly in developing countries. This implies not only going beyond facilitating access, but also working on data literacy and supporting the creation of the right tools to enable information to be used effectively.
The use of open data is enabling more and more actors to participate in the creation of innovative solutions and bring about real change. All this gives rise to a new and expanding area of work that, in the right hands and with the right support, can play a crucial role in creating a safer, fairer and more sustainable future for all. We hope that many organisations will follow the World Bank's example and also adopt a holistic approach to using data to address humanity's grand challenges.
Content prepared by Carlos Iglesias, Open data Researcher and consultant, World Wide Web Foundation. The contents and views reflected in this publication are the sole responsibility of the author.
Blog
There is no doubt that data has become the strategic asset for organisations. Today, it is essential to ensure that decisions are based on quality data, regardless of the alignment they follow: data analytics, artificial intelligence or reporting. However, ensuring data repositories with high levels of quality is not an easy task, given that in many cases data come from heterogeneous sources where data quality principles have not been taken into account and no context about the domain is available.
To alleviate as far as possible this casuistry, in this article, we will explore one of the most widely used libraries in data analysis: Pandas. Let's check how this Python library can be an effective tool to improve data quality. We will also review the relationship of some of its functions with the data quality dimensions and properties included in the UNE 0081 data quality specification, and some concrete examples of its application in data repositories with the aim of improving data quality.
Using Pandas for data profiling
Si bien el data profiling y la evaluación de calidad de datos están estrechamente relacionados, sus enfoques son diferentes:
- Data Profiling: is the process of exploratory analysis performed to understand the fundamental characteristics of the data, such as its structure, data types, distribution of values, and the presence of missing or duplicate values. The aim is to get a clear picture of what the data looks like, without necessarily making judgements about its quality.
- Data quality assessment: involves the application of predefined rules and standards to determine whether data meets certain quality requirements, such as accuracy, completeness, consistency, credibility or timeliness. In this process, errors are identified and actions to correct them are determined. A useful guide for data quality assessment is the UNE 0081 specification.
It consists of exploring and analysing a dataset to gain a basic understanding of its structure, content and characteristics, before conducting a more in-depth analysis or assessment of the quality of the data. The main objective is to obtain an overview of the data by analysing the distribution, types of data, missing values, relationships between columns and detection of possible anomalies. Pandas has several functions to perform this data profiling.
En resumen, el data profiling es un paso inicial exploratorio que ayuda a preparar el terreno para una evaluación más profunda de la calidad de los datos, proporcionando información esencial para identificar áreas problemáticas y definir las reglas de calidad adecuadas para la evaluación posterior.
What is Pandas and how does it help ensure data quality?
Pandas is one of the most popular Python libraries for data manipulation and analysis. Its ability to handle large volumes of structured information makes it a powerful tool in detecting and correcting errors in data repositories. With Pandas, complex operations can be performed efficiently, from data cleansing to data validation, all of which are essential to maintain quality standards. The following are some examples of how to improve data quality in repositories with Pandas:
1. Detection of missing or inconsistent values: One of the most common data errors is missing or inconsistent values. Pandas allows these values to be easily identified by functions such as isnull() or dropna(). This is key for the completeness property of the records and the data consistency dimension, as missing values in critical fields can distort the results of the analyses.
-
# Identify null values in a dataframe.
df.isnull().sum()
2. Data standardisation and normalisation: Errors in naming or coding consistency are common in large repositories. For example, in a dataset containing product codes, some may be misspelled or may not follow a standard convention. Pandas provides functions like merge() to perform a comparison with a reference database and correct these values. This option is key to maintaining the dimension and semantic consistency property of the data.
# Substitution of incorrect values using a reference table
df = df.merge(product_codes, left_on='product_code', right_on='ref_code', how= 'left')
3. Validation of data requirements: Pandas allows the creation of customised rules to validate the compliance of data with certain standards. For example, if an age field should only contain positive integer values, we can apply a function to identify and correct values that do not comply with this rule. In this way, any business rule of any of the data quality dimensions and properties can be validated.
# Identify records with invalid age values (negative or decimals)
age_errors = df[(df['age'] < 0) | (df['age'] % 1 != 0)])
4. Exploratory analysis to identify anomalous patterns: Functions such as describe() or groupby() in Pandas allow you to explore the general behaviour of your data. This type of analysis is essential for detecting anomalous or out-of-range patterns in any data set, such as unusually high or low values in columns that should follow certain ranges.
# Statistical summary of the data
df.describe()
#Sort by category or property
df.groupby()
5. Duplication removal: Duplicate data is a common problem in data repositories. Pandas provides methods such as drop_duplicates() to identify and remove these records, ensuring that there is no redundancy in the dataset. This capacity would be related to the dimension of completeness and consistency.
# Remove duplicate rows
df = df.drop_duplicates()
Practical example of the application of Pandas
Having presented the above functions that help us to improve the quality of data repositories, we now consider a case to put the process into practice. Suppose we are managing a repository of citizens' data and we want to ensure:
- Age data should not contain invalid values (such as negatives or decimals).
- That nationality codes are standardised.
- That the unique identifiers follow a correct format.
- The place of residence must be consistent.
With Pandas, we could perform the following actions:
1. Age validation without incorrect values:
# Identify records with ages outside the allowed ranges (e.g. less than 0 or non-integers)
age_errors = df[(df['age'] < 0) | (df['age'] % 1 != 0)])
2. Correction of nationality codes:
# Use of an official dataset of nationality codes to correct incorrect entries
df_corregida = df.merge(nacionalidades_ref, left_on='nacionalidad', right_on='codigo_ref', how='left')
3. Validation of unique identifiers:
# Check if the format of the identification number follows a correct pattern
df['valid_id'] = df['identificacion'].str.match(r'^[A-Z0-9]{8}$')
errores_id = df[df['valid_id'] == False]
4. Verification of consistency in place of residence:
# Detect possible inconsistencies in residency (e.g. the same citizen residing in two places at the same time).
duplicados_residencia = df.groupby(['id_ciudadano', 'fecha_residencia'])['lugar_residencia'].nunique()
inconsistencias_residencia = duplicados_residencia[duplicados_residencia > 1]
Integration with a variety of technologies
Pandas is an extremely flexible and versatile library that integrates easily with many technologies and tools in the data ecosystem. Some of the main technologies with which Pandas is integrated or can be used are:
- SQL databases:
Pandas integrates very well with relational databases such as MySQL, PostgreSQL, SQLite, and others that use SQL. The SQLAlchemy library or directly the database-specific libraries (such as psycopg2 for PostgreSQL or sqlite3) allow you to connect Pandas to these databases, perform queries and read/write data between the database and Pandas.
- Common function: pd.read_sql() to read a SQL query into a DataFrame, and to_sql() to export the data from Pandas to a SQL table.
- REST and HTTP-based APIs:
Pandas can be used to process data obtained from APIs using HTTP requests. Libraries such as requests allow you to get data from APIs and then transform that data into Pandas DataFrames for analysis.
- Big Data (Apache Spark):
Pandas can be used in combination with PySpark, an API for Apache Spark in Python. Although Pandas is primarily designed to work with in-memory data, Koalas, a library based on Pandas and Spark, allows you to work with Spark distributed structures using a Pandas-like interface. Tools like Koalas help Pandas users scale their scripts to distributed data environments without having to learn all the PySpark syntax.
- Hadoop and HDFS:
Pandas can be used in conjunction with Hadoop technologies, especially the HDFS distributed file system. Although Pandas is not designed to handle large volumes of distributed data, it can be used in conjunction with libraries such as pyarrow or dask to read or write data to and from HDFS on distributed systems. For example, pyarrow can be used to read or write Parquet files in HDFS.
- Popular file formats:
Pandas is commonly used to read and write data in different file formats, such as:
- CSV: pd.read_csv()
- Excel: pd.read_excel() and to_excel().
- JSON: pd.read_json()
- Parquet: pd.read_parquet() for working with space and time efficient files.
- Feather: a fast file format for interchange between languages such as Python and R (pd.read_feather()).
- Data visualisation tools:
Pandas can be easily integrated with visualisation tools such as Matplotlib, Seaborn, and Plotly.. These libraries allow you to generate graphs directly from Pandas DataFrames.
- Pandas includes its own lightweight integration with Matplotlib to generate fast plots using df.plot().
- For more sophisticated visualisations, it is common to use Pandas together with Seaborn or Plotly for interactive graphics.
- Machine learning libraries:
Pandas is widely used in pre-processing data before applying machine learning models. Some popular libraries with which Pandas integrates are:
- Scikit-learn: la mayoría de los pipelines de machine learning comienzan con la preparación de datos en Pandas antes de pasar los datos a modelos de Scikit-learn.
- TensorFlow y PyTorch: aunque estos frameworks están más orientados al manejo de matrices numéricas (Numpy), Pandas se utiliza frecuentemente para la carga y limpieza de datos antes de entrenar modelos de deep learning.
- XGBoost, LightGBM, CatBoost: Pandas supports these high-performance machine learning libraries, where DataFrames are used as input to train models.
- Jupyter Notebooks:
Pandas is central to interactive data analysis within Jupyter Notebooks, which allow you to run Python code and visualise the results immediately, making it easy to explore data and visualise it in conjunction with other tools.
- Cloud Storage (AWS, GCP, Azure):
Pandas can be used to read and write data directly from cloud storage services such as Amazon S3, Google Cloud Storage and Azure Blob Storage. Additional libraries such as boto3 (for AWS S3) or google-cloud-storage facilitate integration with these services. Below is an example for reading data from Amazon S3.
import pandas as pd
import boto3
#Create an S3 client
s3 = boto3.client('s3')
#Obtain an object from the bucket
obj = s3.get_object(Bucket='mi-bucket', Key='datos.csv')
#Read CSV file from a DataFrame
df = pd.read_csv(obj['Body'])
10. Docker and containers:
Pandas can be used in container environments using Docker.. Containers are widely used to create isolated environments that ensure the replicability of data analysis pipelines .
In conclusion, the use of Pandas is an effective solution to improve data quality in complex and heterogeneous repositories. Through clean-up, normalisation, business rule validation, and exploratory analysis functions, Pandas facilitates the detection and correction of common errors, such as null, duplicate or inconsistent values. In addition, its integration with various technologies, databases, big dataenvironments, and cloud storage, makes Pandas an extremely versatile tool for ensuring data accuracy, consistency and completeness.
Content prepared by Dr. Fernando Gualo, Professor at UCLM and Data Governance and Quality Consultant. The content and point of view reflected in this publication is the sole responsibility of its author.
Evento
On 11, 12 and 13 November, a new edition of DATAforum Justice will be held in Granada. The event will bring together more than 100 speakers to discuss issues related to digital justice systems, artificial intelligence (AI) and the use of data in the judicial ecosystem.The event is organized by the Ministry of the Presidency, Justice and Relations with the Courts, with the collaboration of the University of Granada, the Andalusian Regional Government, the Granada City Council and the Granada Training and Management entity.
The following is a summary of some of the most important aspects of the conference.
An event aimed at a wide audience
This annual forum is aimed at both public and private sector professionals, without neglecting the general public, who want to know more about the digital transformation of justice in our country.
The DATAforum Justice 2024 also has a specific itinerary aimed at students, which aims to provide young people with valuable tools and knowledge in the field of justice and technology. To this end, specific presentations will be given and a DATAthon will be set up. These activities are particularly aimed at students of law, social sciences in general, computer engineering or subjects related to digital transformation. Attendees can obtain up to 2 ECTS credits (European Credit Transfer and Accumulation System): one for attending the conference and one for participating in the DATAthon.
Data at the top of the agenda
The Paraninfo of the University of Granada will host experts from the administration, institutions and private companies, who will share their experience with an emphasis on new trends in the sector, the challenges ahead and the opportunities for improvement.
The conference will begin on Monday 11 November at 9:00 a.m., with a welcome to the students and a presentation of DATAthon. The official inauguration, addressed to all audiences, will be at 11:35 a.m. and will be given by Manuel Olmedo Palacios, Secretary of State for Justice, and Pedro Mercado Pacheco, Rector of the University of Granada.
From then on, various talks, debates, interviews, round tables and conferences will take place, including a large number of data-related topics. Among other issues, the data management, both in administrations and in companies, will be discussed in depth. It will also address the use of open data to prevent everything from hoaxes to suicide and sexual violence.
Another major theme will be the possibilities of artificial intelligence for optimising the sector, touching on aspects such as the automation of justice, the making of predictions. It will include presentations of specific use cases, such as the use of AI for the identification of deceased persons, without neglecting issues such as the governance of algorithms.
The event will end on Wednesday 13 at 17:00 hours with the official closing ceremony. On this occasion, Félix Bolaños, Minister of the Presidency, Justice and Relations with the Cortes, will accompany the Rector of the University of Granada.
A Datathon to solve industry challenges through data
In parallel to this agenda, a DATAthon will be held in which participants will present innovative ideas and projects to improve justice in our society. It is a contest aimed at students, legal and IT professionals, research groups and startups.
Participants will be divided into multidisciplinary teams to propose solutions to a series of challenges, posed by the organisation, using data science oriented technologies. During the first two days, participants will have time to research and develop their original solution. On the third day, they will have to present a proposal to a qualified jury. The prizes will be awarded on the last day, before the closing ceremony and the Spanish wine and concert that will bring the 2024 edition of DATAfórum Justicia to a close.
In the 2023 edition, 35 people participated, divided into 6 teams that solved two case studies with public data and two prizes of 1,000 euros were awarded.
How to register
The registration period for the DATAforum Justice 2024 is now open. This must be done through the event website, indicating whether it is for the general public, public administration staff, private sector professionals or the media.
To participate in the DATAthon it is necessary to register also on the contest site.
Last year's edition, focusing on proposals to increase efficiency and transparency in judicial systems, was a great success, with over 800 registrants. This year again, a large number of people are expected, so we encourage you to book your place as soon as possible. This is a great opportunity to learn first-hand about successful experiences and to exchange views with experts in the sector.
Blog
General ethical frameworks
The absence of a common, unified, ethical framework for the use of artificial intelligence in the world is only apparent and, in a sense, a myth. There are a multitude of supranational charters, manuals and sets of standards that set out principles of ethical use, although some of them have had to be updated with the emergence of new tools and uses. The OECD guide on ethical standards for the use of artificial intelligence, published in 2019 but updated in 2024, includes value-based principles as well as recommendations for policymakers. The UNESCO Global Observatory on Ethics and Governance of AI published in 2021 a material called Recommendation on the Ethics of AI adopted in the same year by 193 countries, and based on four basic principles: human rights, social justice, diversity and inclusiveness, and respect for the environmental ecosystem. Also in 2021, the WHO specifically included a document on Ethics and Governance of AI for Health in which they indicated the need to establish responsibilities for organisations in the use of AI when it affects patients and healthcare workers. However, various entities and sectors at different levels have taken the initiative to establish their own ethical standards and guidelines, more appropriate to their context. For example, in February 2024, the Ministry of Culture in Spain developed a good practice guide to establish, among other guidelines, that works created exclusively with generative AI would not be eligible for awards.
Therefore, the challenge is not the absence of global ethical guidelines, but the excessive globality of these frameworks. With the legitimate aim of ensuring that they stand the test of time, are valid for the specific situation of any country in the world and remain operational in the face of new disruptions, these general standards end up resorting to familiar concepts, such as those we can read in this other ethical guide from the World Economic Forum: explainability, transparency, reliability, robustness, privacy, security. Concepts that are too high, predictable, and almost always look at AI from the point of view of the developer and not the user.
Media manifestos
Along these lines, the major media groups have invested their efforts in developing specific ethical principles for the use of AI in the creation and dissemination of content, which for now constitutes a significant gap in the major frameworks and even in the European Regulation itself. These efforts have sometimes materialised individually, in the form of a manifesto, but also at a higher level as a collective. Among the most relevant manifestos are the one by Le Figaro, which editorial staff states that it will not publish any articles or visual content generated with AI, or that of The Guardian which, updated in 2023, states that AI is a common tool in newsrooms, but only to assist in ensuring the quality of their work. For their part, the Spanish media have not issued their own manifestos, but they have supported different collective initiatives. The Prisa Group, for example, appears in the list of organisations that subscribe to the Manifesto for Responsible and Sustainable AI, published by Forética in 2024. Also interesting are the statements of the heads of innovation and digital strategy at El País, El Español, El Mundo and RTVE that we found in an interview published on Fleet Street in April 2023. When asked whether there are any specific red lines in their media on the use of AI, they all stated that they are open-minded in their exploration and have not limited their use too much. Only RTVE, is not in the same position with a statement: "We understand that it is something complementary and to help us. Anything a journalist does, we don't want an AI to do. It has to be under our control.
Global principles of journalism
In the publishing context, therefore, we find a panorama of multiple regulations on three possible levels: manifestos specific to each medium, collective initiatives of the sector and adherence to general codes of ethics at national level. Against this backdrop, by the end of 2023 the News Media Alliance published the Global Principles for AI in Journalism, a document signed by international editorial groups that includes, in the form of a decalogue, 12 fundamental ethical principles divided into 8 blocks:
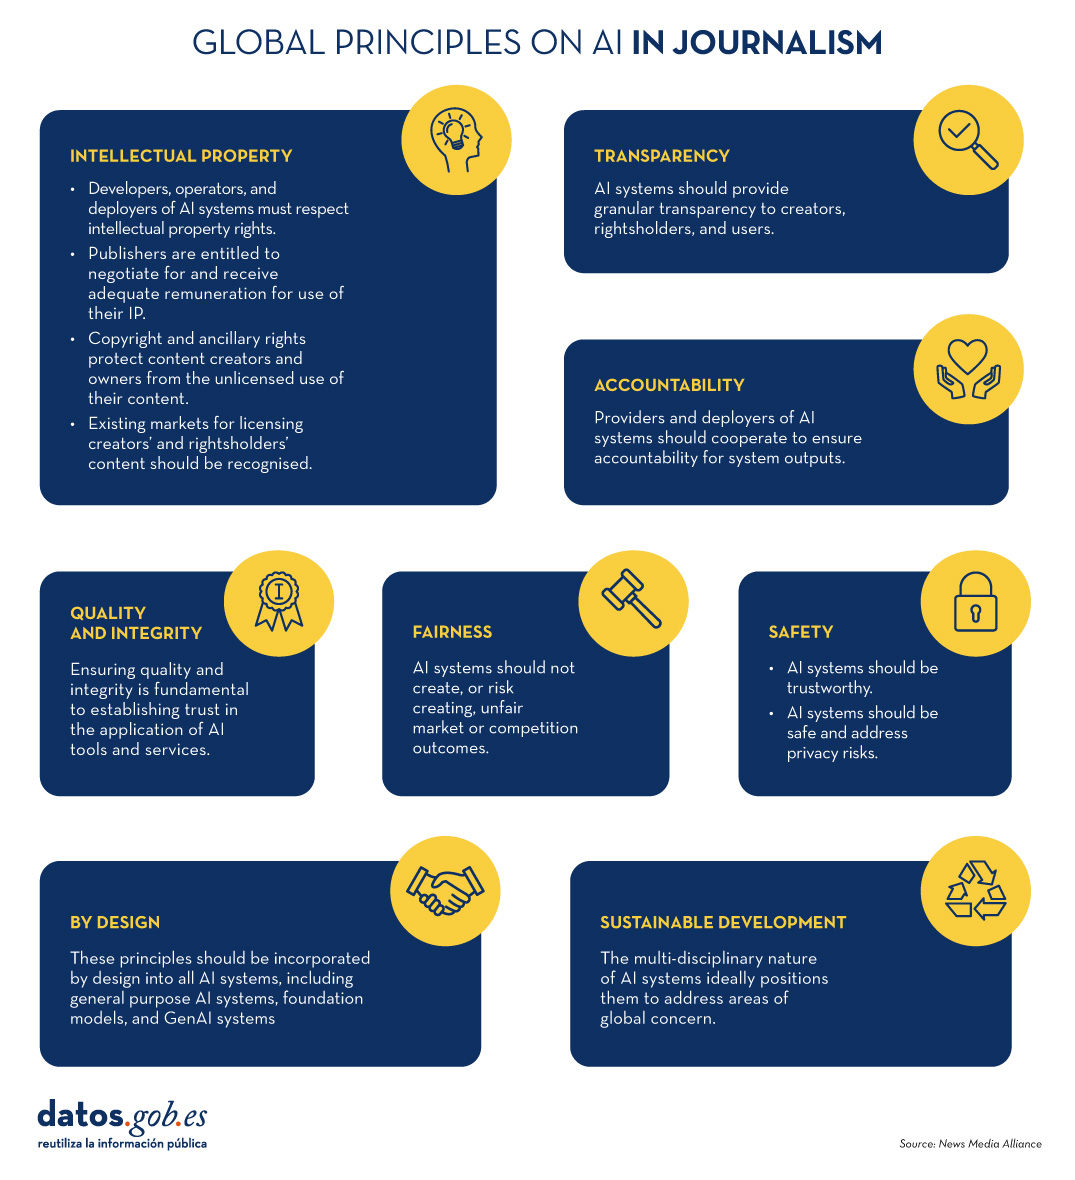
Figure 1. Global principles of AI in journalism, News Media Alliance.
When we review them in depth, we find in them some of the major conflicts that are shaping the development of modern artificial intelligence, connections with the European AI Regulation and claims that are constant on the part of content creators:
- Block 1: Intellectual property. It is the first and most comprehensive block, specifically developed in four complementary ethical principles. Although it seems the most obvious principle, it is aimed at focusing on one of the main conflicts of modern AI: the indiscriminate use of content published on the internet (text, image, video, music) to train learning models without consulting or remunerating the authors. The first ethical principle expresses the duty of AI system developers to respect restrictions or limitations imposed by copyright holders on access to and use of content. The second expresses the ability of these authors and publishing groups to negotiate fair remuneration for the use of their intellectual property. Third, it legitimises copyright as a sufficient basis in law to protect an author's content. The fourth calls for recognising and respecting existing markets for licensing, i.e. creating efficient contracts, agreements and market models so that AI systems can be trained with quality, but legitimate, authorised and licensed content.
- Block 2: Transparency. The second block is a logical continuation of the previous one, and advocates transparency in operation, a feature that brings value to both content authors and users of AI systems. This principle coincides with the central obligation that the European Regulation places on generative AI systems: they must be transparent from the outset and declare what content they have trained on, what procedures they have used to acquire it and to what extent they comply with the authors' intellectual property rights. This transparency is essential for creators and publishing groups to be able to enforce their rights, and it is further established that this principle must be universally adhered to, regardless of the jurisdiction in which the training or testing takes place.
- Block 3: Accountability. This word refers to the ability to be accountable for an action. The principle states that developers and operators of AI systems should be held accountable for the outputs generated by their systems, for example if they attribute content to authors that is not real, or if they contribute to misinformation or undermine trust in science or democratic values.
- Block 4: Quality and integrity. The basis of the principle is that AI-generated content must be accurate, correct and complete, and must not distort the original works. However, this superficial idea builds on a more ambitious one: that publishing and media groups should be guarantors of this quality and integrity, and thus official suppliers to AI system developers and providers. The fundamental argument is that the quality of the training content will define the quality of the outcomes of the system.
- Block 5: Fairness. The word fairness can also be translated as equity or impartiality. The principle states in its headline that the use of AI should not create market unfairness, anti-competitive practices or unfair competition, meaning that it should not be allowed to be used to promote abuses of dominance or to exclude rivals from the market. This principle is not aimed at regulating competition between AI developers, but between AI developers and content providers: AI-generated text, music or images should never compete on equal terms with author-generated content.
- Block 6: Safety. It is composed of two ethical principles. Building on the above, the first security principle states that generative AI systems must be reliable in terms of the information sources they use and promote, which must not alter or misrepresent the content, preserving its original integrity. The opposite could result in a weakening of the public's trust in original works, in authors and even in major media groups. This principle applies to a large extent to new AI-assisted search engines, such as the new Google Search (SGE), the new SearchGPT or Microsoft's own Copilot, which collect and recast information from different sources into a single generated paragraph. The second point unifies user data privacy issues into a single principle and, in just one sentence, refers to discriminatory bias. Developers must be able to explain how, when and for what purpose they use user data, and must ensure that systems do not produce, multiply or chronic biases that discriminate against individuals or groups.
- Block 7: By design. This is an overarching meta-principle, which states that all principles should be incorporated by design in all AI systems, generative or otherwise. Historically, ethics has been considered at the end of the development process, as a secondary or minor issue, so the principle argues that ethics should be a significant and fundamental concern from the very process of system design. Nor can ethical auditing be relegated only to cases where users file a complaint.
- Block 8: Sustainable development. It is apparently a global, far-reaching principle that AI systems should be aligned with human values and operate in accordance with global laws, in order to benefit all of humanity and future generations. However, in the last sentence we find the real orientation of the principle, a connection to publishing groups as data providers for AI systems: "Long-term funding and other incentives for providers of high-quality input data can help align systems with societal goals and extract the most relevant, up-to-date and actionable knowledge
The document is signed by 31 associations of publishing groups from countries such as Denmark, Korea, Canada, Colombia, Portugal, Brazil, Argentina, Japan or Sweden, by associations at European level, such as the European Publishers Council or News Media Europe, and associations at global level such as WAN-IFRA (World Association of News Publishers). The Spanish groups include the Asociación de Medios de Información (AMI) and the Asociación de Revistas (ARI).
Ethics as an instrument
The global principles of journalism promoted by the News Media Alliance are particularly precise in proposing grounded solutions to ethical dilemmas that are very representative of the current situation, such as the use of authored content for the commercial exploitation of AI systems. They are useful in trying to establish a solid and, above all, unified and global ethical framework that proposes consensual solutions. At the same time, other conflicts affecting the profession, which would also be included in this Decalogue, are conspicuously absent from the document. It is possible that the omnipresence of the constantly referenced data licensing conflict has overshadowed other concerns such as the new speed of disinformation, the ability of investigative journalism to verify authentic content, or the impact of fake news and deepfakes on democratic processes. The principles have focused on setting out the obligations that the big tech companies should have regarding the use of content, but perhaps an extension could be expected to address ethical responsibilities from the media's point of view, such as what ethical model the integration of AI into newsroom activity should be based on, and what the responsibility of journalists is in this new scenario. Finally, the document reveals a common duality: the channelling, through the ethical proposal, of the suggestion of concrete solutions that even point to possible trade and market agreements. It is a clear reflection of the potential capacity of ethics to be much more than a moral framework, and to become a multidimensional instrument to guide decision-making and influence the creation of public policy.
Content prepared by Carmen Torrijos, expert in AI applied to language and communication. The contents and points of view reflected in this publication are the sole responsibility of the author.
Noticia
The European open data portal (data.europa.eu) regularly organises virtual training sessions on topical issues in the open data sector, the regulations they affect and related technologies. In this post, we review the key takeaways from the latest webinar on High Value Datasets (HVD).
Among other issues, this seminar focused on transmitting best practices, as well as explaining the experiences of two countries, Finland and the Czech Republic, which were part of the report "High-value Datasets Best Practices in Europe", published by data.europa.eu, together with Denmark, Estonia, Italy, the Netherlands and Romania. The study was conducted immediately after the publication of the HVD implementation regulation in February 2023.
Best practices linked to the provision of high-value data
After an introduction explaining what high-value data are and what requirements they have to meet, the scope of the report was explained in detail during the webinar. In particular, challenges, good practices and recommendations from member states were identified, as detailed below.
Political and legal framework
- There is a need to foster a government culture that is primarily practical and focused on achievable goals, building on cultural values embedded in government systems, such as transparency.
- A strategic approach based on a broader regulatory perspective is recommended, building on previous efforts to implement far-reaching directives such as INSPIRE or DCAT as a standard for data publication. In this respect, it is appropriate to prioritise actions that overlap with these existing initiatives.
- The use of Creative Commons (CC) licences is recommended.
- On a cross-cutting level, another challenge is to combine compliance with the requirements of high-value datasets with the provisions of the General Data Protection Regulation (GDPR), when dealing with sensitive or personal data.
Governance and processes
- Engaging in strategic partnerships and fostering collaboration at national level is encouraged. Among other issues, it is recommended to coordinate efforts between ministries, agencies responsible for different categories of HVD and other related actors, especially in Member States with decentralised governance structures. To this end, it is important to set up interdisciplinary working groups to facilitate a comprehensive data inventory and to clarify which agency is responsible for which dataset. These groups will enable knowledge sharing and foster a sense of community and shared responsibility, which contributes to the overall success of data governance efforts.
- It is recommended to engage in regular exchanges with other Member States, to share ideas and solutions to common challenges.
- There is a need to promote sustainability through the individual accountability of agencies for their respective datasets. Ensuring the sustainability of national data portals means making sure that metadata is maintained with the resources available.
- It is advisable to develop a comprehensive data governance framework by first assessing available resources, including technical expertise, data management tools and key stakeholder input. This assessment process allows for a clear understanding of the rules, processes and responsibilities necessary for an effective implementation of data governance.
Technical aspects, metadata quality and new requirements
- It is proposed to develop a comprehensive understanding of the specific requirements for HVD. This involves identifying existing datasets to determine their compliance with the standards described in the implementing regulation for HVD. There is a need to build a systemic basis for identifying, improving the quality and availability of data by enhancing the overall value of high-value datasets.
- It is recommended to improve the quality of metadata directly at the data source before publishing them in portals, following the DCAT-AP guidelines for publishing high-value datasets and the controlled vocabularies for the six HVD categories. There is also a need to improve the implementation of APIs and bulk downloads from each data source. Its implementation presents significant challenges due to the scarcity of resources and expertise, making capacity building and resourcing essential.
- It is suggested to strengthen the availability of high-value datasets through external funding or strategic planning. The regulation requires all HVD to be accessible free of charge, so some Member States diversify funding sources by seeking financial support through external channels, e.g. by tapping into European projects. In this respect, it is recommended to adapt business models progressively to offer free data.
Finally, the report highlights a suggested eight-step roadmap for compliance with the HVD implementation regulation:
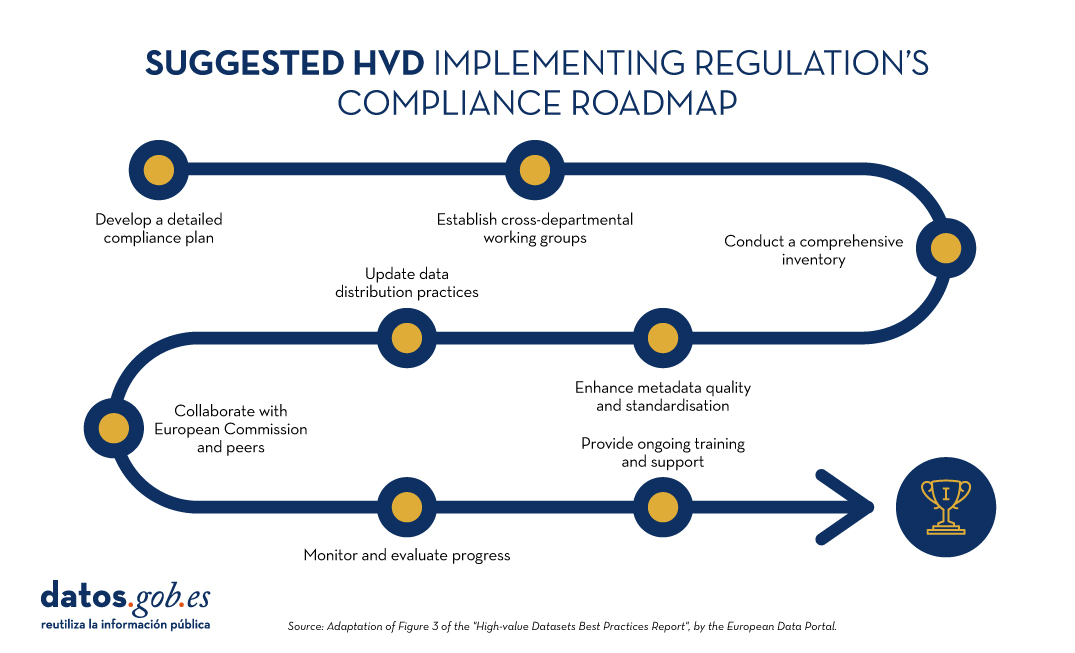
Figure 1: Suggested roadmap for HVD implementation. Adapted from Figure 3 of the European Data Portal's "High-value Datasets Best Practices Report".
The example of the Czech Republic
In a second part of the webinar, the Czech Republic presented their implementation case, which they are approaching from four main tasks: motivation, regulatory implementation, responsibility of public data provider agencies and technical requirements.
- Motivation among the different actors is being articulated through the constitution of working groups.
- Regulatory implementation focuses on dataset analysis and consistency or inconsistency with INSPIRE.
- To boost the accountability of public agencies, knowledge-sharing seminars are being held on linking INSPIRE and HVD using the DCAT-AP standard as a publication pathway.
- Regarding technical requirements, DCAT-AP and INSPIRE requirements are being integrated into metadata practices adapted to their national context. The Czech Republic has developed specifications for local open data catalogues to ensure compatibility with the National Open Data Catalogue. However, its biggest challenge is a strong dependency due to a lack of technical capacities.
The example of Finland
Finland then took the floor. Having pre-existing legislation (INSPIRE and other specific rules on open data and information management inpublic bodies), Finland required only minor adjustments to align with the national transposition of the HVD directive. The challenge is to understand and make INSPIRE and HVD coexist.
Its main strategy is based on the roadmap on information management in public bodies, which ensures harmonisation, interoperability, high quality management and security to implement the principles of open data. In addition, they have established two working groups to address the implementation of HVD:
- The first group, which is a coordinating group of data promoters, focused on practical and technical issues. As legal experts, they also provided guidance on understanding HVD regulation from a legal perspective.
- The second group is an inter-ministerial coordination group, a working group that ensures that there is no conflict or overlap between HVD regulation and national legislation. This group manages the inventory, in spreadsheet format, containing all the elements necessary for an HVD catalogue. By identifying areas where datasets do not meet these requirements, organisations can establish a roadmap to address the gaps and ensure full compliance over time.
The secretariat of the groups is provided by a geospatial data committee. Both have a wide network of stakeholders to articulate discussion and feedback on the measures taken.
Looking to the future, they highlight as a challenge the need to gain more technical and executive level experience.
End of the session
The webinar continued with the participation of Compass Gruppe (Germany), which markets, among other things, data from the Austrian commercial register. They have a portal that offers this data via APIs through a freemium business model.
In addition, it was recalled that Member States are obliged to report to Europe every two years on progress in HVD, an activity that is expected to boost the availability of harmonised federated metadata on the European data portal. The idea is that users will be able to find all HVD in the European Union, using the filtering available on the portal or through SPARQL queries.
The combination of the report's conclusions and the experiences of the rapporteur countries give us good clues to guide the implementation of HVD, in compliance with European regulations. In summary, the implementation of HVD poses the following challenges:
- Support the necessary funding to address the opening-up process.
- Overcoming technical challenges to develop efficient access APIs.
- Achieving a proper coexistence between INSPIRE and the HVD regulation
- Consolidate working groups that function as a robust mechanism for progress and convergence.
- Monitor progress and continuously follow up the process.
- Invest in technical training of staff.
- Create and maintain strong coordination in the face of the complex diversity of data holders.
- Potential quality assurance of high value datasets.
- Agree on a standardisation that is necessary from a business point of view.
By addressing these challenges, we will successfully open up high-value data, driving its re-use for the benefit of society as a whole.
You can re-watch the recording of the session here
Blog
Data activism is an increasingly significant citizen practice in the platform era for its growing contribution to democracy, social justice and rights. It is an activism that uses data and data analysis to generate evidence and visualisations with the aim of revealing injustices, improving people's lives and promoting social change.
In the face of the massive use of surveillance data by certain corporations, data activism is exercised by citizens and non-governmental organisations. For example, the organisation Forensic Architecture (FA)a centre at Goldsmiths under the University of London, investigates human rights violations, including state violence, using public, citizen and satellite data, and methodologies such as open source intelligence (known as OSINT). The analysis of data and metadata, the synchronisation of video footage taken by witnesses or journalists, as well as official recordings and documents, allows for the reconstruction of facts and the generation of an alternative narrative about events and crises.
Data activism has attracted the interest of research centres and non-governmental organisations, generating a line of work within the discipline of critical studies. This has allowed us to reflect on the effect of data, platforms and their algorithms on our lives, as well as on the empowerment that is generated when citizens exercise their right to data and use it for the common good.

Image 1: Ecocide in Indonesia (2015)
Source: Forensic Architecture (https://forensic-architecture.org/investigation/ecocide-in-indonesia)
Research centres such as Datactive o Data + Feminism Lab have created theory and debates on the practice of data activism. Likewise, organisations such as Algorights -a collaborative network that encourages civil society participation in the field of aI technologies- y AlgorithmWatch -a human rights organisation - generate knowledge, networks and arguments to fight for a world in which algorithms and artificial Intelligence (AI) contribute to justice, democracy and sustainability, rather than undermine them.
This article reviews how data activism emerged, what interest it has sparked in social science, and its relevance in the age of platforms.
History of a practice
The production of maps using citizen data could be one of the first manifestations of data activism as it is now known. A seminal map in the history of data activism was generated by victims and activists with data from the 2010 Haiti earthquakeon the Kenyan platform Ushahidi ("testimony" in Swahili). A community of digital humanitarianscreated the map from other countries and called on victims and their families and acquaintances to share data on what was happening in real time. Within hours, the data was verified and visualised on an interactive map that continued to be updated with more data and was instrumental in assisting the victims on the ground. Today, such mapsare generated whenever a crisis arises, and are enriched with citizen, satellite and camera-equipped drone data to clarify events and generate evidence.
Emerging from movements known as cypherpunk and technopositivism or technoptimism (based on the belief that technology is the answer to humanity's challenges), data activism has evolved as a practice to adopt more critical stances towards technology and the power asymmetries that arise between those who originate and hand over their data, and those who capture and analyse it.
Today, for example, the Ushahidi community map production platform has been used to create data on gender-based violence in Egypt and Syria, and on trusted gynaecologists in India, for example. Today, the invisibilisation and silencing of women is the reason why some organisations are fighting for recognition and a policy of visibility, something that became evident with the #MeToo movement. Feminist data practices seek visibility and critical interpretations of datification(or the transformation of all human and non-human action into measurable data that can be transformed into value). For example, Datos Contra el Feminicidio or Feminicidio.net offer maps and data analysis on femicide in various parts of the world.
The potential for algorithmic empowerment offered by these projects removes barriers to equality by improving the conditions conditions that enable women to solve problems, determine how data is collected and used, and exercise power.
Birth and evolution of a concept
In 2015, Citizen Media Meets Big Data: The Rise of Data Activismwas published, in which, for the first time, data activism was coined and defined as a concept based on practices observed in activists who engage politically with data infrastructure. Data infrastructure includes the data, software, hardware and processes needed to turn data into value. Later, Data activism and social change (London, Palgrave) and Data activism and social change. Alliances, maps, platforms and action for a better world (Madrid: Dykinson) develop analytical frameworks based on real cases that offer ways to analyse other cases.
Accompanying the varied practices that exist within data activism, its study is creating spaces for feminist and post-colonialist research on the consequences of datification. Whereas the chroniclers of history (mainly male sources) defined technology in relation to the value of their productsfeminist data studies consider women as users and designers of technology as users and designers of algorithmic systems and seek to use data for equality, and to move away from capitalist exploitation and its structures of domination.
Data activism is now an established concept in social science. For example, Google Scholar offers more than 2,000 results on "data activism". Several researchers use it as a perspective to analyse various issues. For example, Rajão and Jarke explore environmental activism in Brazil; Gezgin studies critical citizenship and its use of data infrastructure; Lehtiniemi and Haapoja explore data agency and citizen participation; and Scott examines the need for platform users to develop digital surveillance and care for their personal data.
At the heart of these concerns is the concept of data agency, which refers to people not only being aware of the value of their data, but also exercising control over it, determining how it is used and shared. It could be defined as actions and practices related to data infrastructure based on individual and collective reflection and interest. That is, while liking a post would not be considered an action with a high degree of data agency, participating in a hackathon - a collective event in which a computer programme is improved or created - would be. Data agency is based on data literacy, or the degree of knowledge, access to data and data tools, and opportunities for data literacy that people have. Data activism is not possible without a data agency.
In the rapidly evolving landscape of the platform economy, the convergence of data activism, digital rights and data agency has become crucial. Data activism, driven by a growing awareness of the potential misuse of personal data, encourages individuals and collectives to use digital technology for social change, as well as to advocate for greater transparency and accountability on the part of tech giants. As more and more data generation and the use of algorithms shape our lives in areas such as education, employment, social services and health, data activism emerges as a necessity and a right, rather than an option.
____________________________________________________________________
Content prepared by Miren Gutiérrez, PhD and researcher at the University of Deusto, expert in data activism, data justice, data literacy and gender disinformation.
The contents and views reflected in this publication are the sole responsibility of its author.
Documentación
The Open Data Maturity Study 2022 provides a snapshot of the level of development of policies promoting open data in countries, as well as an assessment of the expected impact of these policies. Among its findings, it highlights that measuring the impact of open data is a priority, but also a major challenge across Europe.
In this edition, there has been a 7% decrease in the average maturity level in the impact dimension for EU27 countries, which coincides with the restructuring of the impact dimension indicators. However, it is not so much a decrease in the level of maturity, but a more accurate picture of the difficulty in assessing the resulting impact of reuse of open data difficulty in assessing the impact resulting from the re-use of open data.
Therefore, in order to better understand how to make progress on the challenge of measuring the impact of open data, we have looked at existing best practices for measuring the impact of open data in Europe. To achieve this objective, we have worked with the data provided by the countries in their responses to the survey questionnaire and in particular with those of the eleven countries that have scored more than 500 points in the Impact dimension, regardless of their overall score and their position in the ranking: France, Ireland, Cyprus, Estonia and the Czech Republic scoring the maximum 600 points; and Poland, Spain, Italy, Denmark and Sweden scoring above 510 points.
In the report we provide a country profile for each of the ten countries, analysing in general terms the country's performance in all dimensions of the study and in detail the different components of the impact dimension, summarising the practices that have led to its high score based on the analysis of the responses to the questionnaire.
Through this tabbed structure the document allows for a direct comparison between country indicators and provides a detailed overview of best practices and challenges in the use of open data in terms of measuring impact through the following indicators:
- "Strategic awareness": It quantifies the awareness and preparedness of countries to understand the level of reuse and impact of open data within their territory.
- "Measuring reuse": It focuses on how countries measure open data re-use and what methods they use.
-
"Impact created": It collects data on the impact created within four impact areas: government impact (formerly policy impact), social impact, environmental impact and economic impact.
Finally, the report provides a comparative analysis of these countries and draws out a series of recommendations and good practices that aim to provide ideas on how to improve the impact of open data on each of the three indicators measured in the study.
If you want to know more about the content of this report, you can watch the interview with its author interview with its author.
Below, you can download the full report, the executive summary and a presentation-summary.
Content prepared by Jose Luis Marín, Senior Consultant in Data, Strategy, Innovation & Digitalization.
The contents and views expressed in this publication are the sole responsibility of the author.
Blog
The Multisectorial Association of Information (ASEDIE), which brings together the infomediary companies of our country, once again includes among its annual objectives the promotion of the reuse of public and private information. Thus, and almost in parallel to the beginning of the new year, last December, ASEDIE shared the progress that the top 3 has experienced in most of the autonomous communities, and the good expectations for the second edition.
Since this initiative was launched last 2019 to promote the opening of three datasets by the autonomous communities, they have been gradually opening datasets that have improved access to information sources, while helping to boost the development of services and applications based on open data. The objective of this project, which in 2021 was included as a commitment to Best Practices in the Observatory of the IV Open Government Plan and supported by the seventeen Autonomous Communities, is to harmonize the opening of Public Sector databases with the aim of encouraging their reuse, promoting the development of the data economy.
First edition: accessible in fifteen autonomous communities
The first edition of Asedie's Top 3 was a success not only because of the datasets selected, but also because of the openness rate achieved four years later. Currently, fifteen of the country's seventeen autonomous communities have managed to open all three databases to the general public: cooperatives, foundations and associations.
2023: the year to complete the opening of the second edition
With the aim of continuing to promote the opening of public information in the different autonomous communities, in 2020, ASEDIE launched a new edition of the top 3 so that those communities that had already overcome the previous challenge could continue to make progress. Thus, for this second edition the selected databases were the following:
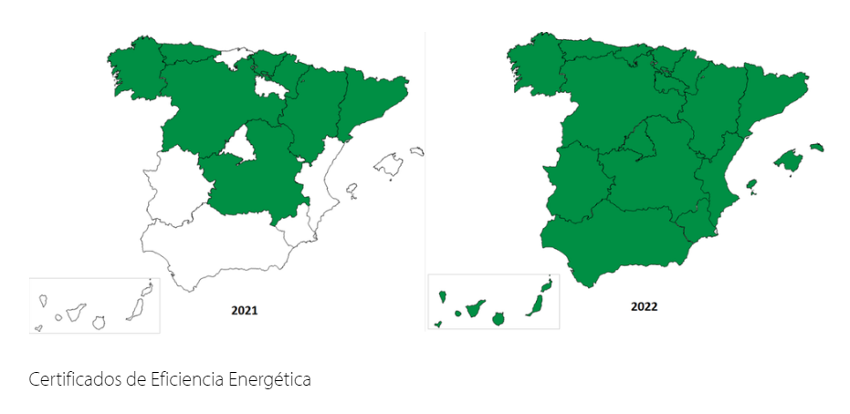
- Energy Efficiency Certificates
- Industrial Estates
- Agricultural Transformation Companie
As a result, the second edition of the top 3 is now accessible in seven autonomous communities. Moreover, the databases related to energy efficiency certificates, an increasingly required information at European level, are now openly available in all the autonomous communities of the Spanish geography.
Next steps: extending the commitment to open data
As it could not be otherwise, one of ASEDIE's main annual objectives is to continue promoting regional collaboration in order to complete the opening of the second edition of the top 3 in the rest of the autonomous communities. In parallel, the next edition of the ASEDIE Report will be made public on March 22, taking advantage of the Open Administration Week. As on other occasions, this document will serve to take stock of the milestones achieved in the previous year, as well as to list the new challenges.
In fact, in relation to open data, the ASEDIE report is a very useful tool when it comes to broadening knowledge in this area of expertise, as it includes a list of successful cases of infomediary companies and examples of the products and services they produce.
In short, thanks to initiatives such as those developed by ASEDIE, public-private collaboration is becoming more and more constant and tangible, making it easier for companies to reuse public information.
Blog
16.5 billion euros. These are the revenues that artificial intelligence (AI) and data are expected to generate in Spanish industry by 2025, according to what was announced last February at the IndesIA forum, the association for the application of artificial intelligence in industry. AI is already part of our daily lives: either by making our work easier by performing routine and repetitive tasks, or by complementing human capabilities in various fields through machine learning models that facilitate, for example, image recognition, machine translation or the prediction of medical diagnoses. All of these activities help us to improve the efficiency of businesses and services, driving more accurate decision-making.
But for machine learning models to work properly, they need quality and well-documented data. Every machine learning model is trained and evaluated with data. The characteristics of these datasets condition the behaviour of the model. For example, if the training data reflects unwanted social biases, these are likely to be incorporated into the model as well, which can have serious consequences when used in high-profile areas such as criminal justice, recruitment or credit lending. Moreover, if we do not know the context of the data, our model may not work properly, as its construction process has not taken into account the intrinsic characteristics of the data on which it is based.
For these and other reasons, the World Economic Forum suggests that all entities should document the provenance, creation and use of machine learning datasets in order to avoid erroneous or discriminatory results..
What are datasheets for datasets?
One mechanism for documenting this information is known as Datasheets for datasets. This framework proposes that every dataset should be accompanied by a datasheet, which consists of a questionnaire that guides data documentation and reflection throughout the data lifecycle. Some of the benefits are:
- It improves collaboration, transparency and accountability within the machine learning community.
- Mitigates unwanted social biases in models.
- Helps researchers and developers select the most appropriate datasets to achieve their specific goals.
- Facilitates greater reproducibility of results.
Datasheets will vary depending on factors such as knowledge area, existing organisational infrastructure or workflows.
To assist in the creation of datasheets, a questionnaire has been designed with a series of questions, according to the stages of the data lifecycle:
- Motivation. Collects the reasons that led to the creation of the datasets. It also asks who created or funded the datasets.
- Composition. Provides users with the necessary information on the suitability of the dataset for their purposes. It includes, among other questions, which units of observation represent the dataset (documents, photos, persons, countries), what kind of information each unit provides or whether there are errors, sources of noise or redundancies in the dataset. Reflect on data that refer to individuals to avoid possible social biases or privacy violations.
- Collection process. It is intended to help researchers and users think about how to create alternative datasets with similar characteristics. It details, for example, how the data were acquired, who was involved in the collection process, or what the ethical review process was like. It deals especially with the ethical aspects of processing data protected by the GDPR.
- Preprocessing, cleansing or tagging. These questions allow data users to determine whether data have been processed in ways that are compatible with their intended uses. Inquire whether any preprocessing, cleansing or tagging of the data was performed, or whether the software that was used to preprocess, cleanse and tag the data is available.
- Uses. This section provides information on those tasks for which the data may or may not be used. For this, questions such as: Has the dataset already been used for any task? What other tasks can it be used for? Does the composition of the dataset or the way it was collected, preprocessed, cleaned and labelled affect other future uses?
- Distribution. This covers how the dataset will be disseminated. Questions focus on whether the data will be distributed to third parties and, if so, how, when, what are the restrictions on use and under what licences.
- Maintenance. The questionnaire ends with questions aimed at planning the maintenance of the data and communicating the plan to the users of the data. For example, answers are given to whether the dataset will be updated or who will provide support.
It is recommended that all questions are considered prior to data collection, so that data creators can be aware of potential problems. To illustrate how each of these questions could be answered in practice, the model developers have produced an appendix with an example for a given dataset.
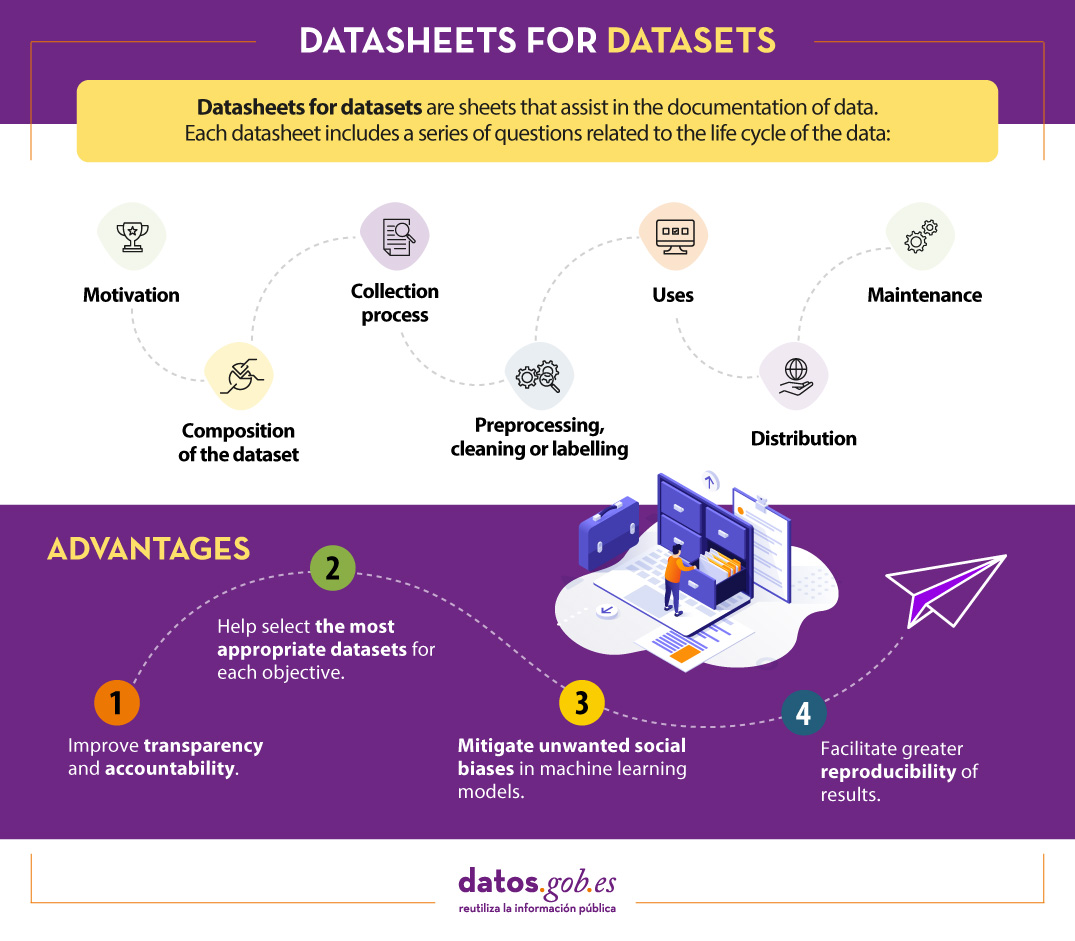
Is Datasheets for datasets effective?
The Datasheets for datasets data documentation framework has initially received good reviews, but its implementation continues to face challenges, especially when working with dynamic data.
To find out whether the framework effectively addresses the documentation needs of data creators and users, in June 2022, Microsoft USA and the University of Michigan conducted a study on its implementation. To do so, they conducted a series of interviews and a follow-up on the implementation of the questionnaire by a number of machine learning professionals.
In summary, participants expressed the need for documentation frameworks to be adaptable to different contexts, to be integrated into existing tools and workflows, and to be as automated as possible, partly due to the length of the questions. However, they also highlighted its advantages, such as reducing the risk of information loss, promoting collaboration between all those involved in the data lifecycle, facilitating data discovery and fostering critical thinking, among others.
In short, this is a good starting point, but it will have to evolve, especially to adapt to the needs of dynamic data and documentation flows applied in different contexts.
Content prepared by the datos.gob.es team.