Description
In the public sector ecosystem, subsidies represent one of the most important mechanisms for promoting projects, companies and activities of general interest. However, understanding how these funds are distributed, which agencies call for the largest grants or how the budget varies according to the region or beneficiaries is not trivial when working with hundreds of thousands of records.
In this line, we present a new practical exercise in the series "Step-by-step data exercises", in which we will learn how to explore and model open data using Apache Spark, one of the most widespread platforms for distributed processing and large-scale machine learning.
In this laboratory we will work with real data from the National System of Advertising of Subsidies and Public Aid (BDNS) and we will build a model capable of predicting the budget range of new calls based on their main characteristics.
All the code used is available in the corresponding GitHub repository so that you can run it, understand it, and adapt it to your own projects.
Access the datalab repository on GitHub
Run the data pre-processing code on Google Colab
Context: why analyze public subsidies?
The BDNS collects detailed information on hundreds of thousands of calls published by different Spanish administrations: from ministries and regional ministries to provincial councils and city councils. This dataset is an extraordinarily valuable source for:
- analyse the evolution of public spending,
- understand which organisms are most active in certain areas,
- identify patterns in the types of beneficiaries,
- and to study the budget distribution according to sector or territory.
In our case, we will use the dataset to address a very specific question, but of great practical interest:
Can we predict the budget range of a call based on its administrative characteristics?
This capability would facilitate initial classification, decision-making support or comparative analysis within a public administration.
Objective of the exercise
The objective of the laboratory is twofold:
- Learn how to use Spark in a practical way:
- Upload a real high-volume dataset
- Perform transformations and cleaning
- Manipulate categorical and numeric columns
- Structuring a machine learning pipeline
- Building a predictive model
We will train a classifier capable of estimating whether a call belongs to one of these ranges of low budget (up to €20k), medium (between €20 and €150k) or high (greater than €150k), based on variables such as:
- Granting body
- Autonomous community
- Type of beneficiary
- Year of publication
- Administrative descriptions
Resources used
To complete this exercise we use:
Analytical tools
- Python, the main language of the project
- Google Colab, to run Spark and create Notebooks in a simple way
- PySpark, for data processing in the cleaning and modeling stages
- Pandas, for small auxiliary operations
- Plotly, for some interactive visualizations
Data
Official dataset of the National System of Advertising of Subsidies (BDNS), downloaded from the subsidy portal of the Ministry of Finance.
The data used in this exercise were downloaded on August 28, 2025. The reuse of data from the National System for the Publicity of Subsidies and Public Aid is subject to the legal conditions set out in https://www.infosubvenciones.es/bdnstrans/GE/es/avisolegal.
Development of the exercise
The project is divided into several phases, following the natural flow of a real Data Science case.
5.1. Data Dump and Transformation
In this first section we are going to automatically download the subsidy dataset from the API of the portal of the National System of Publicity of Subsidies (BDNS). We will then transform the data into an optimized format such as Parquet (columnar data format) to facilitate its exploration and analysis.
In this process we will use some complex concepts, such as:
- Asynchronous functions: allows two or more independent operations to be processed in parallel, which makes it easier to make the process more efficient.
- Rotary writer: when a limit on the amount of information is exceeded, the file being processed is closed and a new one is opened with an auto-incremental index (after the previous one). This avoids processing files that are too large and improves efficiency.
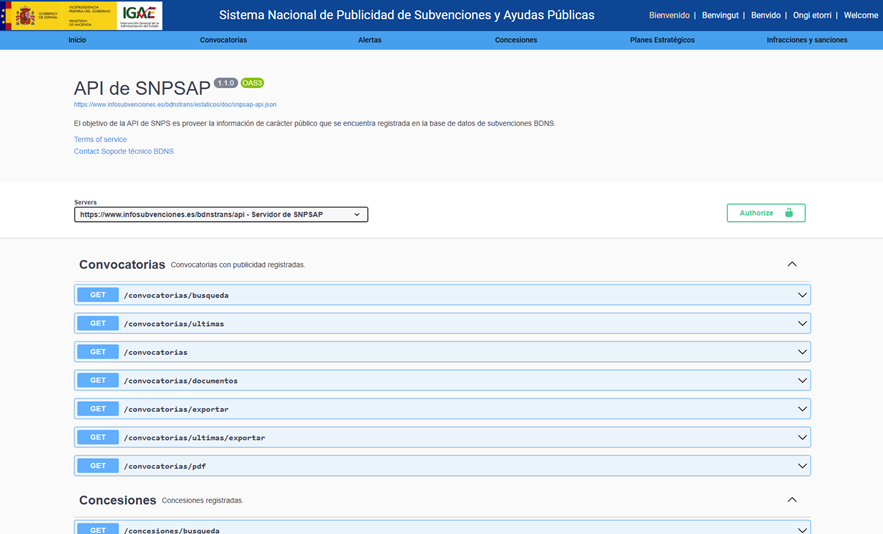
Figure 1. Screenshot of the API of the National System for Advertising Subsidies and Public Aid
5.2. Exploratory analysis
The aim of this phase is to get a first idea of the characteristics of the data and its quality.
We will analyze, among others, aspects such as:
- Which types of subsidies have the highest number of calls.
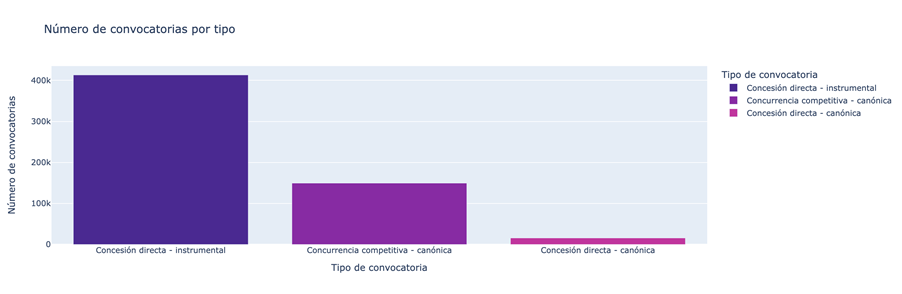
Figure 2. Types of grants with the highest number of calls for applications.
- What is the distribution of subsidies according to their purpose (i.e. Culture, Education, Promotion of employment...).
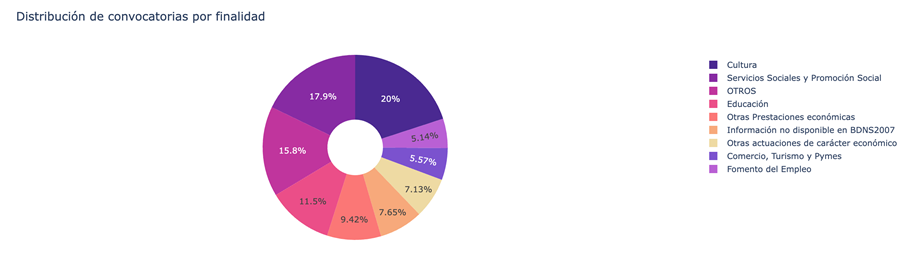
Figure 3. Distribution of grants according to their purpose.
- Which purposes add a greater budget volume.
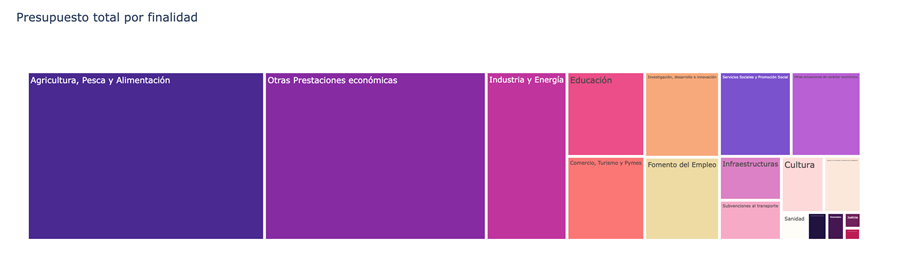
Figure 4. Purposes with the largest budgetary volume.
5.3. Modelling: construction of the budget classifier
At this point, we enter the most analytical part of the exercise: teaching a machine to predict whether a new call will have a low, medium or high budget based on its administrative characteristics. To achieve this, we designed a complete machine learning pipeline in Spark that allows us to transform the data, train the model, and evaluate it in a uniform and reproducible way.
First, we prepare all the variables – many of them categorical, such as the convening body – so that the model can interpret them. We then combine all that information into a single vector that serves as the starting point for the learning phase.
With that foundation built, we train a classification model that learns to distinguish subtle patterns in the data: which agencies tend to publish larger calls or how specific administrative elements influence the size of a grant.
Once trained, we analyze their performance from different angles. We evaluate their ability to correctly classify the three budget ranges and analyze their behavior using metrics such as accuracy or the confusion matrix.
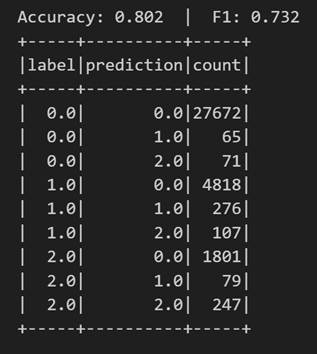
Figure 5. Accuracy metrics.
But we do not stop there: we also study which variables have had the greatest weight in the decisions of the model, which allows us to understand which factors seem most decisive when it comes to anticipating the budget of a call.
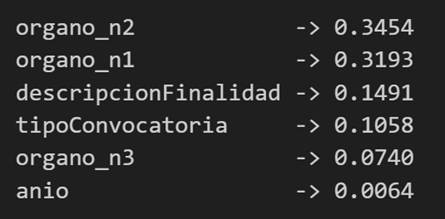
Figure 6. Variables that have had the greatest weight in the model's decisions.
Conclusions of the exercise
This laboratory will allow us to see how Spark simplifies the processing and modelling of high-volume data, especially useful in environments where administrations generate thousands of records per year, and to better understand the subsidy system after analysing some key aspects of the organisation of these calls.
Do you want to do the exercise?
If you're interested in learning more about using Spark and advanced public data analysis, you can access the repository and run the full Notebook step-by-step.
Content created by Juan Benavente, senior industrial engineer and expert in technologies related to the data economy. The content and views expressed in this publication are the sole responsibility of the author.


Comments