Blog
The European High-Value Datasets (HVD) regulation, established by Implementing Regulation (EU) 2023/138, consolidates the role of APIs as an essential infrastructure for the reuse of public information, making their availability a legal obligation and not just a good technological practice.
Since 9 June 2024, public bodies in all Member States are required to publish datasets classified as HVDs free of charge, in machine-readable formats and accessible via APIs. The six categories regulated are: geospatial data, Earth observation, environment, statistics, business information and mobility.
This framework is not merely declarative. Member States must report to the European Commission compliance status every two years, including persistent links to APIs that give access to such data. The situation in Spain in terms of transparency, open data and Systematic API Provisioning can be consulted in the indicators published by the Open Data Maturity Report.
In practice, this means that APIs are the bridge between the norm and reality. The regulation not only says what data must be opened, but also requires it to be done in such a way that it can be automatically integrated into applications, studies or digital services. Therefore, reviewing the public APIs available in Spain is a concrete way to understand how this framework is being applied on a day-to-day basis.
Inventory of public APIs in Spain
INE — API JSON (Tempus3)
The National Institute of Statistics offers a API REST that Exposes the entire database Tempus3 broadcast format JSON, which includes official statistical series on demography, economy, labour market, industry, services, prices, living conditions and other socio-economic indicators.
To make calls, the structure must follow the pattern https://servicios.ine.es/wstempus/js/{language}/{function}/{input}. The tip=AM parameter allows you to get metadata along with the data, and tv filters by specific variables. For example, to obtain the population figures by province, simply consult the corresponding operation (IOE 30243) and filter by the desired geographical variable.
No authentication or API key required: any well-formed GET request returns data directly.
Example in Python — get the resident population series with metadata:
import requests

url = ("https://servicios.ine.es/wstempus/js/ES/"

       "DATOS_TABLA/t20/e245/p08/l0/01002.px?tip=AM")

response = requests.get(url)

data = response.json()

for serie in data[:3]:  # primeras 3 series

    name = series["Name"]

    last = series["Date"][-1]

    print(f"{name}: {last['Value']:,.0f} ({last['PeriodName']})")

    TOTAL AGES, TOTAL, Both sexes: 39,852,651 (1998)

    TOTAL AGES, TOTAL, Males: 19,488,465 (1998)

    TOTAL EDADES, TOTAL, Mujeres: 20,364,186 (1998)
AEMET — OpenData API REST
The State Meteorological Agency exposes its data through a REST API, documented with Swagger UI (an open-source tool that generates interactive documentation), observed meteorological data and official predictions, including temperature, precipitation, wind, alerts and adverse phenomena.
Unlike the INE, AEMET requires a Free API key, which is obtained by providing an email address in the portal opendata.aemet.es. A API key works as A type of "password" or identifier: it is used to allow the agency to know who is using the service, control the volume of requests and ensure proper use of the infrastructure.
A relevant technical aspect is that AEMET implements a two-call model: the first request returns a JSON with a temporary URL in the data field, and a second request to that URL retrieves the actual dataset. The rate limit is 50 requests per minute.
Example in Python — daily weather data (double call):
import requests

API_KEY = "tu_api_key_aqui"

headers = {"api_key": API_KEY}

#1st call: Get temporary data URLs

url = ("https://opendata.aemet.es/opendata/api/"

        "Values/Climatological/Daily/Data/"

        "fechaini/2025-01-01T00:00:00UTC/"

       "fechafin/2025-01-10T23:59:59UTC/"

       "allseasons")

resp1 = requests.get(url, headers=headers).json()

#2nd call: Download the actual dataset

datos = requests.get(resp1["datos"], headers=headers).json()

for estacion in datos[:3]:

     print(f"{station['name']}: "

           f"Tmax={station.get('tmax','N/A')}°C, "

          f"Prec={estacion.get('prec','N/A')}mm")

CITFAGRO_88_GAITERO: Tmax=8.8°C, Prev=0.0mm

ABANILLA: Tmax=14,8°C, Prec=0,0mm

LA RODA DE ANDALUCÍA: Tmax=15.7°C, Prec=0.2mm
CNIG / IDEE — Servicios OGC y OGC API Features
The National Center for Geographic Information It publishes official geospatial data – base mapping, digital terrain models, river networks, administrative boundaries and other topographic elements – through interoperable services. These have evolved from WMS/WFS to the OGC API (Features, Maps and Processes), implemented with open software such as pygeoapi.
The main advantage of OGC API Features over WFS is the response format: instead of GML (heavy and complex), the data is served in GeoJSON and HTML, native formats of the web ecosystem. This allows them to be consumed directly from libraries such as Leaflet, OpenLayers or GDAL. Available datasets include Cartociudad addresses, hydrography, transport networks and geographical gazetteer.
Example in Python — query geographic features via OGC API:
import requests

# OGC API Features - Basic Geographical Gazetteer of Spain

base = "https://api-features.idee.es/collections"

collection = "falls" # Waterfalls

url = f"{base}/{collection}/items?limit=5&f=json"

resp = requests.get(url).json()

for feat in resp["features"]:

props = feat["properties"]

coords = feat["geometry"]["coordinates"]

print(f"{props['number']}: ({coords[0]:.4f}, {coords[1]:.4f})")

None: (-6.2132, 42.8982)

Cascada del Cervienzo: (-6.2572, 42.9763)

El Xaral Waterfall: (-6.3815, 42.9881)

Rexiu Waterfall: (-7.2256, 42.5743)

Santalla Waterfall: (-7.2543, 42.6510)
MITECO — Open Data Portal (CKAN)
The Ministry for the Ecological Transition maintains a CKAN-based portal that exposes three access layers: the CKAN Action API for metadata and dataset search, the Datastore API (OpenAPI) for live queries on tabular resources, and RDF/JSON-LD endpoints compliant with DCAT-AP and GeoDCAT-AP. In its catalogue you can find data on air quality, emissions and climate change, water (state of masses and hydrological planning), biodiversity and protected areas, waste, energy and environmental assessment.
Featured datasets include Natura 2000 Network protected areas, bodies of water, and greenhouse gas emissions projections.
Example in Python — search for datasets:
import requests

BASE = "https://catalogo.datosabiertos.miteco.gob.es/ catalog"

# Search for datasets containing 'natura 2000'

busqueda = requests.get(

    f"{BASE}/api/3/action/package_search",

params={"q": "natura 2000", "rows": 3},

).json()

for ds in busqueda["result"]["results"]:

print(f"{ds['title']} ({ds['num_resources']} resources)")

Protected Areas of the Natura 2000 Network (13 resources)

Database of Natura 2000 Network Protected Areas of Spain (CNTRYES) (1 resources)

Protected Areas of the Natura 2000 Network - API - High Value Data (1 resources)
Technical comparison
| Organisim | Protocol | Format | Authentication | Rate limit | HVD |
|---|---|---|---|---|---|
| INE | REST | JSON | None | Undeclared | Yes (statistic) |
| AEMET | REST | JSON | API key (free) | 50 reg/min | Yes (environment) |
| CNIG/IDEA | OGC API/WFS | GeoJSON/GML | None | Undeclared | Yes (geoespatial) |
| MITECO | CKAN/REST | JSON/RDF | None | Undeclared | Yes (environment) |
Figure 1. Comparative table of the APIs from various public agencies discussed in this post. Source: Compiled by the author – datos.gob.es.
The availability of public APIs isn't just a matter of technical convenience. From a data perspective, these interfaces enable three critical capabilities:
- Pipeline automation: the periodic ingestion of public data can be orchestrated with standard tools (Airflow, Prefect, cron) without manual intervention or file downloads.
- Reproducibility: API URLs act as static references to authoritative sources, facilitating auditing and traceability in analytics projects.
- Interoperability: the use of open standards (REST, OGC API, DCAT-AP) allows heterogeneous sources to be crossed without depending on proprietary formats.
The public API ecosystem in Spain has different levels of development depending on the body and the sectoral scope. While entities such as the INE and AEMET have consolidated and well-documented interfaces, in other cases access is articulated through CKAN portals or traditional OGC services. The regulation regarding High Value Datasets (HVDs) is driving the progressive adoption of REST standards, although the degree of implementation evolves at different rates. For data professionals, these APIs are already a fully operational source that is increasingly common to integrate into data architectures in engineering and analytical environments.ás habitual en entornos analíticos y de ingeniería.
Content produced by Juan Benavente, a senior industrial engineer and expert in technologies related to the data economy. The content and views expressed in this publication are the sole responsibility of the author.
Blog
The Open Data Maturity Report is an annual evaluation that since 2015 has analysed the development and evolution of open data initiatives in the European Union. Coordinated by the European Data Portal (data.europa.eu) and carried out in collaboration with the European Commission, this report assesses 36 participating countries: the 27 EU Member States, 3 European Free Trade Association countries (Iceland, Norway and Switzerland) and 6 candidate countries.
The report assesses four key dimensions:
- Policy (strategies and regulatory frameworks)
- Portal (functionalities and usability)
- Quality (metadata and data standards)
- Impact (reuse and benefits generated)
In the 2025 edition, Spain stood out with a score of 100% in the impact block compared to the European average of 82.1%. In general terms, it occupies the fifth position among the countries of the European Union with a total score of 95.6%, forming part of the group of countries that prescribe trends.
A differential aspect of this edition of the report is the incorporation of a descriptive and contextual approach that complements the traditional regulatory model, creating clusters of countries to allow fairer comparisons. These clusters group countries with similar economic, social, political, and digital characteristics, and are based on profiles that explain how open data policies are implemented, not just what results are obtained. The aim is to invite countries to look at their peers , learn from comparable experiences and promote more effective peer-to-peer learning than based solely on general rankings.
In addition to quantifying it, the report includes use cases and good practices carried out by countries to open and reuse public sector data. In this post, we highlight some of them that can serve as inspiration to continue improving our open data ecosystem.
Croatia's inclusive and coordinated governance
One of the most noteworthy aspects of the 2025 report is how some countries have managed to establish strong governance structures that ensure coordination between different levels of administration and multi-stakeholder participation.
Croatia stands out for having established in 2025 the Coordination for the Implementation of the Open Data Policy, a multisectoral body that monitors regulatory compliance, improves data accessibility, and supports authorities. This model ensures broad participation and ensures that national and local initiatives are aligned. The national portal functions as a central hub, complemented by local portals such as the one for the city of Zagreb. In addition, knowledge exchanges are encouraged through coordination meetings, regular updates and collaborations with universities, such as the Faculty of Electrical and Computer Engineering at the University of Zagreb.
France's complete data governance structure
This country leads the ranking of the Open Data Maturity Report thanks, among others, to its comprehensive governance model that integrates open data roles at all administrative levels. At the national level, the General Data Administrator coordinates public data policy and oversees a network of chief data officers in each ministry. Etalab, the national open data and digital innovation unit, manages this network and provides technical support.
At the ministerial level, each data controller manages the data policy (openness, quality and reuse), supported by Etalab. Some ministries also appoint specific open data officers and data stewards who handle technical and organizational aspects of the publication. At the local level, each regional representative (préfet) designates a referent for data, algorithms and source codes. The Digital Inter-Ministerial Directorate also coordinates a network of API managers to enable dynamic access to data. They also ensure compliance with DCAT-AP in their metadata, as we do in Spain.
Effective implementation: from strategy to action in Italy
Italian public administrations are obliged to adopt data publication plans, following national guidelines, which prioritise high-value datasets, dynamic data and user-requested information. The implementation is supported by a robust monitoring system. The Agency for Digital Italy (AgID) tracks progress through its Digital Transformation Dashboard, which reports the growth of datasets in dati.gov.it.
Policies are updated regularly: the latest three-year plan (2024-2026) was adopted in December 2024. To assist data holders and officials, AgID provides guidance, conducts webinars, and launched the AgID Academy to strengthen digital competencies.
Culture of reuse in Poland and Ukraine
A crucial aspect of encouraging open data is to provide practical resources to guide public organizations throughout the process. Poland stands out for its open data manual, the second edition of which was published by the Ministry of Digital Affairs.
This updated handbook introduces new categories of data, explains how regulations shape open data policies, and introduces the Poland Data Portal.
The handbook functions as a checklist for offices, guiding them through their responsibilities to open data and foster a culture of reuse and include tools such as an openness checklist for compliance.
In this regard, Ukraine has also adopted an approach towards reuse and the generation of resources that incentivise this reuse of data. The Ministry of Digital Transformation has developed a comprehensive set of resources and tools including detailed technical documentation and templates to help prepare and publish datasets aligned with national standards, covering metadata structuring, licensing, and compliance with the DCAT-AP standard.
The national portal includes functionalities for tracking the publication and reuse of datasets. Suppliers receive feedback on the quality and completeness of their metadata, helping them identify areas for improvement. In addition, regular training sessions and workshops are organized to develop the skills of publishers, promoting a shared understanding of open data principles and technical requirements.
Albania: comprehensive redesign of the portal
This country exemplifies the maturity improvements that can be achieved through a comprehensive update of the national open data portal. The large-scale revamp of the portal improved usability, transparency, and user engagement.
The updated portal now features a dataset rating system (1-5 stars), a dedicated news section on open data topics , and multiple notification options, including RSS and Atom feeds, and email. Users can track the progress of their data requests, which are actively monitored and responses summarized in publicly available reports.
To better understand and respond to user needs, the portal team tracks search keywords, analyzes traffic, and conducts user surveys and workshops.
Lithuania: official monitoring methodology
One of the key practices highlighted in the report is the adoption of formal frameworks and structured methodologies that provide a systematic way to assess the impact of open data. Lithuania excels with a comprehensive approach because it defines how institutions should report on open data activities, ensuring consistency, accountability, and compliance across the public sector.
In addition, the Ministry of Economy and Innovation made calculations to estimate the economic impact of open data. This analysis provides quantifiable evidence of the contribution of open data to innovation, productivity and job creation. The results show that open data in Lithuania creates a market value of approximately €566 billion (around 1.2% of GDP) and supports close to 8,000 value-added jobs.
Germany: systematic funding for collaboration
Germany's mFund initiative provides structured financial support for mobility-related data projects, fostering partnerships beyond government.
An example is the miki (mobil im Kiez) project, which develops navigation and orientation solutions for people with limited mobility through the active engagement of civil society. The team created a national prototype with visualizations for cities such as Cologne, Kassel, Munich, Potsdam and Saarbrücken, showing building barriers and road surfaces. These visualizations will be integrated into Wheelmap.org, helping individuals with mobility disabilities.
Conclusion
In conclusion, the Open Data Maturity Report 2025 demonstrates that the most open data mature European countries share common characteristics: inclusive and well-structured governance, effective implementation supported by planning and monitoring, practical support to data publishers, continuous technical innovation in portals and, crucially, systematic impact measurement.
The good practices highlighted here are transferable and adaptable. We invite Spanish public administrations to explore these experiences, adapt them to their local contexts and share their own innovations, thus contributing to an increasingly robust and impact-oriented European open data ecosystem.
Noticia
Public administrations and, specifically, local entities are at a crucial moment of digital transformation. The accelerated development of artificial intelligence (AI) poses both extraordinary opportunities and complex challenges that require structured, ethical, and informed adaptation. In this context, the Spanish Federation of Municipalities and Provinces (FEMP) has launched the Practical Guide and Policies for the Use of Artificial Intelligence in Local Entities, a reference document that aspires to function as a compass for city councils, provincial councils and other local entities on their way to the responsible adoption of this technology that is advancing by leaps and bounds.
The guide is based on a key idea: AI is not just a technological issue, but also an organisational, legal, ethical and cultural one. Its implementation requires planning, governance and a strategic vision adapted to the size and digital maturity of each local authority. In this post, we will look at some of the key points in the document.
In this video you can watch the presentation session of the Guide again.
The guide is based on a key idea: AI is not only a technological issue, but also an organizational, legal, ethical and cultural one. Its implementation requires planning, governance and a strategic vision adapted to the size and digital maturity of each local entity. In this post, we will look at some relevant keys to the document.
Why an AI guide for local authorities
Local administrations have been pursuing continuous improvement of public services for years, but have often been constrained by a lack of technological resources, organizational rigidity, or data fragmentation. AI opens up an unprecedented opportunity to overcome many of these barriers, because it makes it possible to:
- Automate processes.
- Analyze large volumes of information.
- Anticipate citizen needs.
- Personalize public attention.
However, along with these opportunities come obvious risks: loss of transparency, discriminatory biases, violations of privacy or uncritical automation of decisions that affect fundamental rights. Hence the need for a guide that helps to know what can be done with AI, what should not be done and how to do it with guarantees.
48% of public administrations use Artificial Intelligence to streamline the relationship with citizens
The guide is structured around several fundamental axes that address the multiple dimensions of AI implementation at the local level:
The legal framework: the European AI Regulation as a central axis
One of the pillars of the guide is the analysis of the European Artificial Intelligence Regulation (RIA), the first comprehensive standard worldwide that regulates AI with a risk-based approach, and which fully affects local entities whether they develop, use or contract AI systems.
Specifically, the different levels of risk recognized by the RIA are:
- Unacceptable risk: includes prohibited practices such as social punctuation, subliminal manipulation or certain uses of biometrics.
- High risk: covers systems used in sensitive areas such as the management of public services, employment, education, security or administrative decision-making. These systems must meet a number of strict requirements, such as the need for human supervision or data traceability.
- Specific transparency risk: This applies to chatbots or AI-generated content and is mainly imposed on them reporting obligations (e.g. labelling content as AI-generated).
- Minimal risk: such as spam filters or AI-based video games, with no obligations, although adopting codes of conduct is recommended.
Crucially, from February 2025, local authorities must make their staff AI literate, i.e. provide training for those who operate these systems to understand their technical, legal and ethical implications. In addition, they must review whether any of their systems incur in practices prohibited by the RIA, such as subliminal manipulation or social scoring .
For local authorities, this implies the need to identify which AI systems they use, assess their level of risk and comply with the corresponding obligations.
AI, administrative procedure and data protection
The guide recalls that automating a process does not necessarily equate to using AI, but that when systems capable of inferring, recommending or deciding are incorporated, the legal impact is much greater.
The incorporation of AI in administrative procedures must respect principles such as:
- Transparency and explainability of decisions.
- Identification of the responsible body.
- Possibility of challenge.
- Effective human supervision.
In addition, the use of AI must be fully compliant with the General Data Protection Regulation (GDPR). Local authorities should be able to justify automated decisions, guarantee the rights of affected individuals and exercise extreme caution when processing sensitive personal data.
Governing Data to Govern AI
The guide is blunt on one point: AI cannot be implemented without strong data governance. AI is powered by data, and its quality, availability, and ethical management will determine the success or failure of any initiative. The document introduces the concept of "single data" and refers to unified information. In relation to this, it has been seen that many organizations discover structural deficiencies precisely when trying to implement AI, an idea that was addressed in the datos.gob.es podcast on data and AI.
For data governance in AI in the local context, the guide defines the importance of:
- Privacy by design.
- Strategic value of data.
- Institutional ethical responsibility.
- Traceability.
- Shared knowledge and quality management.
In addition, the adoption of recognized international frameworks such as DAMA-DMBOOK is recommended.
The guide also insists on the importance of the quality, availability and correct management of data to "guarantee an effective and responsible use of artificial intelligence in our local administrations". To do this, it is essential to:
• Adopt interoperability standards, such as those already existing at national and European level.
• Use APIs and secure data exchange systems, which allow information to be shared efficiently between different public bodies.
• Leverage open data sources, such as those provided by the Spanish Government's Open Data Portal or local public data platforms.
How to know the maturity status in AI
Another of the most innovative aspects of the guide is the FEMP methodology. AI, which allows local entities to self-assess their level of organizational maturity for AI deployment. This methodology distinguishes three progressive levels that should be adopted in order:
- Level 1 - Electronic Administration (EA): digitalisation of business areas through corporate solutions based on single data.
- Level 2 - Robotization of Automated Processes (RPA): automation of management processes and administrative actions.
- Level 3 - Artificial Intelligence: use of specialized analysis tools that provide information obtained automatically.
This gradual approach is essential, as it recognizes that not all entities start from the same point and that trying to skip stages can be counterproductive.
The guide stresses that AI should be seen as a support tool, not as a substitute for human judgment, especially in sensitive decisions.
Requirements for deploying AI in a local entity
The document systematically details the requirements necessary to implement AI with guarantees:
- Normative and ethical, ensuring legal compliance and respect for fundamental rights.
- Organizational, defining technical, legal, and governance roles.
- Technological, including infrastructure, integration with existing systems, scalability, and cybersecurity.
- Strategic, betting on progressive deployments, pilots and continuous evaluation.
Beyond technology, the guide underlines the importance of ethics, transparency and public trust. All this is key and points to the idea that success does not lie in advancing quickly, but in advancing well: with a solid foundation, avoiding improvisations and ensuring that AI is applied ethically, effectively and oriented to the general interest.
Likewise, the relevance of public-private collaboration and the exchange of experiences between local entities is highlighted, as a way to reduce risks, share knowledge and optimize resources.
Real cases and conclusions
The document is completed with numerous real use cases in city councils and provincial councils, which demonstrate that AI is already a tangible reality in areas such as citizen service, social management, urban planning licenses or municipal chatbots.
In conclusion, the FEMP guide is presented as an essential manual for any local entity that wants to address AI responsibly. Its main contribution is not only to explain what AI is, but to offer a practical framework to implement it in a meaningful way, always putting citizenship, fundamental rights and good governance at the centre.
Noticia
The recent Meeting Forum between the Government of Spain and the Autonomous Communities has marked a turning point in how public administrations approach digital transformation. For the first time, the debate has not focused on convincing about the importance of data or the need to modernize processes, but on executing a coherent strategy that allows the deployment of AI to take advantage of its full potential. All this highlighting the importance of having a solid database of well-governed data that is useful for citizens.
The conclusions of the meeting, articulated in specialized working groups, outline a roadmap that confirms the maturity reached. Far from focusing solely on technological aspects, the forum has focused on where the challenge really lies: on the cultural, organisational and governance obstacles that will determine the success or failure of this transformation in the coming years. The debate took place in three working tables:
-
Table 1: Unlocking the data, from the Standard to the Practice
-
Table 2: Orchestration of Data, Symphony or Cacophony of Roles?
-
Table 3: Sectoral Data Spaces, the Public Boost to Market Value
In this post we tell you the main conclusions.
Data as a strategic asset: from theory to practice
The starting point of the first table of the forum was to understand that the main challenge to turn data into a strategic asset is no longer technological. Administrations today have robust, stable and capable solutions. The real obstacle is cultural: overcoming the vision of data as a burden and consolidating it as an engine of innovation and public service.
Breaking this inertia, according to the participants in the forum, requires decisive leadership capable of aligning regulatory framework and technological capabilities. And, in this change, artificial intelligence is emerging as the catalyst because it highlights the hidden value of data and, above all, because it cannot function without overcoming the traditional administrative silos that still fragment public information.
One of the most repeated messages at this table was the still widespread fear of sharing information between organizations. The fear of taking responsibility creates barriers that limit the potential of public data. To reverse this situation, the need to combine clear mandates with strong incentives was underlined. It is not enough to order; you have to convince by showing real profits. Attractive and mutually beneficial use cases are thus revealed as a fundamental tool to foster collaboration.
In relation to this, legal certainty also occupied a large part of the debate. Although it is often used as a reason to stop projects, participants stressed that it should not become an excuse for paralysis. The way forward is to clarify, simplify and harmonise the rules, evolving from an excessively legalistic approach to a model based on trust and the social value generated by the responsible use of data.
In addition, the key role of public-private collaboration was highlighted. Companies don't just bring technology, they can also accelerate innovation if they feel part of a stable and trusted ecosystem. To this end, administrations can offer guarantees of sovereignty and utility, and, in the event of a lack of reciprocity, resort to public procurement regulation to ensure participation.
Coordinating roles so that the orchestra does not go out of tune
On the other hand, the second table addressed one of the great challenges of the Public Administration: coordinating the multiple profiles necessary to manage, protect and exploit data in a context that is increasingly oriented towards AI. Nowadays, any administration can hire the same cloud platforms or analysis tools. Technology has been democratized. What really sets one organization apart from another is the richness, quality, and governance of its data.
Therefore, for the organization to function as a fine-tuned orchestra, the synchronization of roles is essential. In this sense, the table underlined the need for superior strategic leadership from the figure of the CDO (Chief Data Officer) capable of establishing business priorities and coordinating the team. Its legitimacy must come from the highest levels of the organization, because without this support it is difficult to promote the required organizational and cultural changes. The CDO is not a merely technical role because, in addition, it plays a key role in guiding data governance from the perspective of usefulness and impact.
The roles traditionally associated with regulatory compliance must also evolve. The Data Protection Officer (DPO) must become a strategic partner, co-responsible for risk and an active participant in decision-making. Only in this way will it be able to accompany the deployment of innovative projects based on data.
One of the most relevant consensuses was the central role of data quality. Although it is often perceived as a barrier that slows down innovation, the reality is just the opposite: quality is a non-negotiable requirement for developing ethical, robust and valid algorithms. AI cannot be built on opaque, inconsistent, or untraceable data without putting public trust at risk.
In addition, the value provided by historically consolidated disciplines within the Administration, such as statistics, cartography or open data, was highlighted. Far from being an anchor that slows down modernization, these specialties are a driver: their integration from the origin of the processes ensures that AI systems are fed with verified, traceable and top-quality data.
In conclusion, the table proposed moving towards multidisciplinary teams where engineers, business experts and legal managers work together throughout the data life cycle, avoiding the traditional compartmentalizations that weigh down digital projects so much.
Sectoral Data Spaces: from public impetus to the real market
The third table focused its analysis on a key element for the European data economy: the Sectoral Data Spaces. The Spanish public administrations showed a firm commitment to these developments, betting on a role of promoters, facilitators and guarantors of trust.
The message was direct: these spaces must evolve towards sustainable business models. Public subsidies can serve as an initial impetus, but they cannot sustain projects that do not generate real value for the market. Demand, and not just the supply of funding, must validate the viability of these initiatives in the medium term.
One of the challenges identified is the scaling up of projects that are born in regional areas to national dimensions. To achieve a significant impact, a shared vision and close collaboration between Autonomous Communities (ACs) is essential, something that the Forum has reinforced precisely with this type of meeting. One of the key objectives of the Artificial Intelligence Strategy 2024 and the recent Data Union Strategy is for SMEs to be actively involved. To do this, you need to simplify technical barriers and communicate the value proposition clearly, in a business-oriented language rather than a technicality.
Finally, an optimistic message was delivered about talent. Although there is concern about the ability of the public sector to attract and retain specialized profiles in competition with the private sector, the table rejected the idea of resignation. The Administration is not condemned to a secondary role if it is able to strengthen and enhance its internal talent. Digital transformation requires leadership from the public sphere, and this leadership is possible with the right structures, opportunities for growth, and a shared vision.
Conclusion: a qualitative leap towards maturity
The 2025 Autonomous Communities Forum has served to consolidate a collective and mature vision of the role of data in the Administration. Overcoming silos, coordinating roles, simplifying standards, guaranteeing data quality and generating sustainable business models are essential steps for AI and the data economy to generate real value for citizens.
Spain is moving towards a model in which administrations stop focusing on the tool, to focus on utility; A model where collaboration – between agencies, with the private sector and between territories – is the key to unlocking the true potential of public data.
Noticia
From today, September 15, registration is open for one of the most important events in the geospatial sector in the Iberian Peninsula. The XVI Iberian Conference on Spatial Data Infrastructures (JIIDE 2025) will be held in Oviedo from 12 to 14 November 2025. This annual meeting represents a unique opportunity to explore the latest trends in spatial data reuse, especially in the context of the application of artificial intelligence to territorial knowledge.
Since its first edition in 2011, the JIIDEs have evolved as a result of collaboration between the Direção-Geral do Território de Portugal, the National Geographic Institute of Spain through the National Center for Geographic Information, and the Government of Andorra. In this sixteenth edition, the Ministry of Territorial Planning, Urban Planning, Housing and Citizens' Rights of the Principality of Asturias and the University of Oviedo also join, thus consolidating an initiative that brings together hundreds of professionals from the Public Administration, the private sector and the academic field every year.
For three days, experts with proven experience and technical knowledge in geographic information will share their most innovative developments, work methodologies and success stories in the management and reuse of spatial data.
Two axes: artificial intelligence and the INSPIRE and HVDS regulatory framework
The central theme of this edition, "AI and territory: exploring the new frontiers of spatial knowledge", reflects the natural evolution of the sector towards the incorporation of emerging technologies. Artificial intelligence, machine learning, and advanced analytics algorithms are radically transforming the way we process, analyze, and extract value from geospatial data.
This orientation towards AI is not accidental. The publication and use of geospatial data makes it possible to harness one of the most valuable digital assets for economic development, environmental monitoring, competitiveness, innovation and job creation. When this data is combined with artificial intelligence techniques, its potential multiplies exponentially.
The conference takes place at a particularly relevant time for the open data ecosystem. The INSPIRE Directive, together with Directive (EU) 2019/1024 on open data and re-use of public sector information, has established a regulatory framework that explicitly recognises the economic and social value of digital geospatial data.
The evolution in the publication of high-value datasets marks an important milestone in this process. These sets, characterized by their great potential for reuse, should be available free of charge, in machine-readable formats and through application programming interfaces (APIs). Geospatial data occupies a central position in this categorisation, underlining its strategic importance for the European open data ecosystem.
JIIDE 2025 will devote particular attention to presenting practical examples of re-use of these high-value datasets , both through the new OGC APIs and through traditional download services and established interoperable formats. This practical approach will allow attendees to learn about real cases of implementation and their tangible results.
Miscellaneous Program: Use Cases, AI, and Geospatial Data Reuse
You can also check the program here. Among the planned activities, there are sessions ranging from fundamental technical aspects to innovative applications that demonstrate the transformative potential of this data. The activities are organized into five main themes:
Spatial data structure and metadata.
Data management and publication.
Development of spatial software.
Artificial intelligence.
Cooperation between agents.
Some of the highlighted topics are project management and coordination, where corporate systems such as the SIG of the Junta de Andalucía or the SITNA of the Government of Navarra will be presented. Earth observation will also feature prominently, with presentations on the evolution of the National Plan for Aerial Orthophotography (APNOA) programme and advanced deep learning image processing techniques.
On the other hand, thematic visualisers also represent another fundamental axis, showing how spatial data can be transformed into accessible tools for citizens. From eclipse visualizers to tools for calculating the solar potential of rooftops, developments will be presented that demonstrate how the creative reuse of data can generate services of high social value.
Following the annual theme, the application of AI to geospatial data will be approached from multiple perspectives. Use cases will be presented in areas as diverse as the automatic detection of sports facilities, the classification of LiDAR point clouds, the identification of hazardous materials such as asbestos, or the optimization of urban mobility.
One of the most relevant sessions for the open data community will focus specifically on "Reuse and Open Government". This session will address the integration of spatial data infrastructures into open data portals, spatial data metadata according to the GeoDCAT-AP standard, and the application of data quality regulations.
Local governments play a key role in the generation and publication of spatial data. For this reason, the JIIDE 2025 will dedicate a specific session to the publication of local data, where municipalities such as Barcelona, Madrid, Bilbao or Cáceres will share their experiences and developments.
In addition to the theoretical sessions, the conferences include practical workshops on specific tools, methodologies and technologies. These workshops, lasting 45 minutes to an hour, allow attendees to experiment directly with the solutions presented. Some of them address the creation of custom web geoportals and others, for example, the implementation of OGC APIs, through advanced visualization techniques and metadata management tools.
Participate in person or online
The JIIDEs maintain their commitment to open participation, inviting both researchers and professionals to present their tools, technical solutions, work methodologies and success stories. In addition, the JIIDE 2025 will be held in hybrid mode, allowing both face-to-face participation in Oviedo and virtual monitoring.
This flexibility, maintained from the experiences of recent years, ensures that professionals throughout the Iberian territory and beyond can benefit from shared knowledge. Participation remains free, although prior registration is required for each session, roundtable or workshop.
Starting today, you can sign up and take advantage of this opportunity to learn and exchange experiences on geospatial data. Registration is available on the official website of the event: https://www.jiide.org/web/portal/inicio
Blog
Imagine you want to know how many terraces there are in your neighbourhood, how the pollen levels in the air you breathe every day are evolving or whether recycling in your city is working well. All this information exists in your municipality's databases, but it sits in spreadsheets and technical documents that only experts know how to interpret.
This is where open data visualisation initiativescome in: they transform those seemingly cold numbers into stories that anyone can understand at a glance. A colourful graph showing the evolution of traffic on your street, an interactive map showing the green areas of your city, or an infographic explaining how the municipal budget is spent. These tools make public information accessible, useful and, moreover, comprehensible to all citizens.
Moreover, the advantages of this type of solution are not only for the citizens, but also benefit the Administration that carries out the exercise, because it allows:
- Detect and correct data errors.
- Add new sets to the portal.
- Reduce the number of questions from citizens.
- Generate more trust on the part of society.
Therefore, visualising open data brings government closer to citizens, facilitates informed decision-making, helps public administrations to improve their open data offer and creates a more participatory society where we can all better understand how the public sector works. In this post, we present some examples of open data visualisation initiatives in regional and municipal open data portals.
Visualiza Madrid: bringing data closer to the public
Madrid City Council's open data portal has developed the initiative "Visualiza Madrid", a project born with the specific objective of making open data and its potential reach the general public , transcending specialised technical profiles. As Ascensión Hidalgo Bellota, Deputy Director General for Transparency of Madrid City Council, explained during the IV National Meeting on Open Data, "this initiative responds to the need to democratise access to public information".
Visualiza Madrid currently has 29 visualisations that cover different topics of interest to citizens, from information on hotel and restaurant terraces to waste management and urban traffic analysis. This thematic diversity demonstrates the versatility of visualisations as a tool for communicating information from very diverse sectors of public administration.
In addition, the initiative has received external recognition this year through the Audaz 2,025 Awards, an initiative of the Spanish chapter of the Open Government Academic Network (RAGA Spain).The initiative has also received external recognition through the Audaz 2,025 Awards.
Castilla y León: comprehensive analysis of regional data
The Junta de Castilla y León has also developed a portal specialised in analysis and visualisations that stands out for its comprehensive approach to the presentation of regional data. Its visualisation platform offers a systematic approach to the analysis of regional information, allowing users to explore different dimensions of the reality of Castilla y Leónthrough interactive and dynamic tools.
This initiative allows complex information to be presented in a structured and understandable way, facilitating both academic analysis and citizen use of the data. The platform integrates different sources of regional information, creating a coherent ecosystem of visualisations that provides a panoramic view of different aspects of regional management. Among the topics it offers are data on tourism, the labour market and budget execution. All the visualisations are made with open data sets from the regional portal of Castilla y León .
The Castilla y León approach demonstrates how visualisations can serve as a tool for territorial analysis, providing valuable insights on economic, social and demographic dynamics that are fundamental for the planning and evaluation of regional public policies.
Canary Islands: technological integration with interactive widgets .
On the other hand, the Government of the Canary Islands has opted for an innovative strategy through the implementation of widgets that allow the integration of open data visualisations of the Instituto Canario de Estadística (ISTAC) in different platforms and contexts. This technological approach represents a qualitative leap in the distribution and reuse of public data visualisations.
The widgets developed by the Canary Islands make it easier for third parties to embed official visualisations in their own applications, websites or analyses, exponentially expanding the scope and usefulness of Canary Islands open data. This strategy not only multiplies the points of access to public information, but also fosters the creation of a collaborative ecosystem where different actors can benefit from and contribute to the value of open data.
The Canarian initiative illustrates how technology can be used to create scalable and flexible solutions that maximise the impact of investments in open data visualisation, establishing a replicable model for other administrations seeking to amplify the reach of their transparency initiatives.
Lessons learned and best practices
By way of example, the cases analysed reveal common patterns that can serve as a guide for future initiatives. The orientation towards the general public, beyond specialised technical users, emerges as an opportunity factor for the success of these platforms. To maintain the interest and relevance of the visualisations, it is important to offer thematic diversity and to update the data regularly.
Technological integration and interoperability, as demonstrated in the case of the Canary Islands, open up new possibilities to maximise the impact of public investments in data visualisation. Likewise, external recognition and participation in professional networks, as evidenced in the case of Madrid, contribute to continuous improvement and the exchange of best practices between administrations.
In general terms, open data visualisation initiatives represent a very valuable opportunity in the transparency and open government strategy of Spanish public administrations. The cases of Madrid, Castilla y León, as well as the Canary Islands, are examples of the enormous potential for transforming public data into tools for citizen empowerment and improved public management.
The success of these initiatives lies in their ability to connect government information with the real needs of citizens, creating bridges of understanding that strengthen the relationship between administration and society. As these experiences mature and consolidate, it will be crucial to keep the focus on the usability, accessibility and relevance of visualisations, ensuring that open data truly delivers on its promise to contribute to a more informed, participatory and democratic society.
Open data visualisation is not just a technical issue, but a strategic opportunity to redefine public communication and strengthen the foundations of a truly open and transparent administration.
Noticia
How can public administrations harness the value of data? This question is not a simple one to address; its answer is conditioned by several factors that have to do with the context of each administration, the data available to it and the specific objectives set.
However, there are reference guides that can help define a path to action. One of them is published by the European Commission through the EU Publications Office, Data Innovation Toolkit, which emerges as a strategic compass to navigate this complex data innovation ecosystem.
This tool is not a simple manual as it includes templates to make the implementation of the process easier. Aimed at a variety of profiles, from novice analysts to experienced policy makers and technology innovators, Data Innovation Toolkit is a useful resource that accompanies you through the process, step by step.
It aims to democratise data-driven innovation by providing a structured framework that goes beyond the mere collection of information. In this post, we will analyse the contents of the European guide, as well as the references it provides for good innovative use of data.
Structure covering the data lifecycle
The guide is organised in four main steps, which address the entire data lifecycle.
-
Planning
The first part of the guide focuses on establishing a strong foundation for any data-driven innovation project. Before embarking on any process, it is important to define objectives. To do so, the Data Innovation Toolkit suggests a deep reflection that requires aligning the specific needs of the project with the strategic objectives of the organisation. In this step, stakeholder mapping is also key. This implies a thorough understanding of the interests, expectations and possible contributions of each actor involved. This understanding enables the design of engagement strategies that maximise collaboration and minimise potential conflicts.
To create a proper data innovation team, we can use the RACI matrix (Responsible, Accountable, Consulted, Informed) to define precise roles and responsibilities. It is not just about bringing professionals together, but about building multidisciplinary teams where each member understands their exact role and contribution to the project. To assist in this task the guide provides:
- Challenge definition tool: to identify and articulate the key issues they seek to address, summarising them in a single statement.
- Stakeholder mapping tool: to visualise the network of individuals and organisations involved, assessing their influence and interests.
- Team definition tool: to make it easier to identify people in your organisation who can help you.
- Tool to define roles: to, once the necessary profiles have been defined, determine their responsibilities and role in the data project in more detail, using a RACI matrix.
- Tool to define People: People is a concept used to define specific types of users, called behavioural archetypes. This guide helps to create these detailed profiles, which represent the users or clients who will be involved in the project.
- Tool for mapping Data Journey: to make a synthetic representation describing step by step how a user can interact with his data. The process is represented from the user's perspective, describing what happens at each stage of the interaction and the touch points.
-
Collection and processing
Once the team has been set up and the objectives have been identified, a classification of the data is made that goes beyond the traditional division between quantitative and qualitative data.
Quantitative scope:
-
Discrete data, such as the number of complaints in a public service, represents not only a number, but an opportunity to systematically identify areas for improvement. They allow administrations to map recurrent problems and design targeted interventions. Ongoing data, such as response times for administrative procedures, provide a snapshot of operational efficiency. It is not just a matter of measuring, but of understanding the factors that influence the variability of these times and designing more agile and efficient processes.
Qualitative:
-
Nominal (name) data enables the categorisation of public services, allowing for a more structured understanding of the diversity of administrative interventions.
-
Ordinal (number) data, such as satisfaction ratings, become a prioritisation tool for continuous improvement.
A series of checklists are available in the document to review this aspect:
- Checklist of data gaps: to identify if there are any gaps in the data to be used and, if so, how to fill them.
- Template for data collection: to align the dataset to the objective of the innovative analysis.
- Checklist of data collection: to ensure access to the data sources needed to run the project.
- Checklist of data quality: to review the quality level of the dataset.
- Data processing letters: to check that data is being processed securely, efficiently and in compliance with regulations.
-
Sharing and analysis
At this point, the Data Innovation Toolkit proposes four analysis strategies that transform data into actionable knowledge.
- Descriptive analysis: goes beyond the simple visualisation of historical data, allowing the construction of narratives that explain the evolution of the phenomena studied.
- Diagnostic analysis: delves deeper into the investigation of causes, unravelling the hidden patterns that explain the observed behaviours.
- Predictive analytics: becomes a strategic planning tool, allowing administrations to prepare for future scenarios.
- Prescriptive analysis: goes a step further, not only projecting trends, but recommending concrete actions based on data modelling.
In addition to analysis, the ethical dimension is fundamental. The guide therefore sets out strict protocols to ensure secure data transfers, regulatory compliance, transparency and informed consent. In this section, the following checklistis provided:
- Data sharing template: to ensure secure, legal and transparent sharing.
- Checklist for data sharing: to perform all the necessary steps to share data securely, ethically and achieving all the defined objectives.
- Data analysis template: to conduct a proper analysis to obtain insights useful and meaningful for the project.
-
Use and evaluation
The last stage focuses on converting the insights into real actions. The communication of results, the definition of key performance indicators (KPIs), impact measurement and scalability strategies become tools for continuous improvement.
A collaborative resource in continuous improvement
In short, the toolkit offers a comprehensive transformation: from evidence-based decision making to personalising public services, increasing transparency and optimising resources. You can also check the checklist available in this section which are:
- Checklist for data use: to review that the data and the conclusions drawn are used in an effective, accountable and goal-oriented manner.
- Data innovation through KPI tool: to define the KPIs that will measure the success of the process.
- Impact measurement and success evaluation tools: to assess the success and impact of the innovation in the data project.
- Data innovation scalability plan: to identify strategies to scale the project effectively.
In addition, this repository of innovation resources and data is a dynamic catalogue of knowledge including expertise articles, implementation guides, case studies and learning materials.
You can access here the list of materials provided by the Data Innovation Toolkit.
You can even contact the development team if you have any questions or would like to contribute to the repository:
To conclude, harnessing the value of data with an innovative perspective is not a magic leap, but a gradual and complex process. On this path, the Data Innovation Toolkit can be useful as it offers a structured framework. Effective implementation will require investment in training, cultural adaptation and long-term commitment.
Noticia
On 28 November, the 2nd Forum for the Government and the Autonomous Communities to meet around data was held in Seville, organised by the State Secretariat for Digitalisation and Artificial Intelligence (SEDIA), in collaboration with the Andalusian Institute of Statistics and Cartography (IECA) and the Digital Agency of Andalusia (ADA). Almost all the autonomous communities participated, reflecting their commitment to data as a strategic driver of digital transformation.
The programme addressed key issues, such as the lessons learned in the implementation of data governance, the impact of its ethical use, and the potential of public-private collaboration in the deployment of sectoral data spaces, with emphasis on the Plan for the Promotion of Sectoral Data Spaces recently presented by the Ministry for Digital Transformation on 21 November.
Here is a summary of the key points of the meeting.
A space to exchange experiences, success stories and lessons learned.
The event brought together more than 70 experts from units of the General State Administration and 15 autonomous communities and the Autonomous City of Melilla, which are active in the use and management of data in their organisations. El objetivo era poner en común las experiencias en este ámbito y compartir los casos de éxito y los aprendizajes derivados de la implantación de iniciativas de gobierno del dato, promoviendo la colaboración entre administraciones para mejorar la competitividad y la eficiencia digital futura.
The forum was opened by the Regional Minister of Presidency, Interior, Social Dialogue and Administrative Simplification of the Andalusian Regional Government, and the Director General of Data of the Ministry for Digital Transformation and Public Administration, and was closed by the Director of IECA.
The day was structured around three round tables with 15 speakers. The attendees were also able to answer various questions related to the subject matter of each of these roundtables, in order to ascertain their perceptions in this regard. This format facilitated a fruitful and enriching exchange of ideas that allowed attendees to explore key issues.
- Table 1 "Experiences of implementing Data Governance: Lessons learnt. The first round table focused on different experiences in data governance. The speakers shared the challenges faced and the practical lessons learned, with the aim of serving as an example and point of reflection for similar initiatives that participants might undertake in the future. The importance of support at the highest level and the use of existing frameworks, such as UNE specifications or the DAMA methodology, was stressed. The need to focus not only on technology, but also to respond to cultural and organisational changes, and to establish processes and structures that will last over time was also emphasised.
- Table 2 "Data with purpose: Success stories of ethical and reliable use of data". The second roundtable focused on presenting concrete results obtained through the ethical and reliable use of data. The speakers shared their backgrounds and achievements, illustrating the wide possibilities that a well governed and managed data can generate in terms of citizen service and improvement of public administration. The work to be done on the quantity and quality of datawas highlighted, without losing focus on the future goal, which is to solve today's problems through sustainable projects.
- Table 3 "Data spaces from the perspective of public-private collaboration and the enhancement of public data". The third and final roundtable explored the paradigm of data spaces. Special emphasis was placed on public-private partnerships and how to enhance the value of public data. A highlight of this session was the presentation by the Directorate General for Data of the Plan for the Promotion of Sectoral Data Spaces. This plan seeks to deploy data spaces across the different productive sectors, underlining the fundamental value that quality public data can have in their effective implementation.
Overall, these roundtables not only provided a platform for the exchange of knowledge and experiences, but also laid the groundwork for future collaborations and innovative projects in the field of data management and governance in the Spanish public administration.
Attendees were very appreciative of the wide variety of roles involved, giving different views on something as complex as data governance, which includes many different approaches and competencies. The general perception is that shared experiences help others to try to circumvent the barriers that others have previously had to overcome and to reach the final goal faster, which is to provide better service and implement better public policies for citizens through a data-driven government.
Conclusions of the Forum
Some of the conclusions reached were:
- It is necessary to focus on data quality. Without quality data, well governed and managed, it will be difficult to achieve valuable solutions, for example in the field of artificial intelligence.
- Invest in data governance by ensuring sustainable projects. Data governance is not just about technology, but about business and services. It requires considerable effort on the part of organisations to create data that reflect reality and are truly useful for decision-making, breaking down silos and implementing citizen-oriented services. To this end, it is recommended to build on existing conceptual frameworks, oriented towards processes and organisational structures that are sustainable over time.
- The Autonomous Communities can help the deployment of the Plan for the Promotion of Data Spaces from a public-private partnership perspective and benefit from its actions.
- We need to influence the data culture in organisations. The objective is to incorporate data governance into the different business areas, supporting organisational objectives, ensuring that the data culture permeates the organisation and is perceived as something transversal that contributes value to the different sectors as well as to the administration and society as a whole.
Upcoming performances
After the success of the first edition, held in Navarre in 2023, the forum has been consolidated as a reference space for the exchange of experiences and good practices in data management, essential for those seeking to lead the future of data management in public administrations.
Theday concluded with a proposal for continuity, highlighting the need to create a community of knowledge exchange between editions. Furthermore, the Principality of Asturias has applied to host the third edition of the forum, to be held in 2025, which demonstrates the growing interest in further consolidating this space for inter-institutional cooperation on data.
Blog
The Big Data Test Infrastructure (BDTI) is a tool funded by the European Digital Agenda, which enables public administrations to perform analysis with open data and open source tools in order to drive innovation.
This free-to-use, cloud-based tool was created in 2019 to accelerate digital and social transformation. With this approach and also following the European Open Data Directive, the European Commission concluded that in order to achieve a digital and economic boost, the power of public administrations' data should be harnessed, i.e. its availability, quality and usability should be increased. This is how BDTI was born, with the purpose of encouraging the reuse of this information by providing a free analysis test environment that allows public administrations to prototype solutions in the cloud before implementing them in the production environment of their own facilities.
What tools does BDTI offer?
Big Data Test Infrastructure offers European public administrations a set of standard open source tools for storing, processing and analysing their data. The platform consists of virtual machines, analysis clusters, storage and network facilities. The tools it offers are:
- Databases: to store data and perform queries on the stored data. The BDTI currently includes a relational database(PostgreSQL), a document-oriented database(MongoDB) and a graph database(Virtuoso).
- Data lake: for storing large amounts of structured and unstructured data (MinIO). Unstructured raw data can be processed with deployed configurations of other building blocks (BDTI components) and stored in a more structured format within the data lake solution.
- Development environments: provide the computing capabilities and tools necessary to perform standard data analysis activities on data from external sources, such as data lakes and databases.
- JupyterLab, an interactive, online development environment for creating Jupyter notebooks, code and data.
- Rstudio, an integrated development environment for R, a programming language for statistical computing and graphics.
- KNIME, an open source data integration, reporting and analytics platform with machine learning and data mining components, can be used for the entire data science lifecycle.
- H2O.ai, an open sourcemachine learning ( ML) and artificial intelligence (AI) platform designed to simplify and accelerate the creation, operation and innovation with ML and AI in any environment.
- Advanced processing: clusters and tools can also be created to process large volumes of data and perform real-time search operations(Apache Spark, Elasticsearch and Kibana)
- Display: BDTI also offers data visualisation applications such as Apache Superset, capable of handling petabyte-scale data, or Metabase.
- Orchestration: for the automation of data-driven processes throughout their lifecycle, from preparing data to making data-driven decisions and taking actions based on those decisions, is offered:
- Apache Airflow, an open source workflow management platform that allows complex data pipelines to be easily scheduled and executed.
Through these cloud-based tools, public workers in EU countries can create their own pilot projects to demonstrate the value that data can bring to innovation. Once the project is completed, users have the possibility to download the source code and data to continue the work themselves, using environments of their choice. In addition, civil society, academia and the private sector can participate in these pilot projects, as long as there is a public entity involved in the use case.
Success stories
These resources have enabled the creation of various projects in different EU countries. Some examples of use cases can be found on the BDTI website. For example, Eurostat carried out a pilot project using open data from internet job advertisements to map the situation of European labour markets. Other success stories included the optimisation of public procurement by the Norwegian Agency for Digitisation, data sharing efforts by the European Blood Alliance and work to facilitate understanding of the impact of COVID-19 on the city of Florence .
In Spain, BDTI enabled a data mining project atthe Conselleria de Sanitat de la Comunidad Valenciana. Thanks to BDTI, knowledge could be extracted from the enormous amount of scientific clinical articles, a task that supported clinicians and managers in their clinical practices and daily work.

Courses, newsletter and other resources
In addition to publishing use cases, theBig Data Test Infrastructure website offers an free online course to learn how to get the most out of BDTI. This course focuses on a highly practical use case: analysing the financing of green projects and initiatives in polluted regions of the EU, using open data from data.europa.eu and other open sources.
In addition, a monthly newsletter on the latest BDTI news, best practices and data analytics opportunities for the public sector has recently been launched .
In short, the re-use of public sector data (RISP) is a priority for the European Commission and BDTI(Big Data Test Infrastructure) is one of the tools contributing to its development. If you work in the public administration and you are interested in using BDTI register here.
Blog
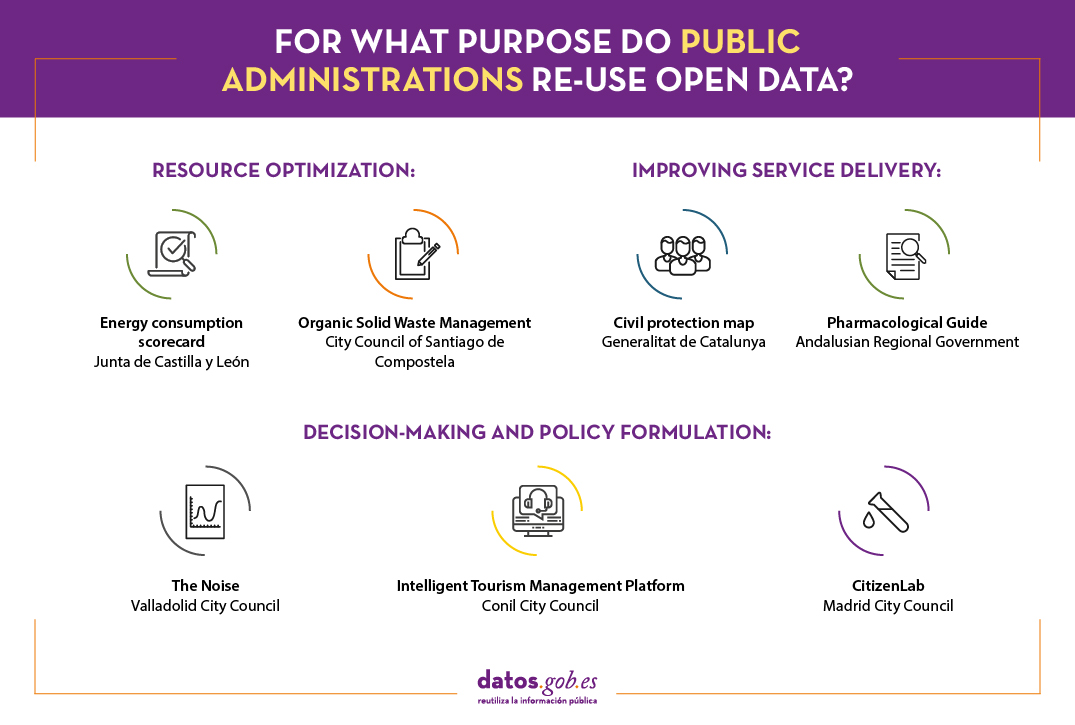
Open data is a source of information for the development of smart services, as well as for decision-making and policy-making. It is therefore not surprising that an increasing number of public bodies, in addition to opening data - for reuse by others and for reasons of accountability and transparency - are also reusing their own data for different purposes.
In this sense, the rise of smart city management platforms is encouraging many city councils and autonomous communities to develop smart applications and tools that take advantage of the use of data and analytical techniques to innovate and improve the public services they offer to citizens. Below, we show you several examples.
Resource optimisation
Open data can be used by public bodies to understand how public resources are being managed, as well as to promote actions that enable more efficient management and economic savings, e.g. in terms of energy consumption or by promoting more efficient resource management.
Energy consumption scorecard. Junta de Castilla y León.
This energy datahub, developed by the open data initiative of the Junta de Castilla y León, offers detailed and visual information on energy consumption in the centres managed by the Junta, such as educational centres, health centres, administrative offices or hospitals, among others.
It is a scorecard that gathers information from more than 1,500 consumption centres, offering different types of graphical representations that make it easier for the reader to understand the data. The data source used for the development of this platform can be consulted via this link.
The tool facilitates disaggregated analysis by type of energy and geographical location. This information may be of interest to citizens, but also to the Board's own managers. Thanks to this platform, between 2015 and the beginning of 2020, the Board saved more than 12 million euros in electricity.
In addition, the regional government has an electricity table that focuses exclusively on the electricity consumption of hospitals in Castilla y León on an hourly basis. The data is linked to meteorological information, so that future costs can be estimated and the use of heating can be optimised. The data used to develop this table can be consulted here.
Organic solid waste management. City Council of Santiago de Compostela.
The City Council of Santiago de Compostela has launched, within the Smartiago initiative, a project that aims to achieve a sustainable and intelligent management of municipal solid waste (MSW). The main objective of this tool is to design, develop and build smart surface containers for the characterisation of organic solid waste, based on the use of open IoT technologies, the application of machine learning algorithms and the use of open data as sources for the enrichment of community composting prediction models. This aims to achieve the 50% readiness for reuse and recycling target, up from the current 13%. The project, currently under development, will also include a gamification app to encourage good practices in sustainability.
Improving service delivery
Thanks to open data it is also possible to create tools for social service professionals to provide a better response and attention to the needs of citizens. Let's look at a couple of examples:
Civil protection map. Generalitat de Catalunya.
This interactive map shows the main resources of the civil protection system in Catalonia. The civil protection map allows you to see where the different risks are located (technological, environmental...) and the situation of the teams in order to better plan responses. Here you can consult the main source of data used by this tool.
Pharmacological Guide. Andalusian Regional Government.
This application has been designed by the Andalusian Regional Government to offer healthcare professionals a faster and more efficient consultation of the main drugs used in emergency care in Andalusia. It is a useful working tool for those healthcare professionals who aid in critical situations as it includes constantly updated and contrasted information on the main indications, doses, contraindications and interactions of the most commonly used drugs.
Decision-making and policy formulation
Open data provides greater knowledge about what is happening around us, enabling us to make better decisions. It is a very useful tool for public bodies to develop policies that respond to the real needs of citizens. Over the last year, we have seen how measures to prevent the spread of COVID-19 have been taken on the basis of data on the evolution of the disease. Other examples are:
The Noise Map. Valladolid City Council.
Valladolid City Council has a Noise Map that organises information on noise pollution. This map has been developed to be used in a compulsory way in the execution of the calculations foreseen in the different regulatory standards, as well as in the technical building code and which will apply to residential, institutional and industrial buildings, as well as in the technical building code and which will apply to residential, institutional and industrial buildings.
Intelligent tourism management platform. Conil Town Council.
Within the framework of Red.es' Smart Cities, Territories and Islands calls for proposals, we are finding more and more proposals that include the development of data management platforms that promote efficient decision-making. One example is the City Council of Conil de la Frontera, which is working with a smart tourism management platform to increase the knowledge of tourists, through the aggregation and centralisation of data related to the origin of the tourist, mobility and most visited areas, preferred places to visit and stay overnight or satisfaction surveys, among other parameters. In this way, the local administration can identify patterns and carry out actions to adapt and improve management, detect irregularities, promote economic and business development or favour the generation of employment in the priority areas identified. These data have also been used to estimate the real population during the pandemic and to make a better estimate of incidence rates. Although these data do not appear to be public for the moment, the aim is to open them to companies through an open data platform.
CitizenLab. Madrid City Council.
The regional government of Madrid, together with Grant Thornton, has launched a datalab to better understand citizen behaviour. The project seeks to analyse predictive models of citizen behaviour using Big Data and Artificial Intelligence (AI), with the aim of improving public services in the Madrid region in areas such as mobility, healthcare, tourism and infrastructure. In the last year, for example, it has been used to predict the demand for vaccines.
Undoubtedly, there are numerous applications and digital tools used by public administrations - and it seems that there will be more - that base their operation on open data to offer more and better services to citizens. In this article we have compiled some examples, but if you know of any related ones that may be of interest, do not hesitate to leave a comment or write to us at our email address dinamizacion@datos.gob.es.
Content prepared by the datos.gob.es team.