Blog
Open data is a valuable tool for making informed decisions that encourage the success of a process and enhance its effectiveness. From a sectorial perspective, open data provides relevant information about the legal, educational, or health sectors. All of these, along with many other areas, utilize open sources to measure improvement compliance or develop tools that streamline work for professionals.
The benefits of using open data are extensive, and their variety goes hand in hand with technological innovation: every day, more opportunities arise to employ open data in the development of innovative solutions. An example of this can be seen in urban development aligned with the sustainability values advocated by the United Nations (UN).
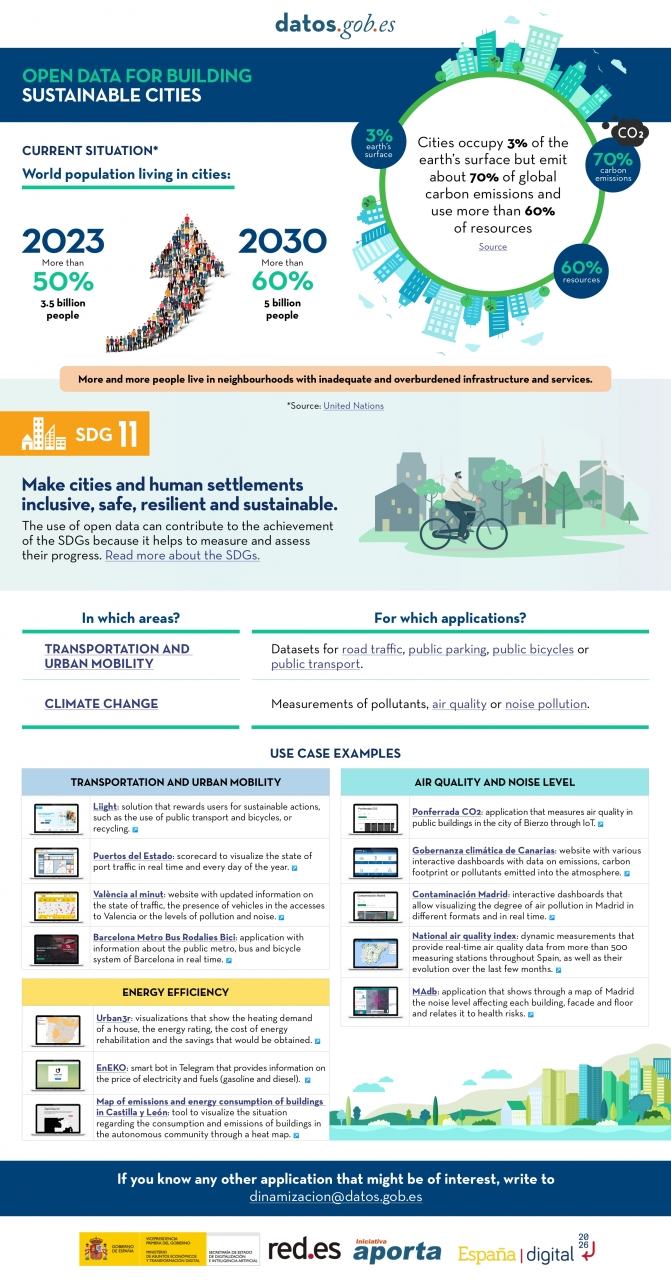
Cities cover only 3% of the Earth's surface; however, they emit 70% of carbon emissions and consume over 60% of the world's resources, according to the UN. In 2023, more than half of the global population lives in cities, and this figure is projected to keep growing. By 2030, it is estimated that over 5 billion people would live in cities, meaning more than 60% of the world's population.
Despite this trend, infrastructures and neighborhoods do not meet the appropriate conditions for sustainable development, and the goal is to "Make cities and human settlements inclusive, safe, resilient, and sustainable," as recognized in Sustainable Development Goal (SDG) number 11. Proper planning and management of urban resources are significant factors in creating and maintaining sustainability-based communities. In this context, open data plays a crucial role in measuring compliance with this SDG and thus achieving the goal of sustainable cities.
In conclusion, open data stands as a fundamental tool for the strengthening and progress of sustainable city development.
In this infographic, we have gathered use cases that utilize sets of open data to monitor and/or enhance energy efficiency, transportation and urban mobility, air quality, and noise levels. Issues that contribute to the proper functioning of urban centers.
Click on the infographic to view it in full size.
Noticia
The collaborative project Ciudades Abiertas organize a workshop cycle to disseminate the results obtained throughout the execution of this project. Throughout the project, various tools and solutions have been developed that are to be made known so that other regions can implement them.
What is Ciudades Abiertas?
Ciudades Abiertas is a collaborative project led by four municipalities (A Coruña, Madrid, Santiago de Compostela and Zaragoza) in collaboration with Red.es.
Its main objective is to offer city councils technological tools that allow the development of new reusable initiatives by other organizations. In this way, they seek to facilitate interoperability between administrations, the publication of open data, transparency and the participation of citizens.
Among its lines of action is the promotion of open data. The project provides the technical and conceptual means necessary for the “management of shared unique data, open by default, georeferenced and semantically annotated by the city”. It also offers a vocabularies catalog and common and open data structures on Github for free use. You can learn more about their performances at this article and on their own Web page.
Who are the workshops aimed at?
The workshops are aimed both at representatives of different organizations and at all citizens interested in attending.
In the case of organizations, they will be provided with the necessary information so that they can implement the solutions in their own initiatives.
When will the cycle of workshops be held?
The cycle organized by Open Cities consists of 6 workshops that will be held throughout the month of October, the first beginning on the 6th. All of them will be held virtually. To be able to attend, it is essential to make a prior registration individually in each of the workshops in which you want to participate.
In the first workshop there will be a presentation of the project and the lines of action carried out within it. The rest of the workshops will address specific aspects, linked to the different lines of action.
Next, we show you the complete calendar of workshops:
Workshop 1: Open Cities, a boost for open government policies
Date: 10/06/2021
Hour: 10:00
Duration: 2h
Workshop 2: Standardization in access to open data
Date: 10/07/2021
Hour: 16:00
Duration: 2h
Workshop 3: Vocabularies, a key element of interoperability
Date: 10/14/2021
Hour: 10:00
Duration: 2h
Workshop 4: Development of visualizations on open data
Date: 10/19/2021
Hour: 10:00
Duration: 2h
Workshop 5: Transparency from the perspective of open data
Date: 10/21/2021
Hour: 16:00
Duration: 2h
Workshop 6: Methodology for the implementation of participatory processes in cities
Date: 10/27/2021
Hour: 10:00
Duration: 2h
If you need more information about the cycle organized by Ciudades Abiertas or about the project, you can contact the organization through the email address contacto@ciudadesabiertas.es
Blog
In any project related to data, it is common to have different sources of information. Data is key for companies and public administrations, in decision making or as a basis for the implementation of projects, services or products. But if these data sources display information in a heterogeneous way, it is difficult to operate.
In the world of open data, each administration covers a different scope, be it territorial - municipal, provincial, regional or national - or jurisdictional - for example, each ministry deals with data from a specific area: ecological transition, health, mobility, etc. -. To be able to carry out projects that cover several areas, we will need interoperable data. Otherwise, the exchange and integration of data within and between organisations will be incompatible.
Why is data harmonisation important?
Today, public administrations manage large amounts of data in different formats, with different management methods. It is common to host multiple copies in many different repositories. These data are often disseminated in portals across Europe without any harmonisation in terms of content and presentation. This explains the low level of re-use of existing information on citizens and businesses. Harmonisation of information allows for consistent and coherent data in a way that is compatible and comparable, unifying formats, definitions and structures.
This shaping of data can be done individually for each project, but it entails a high cost in terms of time and resources. It is therefore necessary to promote standards that allow us to have already harmonised data. Below are several examples of initiatives that advocate the search for common requirements, which are included in this visual:
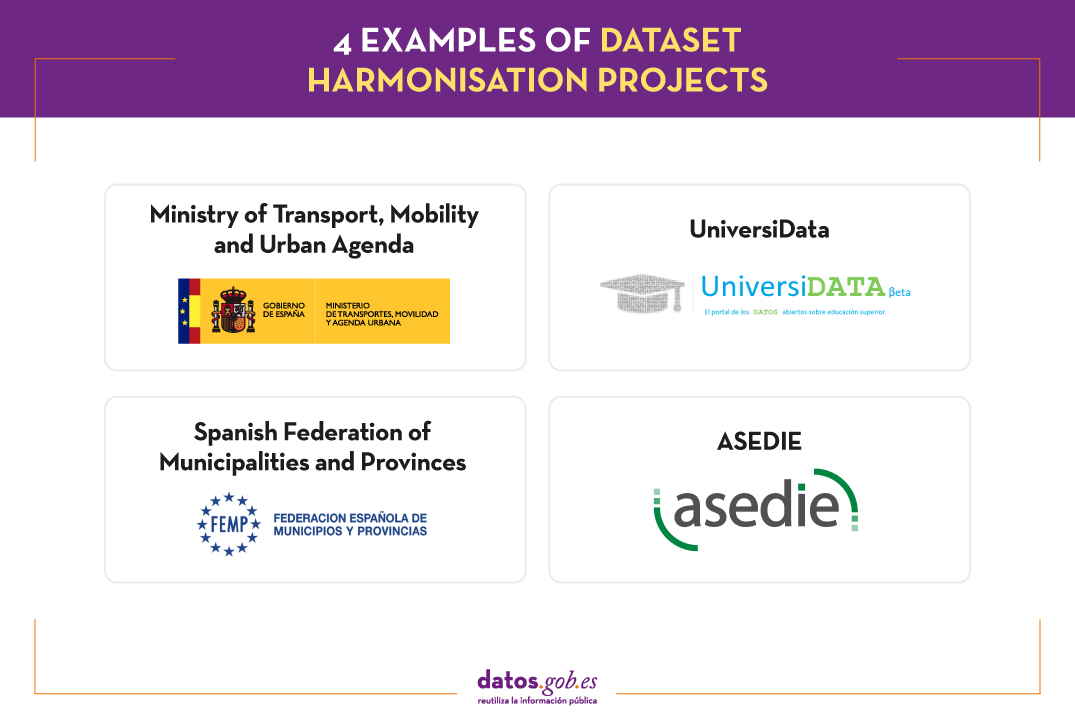
Ministry of Transport, Mobility and Urban Agenda
The Ministry of Transport, Mobility and Urban Agenda is working on a National Access Point (PAN, in its Spanish singles) where unified data on different modes of transport is collected. The creation of this portal responds to compliance with Commission Delegated Regulation (EU) 2017/1926, which establishes the obligation for authorities, operators, managers and providers of transport services to provide information on multimodal journeys in the EU, based on a series of specifications that ensure its availability and reliability. Among other issues, it indicates that the content and structure of the relevant travel and traffic data need to be adequately described using appropriate metadata.
The creation of this Single Access Point was published in the Official State Gazette (BOE) on 22 February. The text indicates that the minimum universal traffic information related to road safety will be made public, whenever possible and free of charge, with a special focus on real-time services.
At the moment, the PAN has data from the DGT, the Basque Government, the Generalitat de Catalunya, the Madrid City Council and the company Tomtom.
Spanish Federation of Municipalities and Provinces
The Spanish Federation of Municipalities and Provinces (FEMP, in its Spanish singles) has an open data group that has developed two guides to help municipalities implement open data initiatives. One of them is the proposal of 40 datasets that every administration should open to facilitate the reuse of public sector information. This guide not only seeks uniformity in the categories of data published, but also in the way they are published. A fact sheet has been created for each proposed dataset with information on update frequency, formats or recommended display form.
FEMP's future plans include reviewing the datasets published so far to assess whether to add or remove datasets and to include new practical examples.
Also in the field of cities, there is an initiative to further ground the harmonisation of a limited subset of datasets carried out in the framework of the Ciudades Abiertas project, with the collaboration of Red.es. The city councils participating in the project - A Coruña, Madrid, Santiago de Compostela and Zaragoza - have agreed on the opening of 27 harmonised datasets. Currently, common vocabularies have been developed for 16 of them and work continues on the others.
ASEDIE and its Top 3
In 2019, the Multisectoral Information Association (ASEDIE) launched an initiative for all Autonomous Communities to fully open three sets of data: the databases of cooperatives, associations and foundations. It was also proposed that they should all follow unified criteria to facilitate their reuse, such as the incorporation of the NIF of each of the entities.
The results have been very positive. To date, 15 autonomous communities have opened at least two of the three databases. The database of Associations has been opened by all 17 Autonomous Communities.
In 2020, ASEDIE proposed a new Top 3 and started to promote the opening of new databases: commercial establishments, industrial estates and SAT registers. However, due to the fact that not all Autonomous Regions have a register of commercial establishments (because it is not a regional competence), this dataset has been replaced by the Register of Energy Efficiency Certificates.
UniversiData
UniversiData is a collaborative project to promote open data linked to higher education in Spain in a harmonised way. To date, five universities have joined the project: Universidad Autónoma de Madrid, Universidad Complutense de Madrid, Universidad Rey Juan Carlos, Universidad de Valladolid and Universidad Carlos III de Madrid (UC3M).
Within the framework of the project, the "Common Core" specification has been developed, with the aim of providing answers to two questions that the universities ask themselves when opening their data: What datasets should I publish? And how should I do it? That is to say, with which fields, granularity, formats, encodings, frequency, etc. The Common Core coding has been created in accordance with the Law on Transparency, Access to Public Information and Good Governance. Two University Transparency Rankings have also been considered for its development (that of the Fundación Compromiso y Transparencia and that of Dyntra), as well as the document "Towards an Open University: Recommendations for the S.U.E.", of the Conference of Rectors of Spanish Universities (CRUE).
All these initiatives show how data harmonisation can improve the usefulness of data. If we have unified data, its reuse will be easier, as the time and cost of its analysis and management will be reduced.
Content prepared by the datos.gob.es team.
Blog
Each individual, organization or group uses a number of common words in their daily communication, which would be their personal vocabularies. The greater the number of words we use, the greater our ability to communicate, but it can also be a barrier, increasing the difficulty of understanding other people who are not familiar with the same terms as we are. The same is true in the world of data.
To avoid misunderstandings, we must use a controlled vocabulary, which is nothing more than a defined list of terms to systematically organize, categorize or label information.
What is a data vocabulary?
For a successful implementation of a data governance initiative, whether private or public, we must provide the process with a business Glosary or reference vocabulary. A reference vocabulary is a means of sharing information and developing and documenting standard data definitions to reduce ambiguity and improve communication. These definitions should be clear, rigorous in their wording and explain any exceptions, synonyms or variants. A clear example is EuroVoc, which covers the activities of the European Union and, in particular, the European Parliament. Another example is ICD10, which is the Coding Manual for Diagnoses and Procedures in Health Care.
The objectives of a controlled vocabulary are as follows:
- To enable common understanding of key concepts and terminology, in a precise manner.
- To reduce the risk of data being misused due to inconsistent understanding of concepts.
- Maximize searchability, facilitating access to documented knowledge.
- Drive interoperability and data reuse, which is critical in the open data world.
Vocabularies vary in the complexity of their development, from simple lists or selection lists, to synonym rings, taxonomies or the most complex, thesauri and ontologies.
How is a vocabulary created?
When creating a vocabulary, it does not usually start from scratch, but is based on pre-existing ontologies and vocabularies, which favors communication between people, intelligent agents and systems. For example, Aragón Open Data has developed an ontology called Interoperable Information Structure of Aragón EI2A that homogenizes structures, vocabularies and characteristics, through the representation of entities, properties and relationships, to fight against the diversity and heterogeneity of existing data in the Aragonese Administration (data from local entities that do not always mean the same thing). For this purpose, it is based on proposals such as RDF Schema (a general vocabulary for modeling RDF schemas that is used in the creation of other Vocabularies), ISA Programme Person Core Vocabulary (aimed at describing persons) or OWL-Time (describing temporal concepts).
A vocabulary must be accompanied by a data dictionary, which is where the data is described in business terms and includes other information needed to use the data, such as details of its structure or security restrictions. Because vocabularies evolve over time, they require evolutionary maintenance. As an example, ANSI/NIZO Z39.19-2005 is a standard that provides guidelines for the construction, formatting and management of controlled vocabularies. We also find SKOS, a W3C initiative that provides a model for representing the basic structure and content of conceptual schemas in any type of controlled vocabulary.
Examples of Vocabularies in specific fields created in Spain
In the Spanish context, with a fragmented administrative structure, where each agency shares its open information individually, it is necessary to have common rules that allow us to homogenize the data, facilitating its interoperability and reuse. Fortunately, there are various proposals that help us in these tasks.
The following are examples of vocabularies created in our country for two fundamental sectors for the future of society, such as education and smart cities.
Smart cities
An example of the construction of domain-specific vocabularies can be found in ciudades-abiertas.es, which is an initiative of several city councils in Spain (A Coruña, Madrid, Santiago de Compostela and Zaragoza) and Red.es.
Among other actions, within the framework of the project, they are working on the development of a catalog of well-defined and documented vocabularies, with examples of use and available in several representation languages. Specifically, 11 vocabularies are being developed corresponding to a series of datasets selected by the municipalities that do not have a defined standard. An example of these vocabularies is the Municipal Agenda.
These vocabularies are generated using the OWL standard language, which is the acronym for Web Ontology Language, a markup language for publishing and sharing data using ontologies on the Web. The corresponding contexts for JSON-LD, N-triples, TTL and RDF/XML are also available. In this explanatory video we can see how these vocabularies are defined. The generated vocabularies are available in the Github repository.
Education
In the field of universities, on the other hand, we find the proposal for open data content for universities developed by the UniversiDATA community: Common Core. In version 1.0, 42 datasets have been identified that every university should publish, such as information related to Degrees, Enrolments or Tenders and contracts. At the moment there are 11 available, while the rest are in the process of elaboration.
For example, the UAM (Autónoma de Madrid), the URJC (Rey Juan Carlos) and the UCM (Complutense de Madrid) have published their degrees following the same vocabulary.
Although much progress has been made in the creation and application of data vocabularies in general, there is still room for progress in the field of research on controlled vocabularies for publishing and querying data on the Web, for example, in the construction of Business Glosaries linked to technical data dictionaries. The application of best practices and the creation of vocabularies for the representation of metadata describing the content, structure, provenance, quality and use of datasets will help to define more precisely the characteristics that should be incorporated into Web data publishing platforms.
Content elaborated by David Puig, Graduate in Information and Documentation and responsible for the Master Data and Reference Group at DAMA ESPAÑA.
Contents and points of view expressed in this publication are the exclusive responsibility of its author.
Documentación
The saying "a picture is worth a thousand words" is a clear example of popular wisdom based on science. 90% of the information we process is visual, thanks to a million nerve fibers that link the eye to the brain and more than 20,000 million neurons that perform the processing of the impulses received at high speed. That is why we are able to remember 80% of the images we see, while in the case of text and sound the percentages are reduced to 20% and 10%, respectively.
These data explain the importance of data visualization in any sector of activity. It is not the same to tell how an indicator evolves, as to see it through visual elements, such as graphs or maps. Data visualization helps us understand complex concepts and is an accessible way to detect and understand trends and patterns in the data.
Data Visualization and Smart Cities
In the case of Smart Cities, where so much information is generated and captured, data visualization is fundamental. Throughout the length and breadth of a smart city, there are a large number of sensors and smart devices, with different detection capabilities, which generate a large amount of raw data. To give an example, only the city of Barcelona has more than 18,000 sensors spread throughout the city that capture millions of data. This data allows from real time monitoring of the environment to informed decision making or accountability. Visualizing this data through visual dashboards speeds up all these processes.
To help Smart Cities in this task, from the Open Cities project, led by Red.es and four city councils (A Coruña, Madrid, Santiago de Compostela and Zaragoza), a series of visualization tools have been selected and an extension has been developed for CKAN similar to the functionality "Open With Apps", initially designed for the Data.gov portal, which facilitates the integration with this type of tools.
The integration method inspired by "Open with Apps"
The idea behind "Open With Apps" is to allow integration with some third party services, for some formats published in the open data portals, such as CSV or XLS, without the need to download and upload data manually, through the APIs or URIs of the external service.
But not all display systems allow this functionality. Therefore, since the Open Cities project they have analyzed several platforms and online tools for creating visualizations and data analysis, and have selected 3 that meet the necessary characteristics for the described operation:
- The integration is done through links to websites without the need to download any software.
- In the invocation it is only necessary to pass as a parameter the download URL of the data file.
The result of this analysis has given rise to the report "Analysis and definition of specifications for integration with external visualization systems", where 3 tools that comply with these functionalities are highlighted.
3 simple data visualization and analysis tools
According to the aforementioned report, the 3 platforms that meet the necessary characteristics to achieve such operation are:
- Plotly: facilitates the creation of interactive data visualizations and control panels to share online with the audience. More advanced users can process data with any custom function, as well as create simulations with Python scripts. Supported formats are CSV, TSV, XLS and XLSX.
- Carto: formerly known as CartoDB, it generates interactive maps from geospatial data. The maps are automatically created and the user can filter and refine the data for more information. It accepts files in CSV, XLS, XLSX, KML (Google Earth), KMZ, GeoJSON and SHP formats.
- Geojson.io: allows to visualize and edit geographic data in GeoJSON format, as well as to export to a large number of formats.
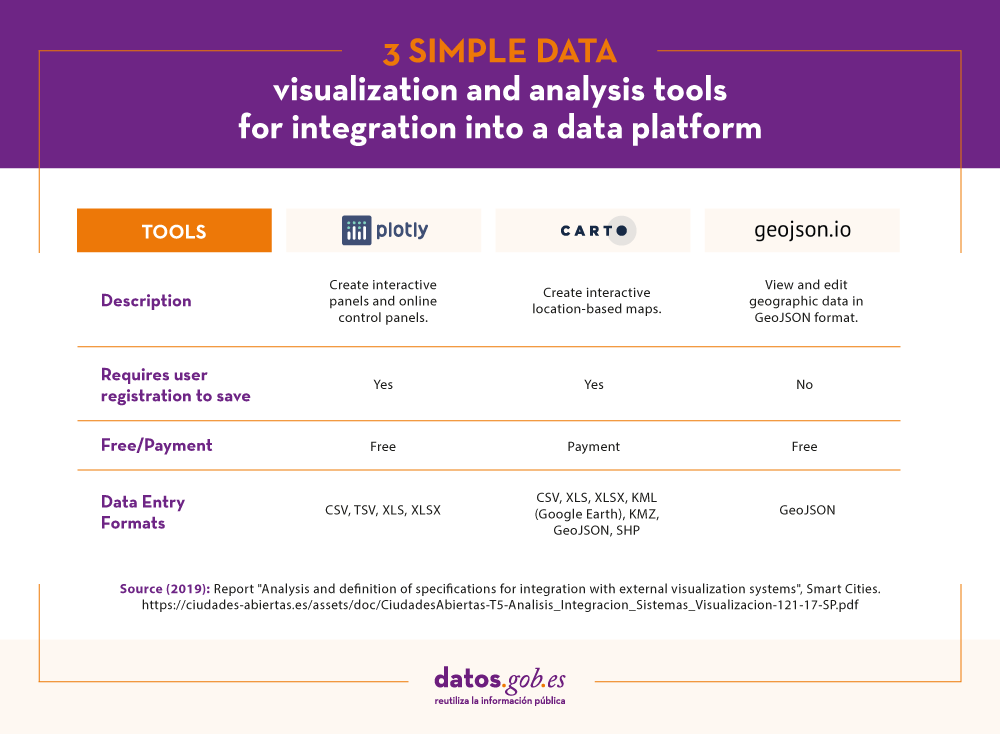
For each of these tools the report includes a description of its requirements and limitations, its mode of use, a generic call and specific examples of calls along with the result obtained.
The "Open with" extension
As mentioned above, within the project a CKAN extension called "Open with" has also been developed. This extension allows to visualize the data files using the external visualization systems described above. It can be accessed through the project's GitHub account.
The report explains how to carry out its installation in a simple way, although if any doubt arises about its operation, users can contact Open Cities through the e-mail contacto@ciudadesabiertas.es.
Those interested in other CKAN extensions related to data visualization have at their disposal the report Analysis of the Visualization Extensions for CKAN, carried out within the framework of the same initiative. In the Gighub account, it is expected that examples of visualizations made will be published.
In short, data visualization is a fundamental leg of Smart Cities, and thanks to the work of the Open Cities team it will now be easier for any initiative to integrate simple data visualization solutions into their information management platforms.
Noticia
Making a city "smart" is not easy. According to the report Smart cities: understanding the challenges and opportunities, the budget constraints and the lack of infrastructure are the two main barriers for populations wanting to implement Smart cities initiatives. In this context, interoperability and collaborative platforms that allow the sharing of resources are key to success.
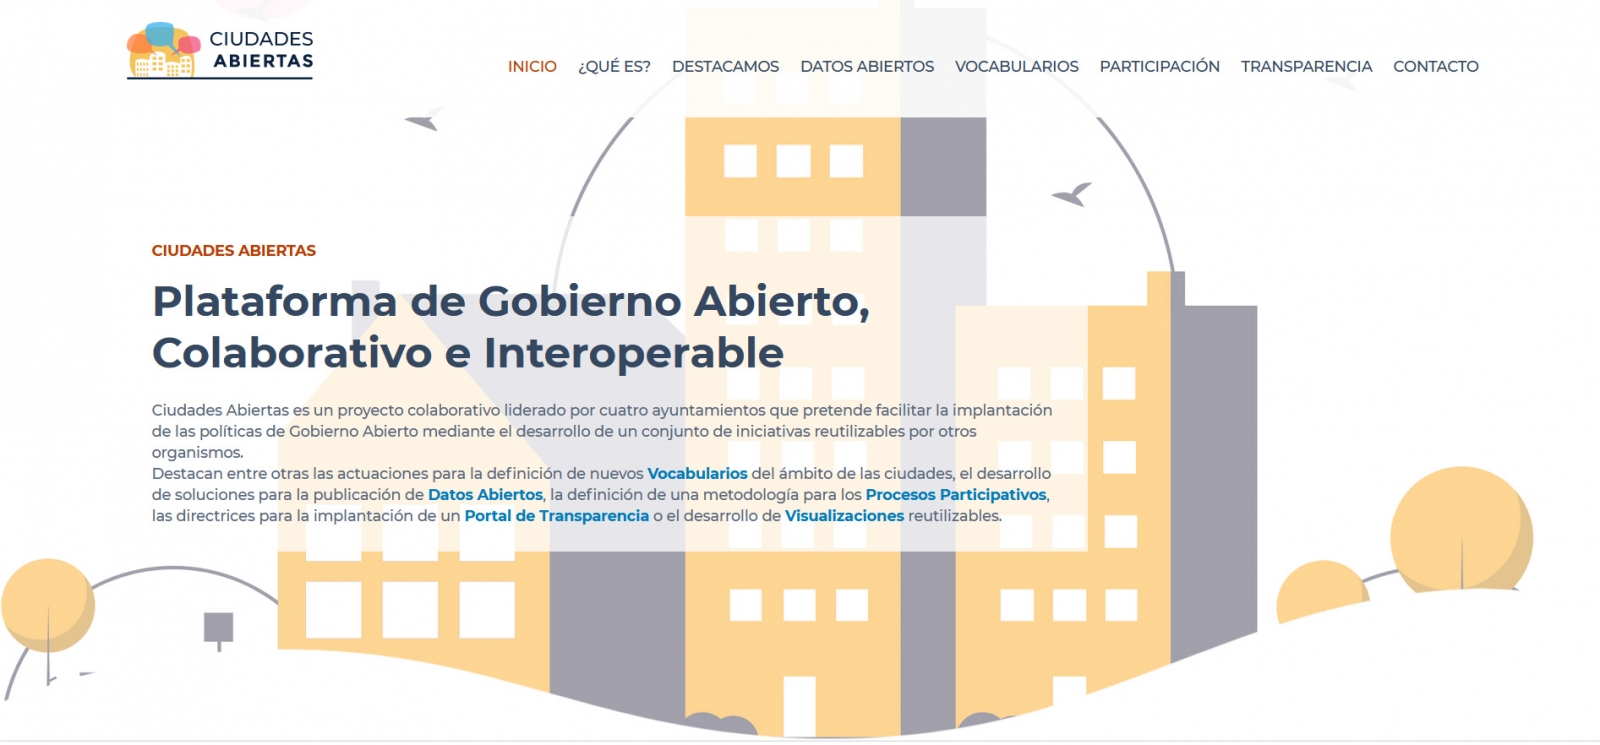
It was with this idea that the Ciudades Abiertas (Open Cities) project emerged 3 years ago, an open, collaborative and interoperable government platform, which was a beneficiary of the II Call for Smart Cities.
Collaboration between municipalities based on 4 lines of action
The Ciudades Abiertas project is led by Red.es and four city councils: A Coruña, Madrid, Santiago de Compostela and Zaragoza. Together, these city councils are developing various initiatives that can be reused by other bodies.
Recently, Ciudades Abiertas has updated its website, incorporating a new design, a highlights section with the latest news of the project and additional functionalities such as execution indicators.
The actions have been developed around 4 pillars:
- Open data: Open data is the most critical requirement of Smart Cities, as the above-mentioned study rightly pointed out. In this sense, the Open Cities project provides the technical and conceptual means necessary for the "management of unique shared data, open by default, georeferenced and semantically annotated by the city". Work is currently underway on the publication of a generic data REST API - or the development of a SPARQL access point to perform complex queries on several datasets at once, among other actions.
- Vocabulariums: The platform offers a catalogue of common and open vocabularies and data structures on Github for use by participating municipalities or any other entity. You can already access the vocabularies on the Municipal Agenda, Population Register or Public Bicycle, the last one to be incorporated in April of this year. They are currently working on other vocabularies such as Traffic or Budget and Budgetary Execution. Within this framework, a couple of videos have also been created to inform about what the vocabularies are and how they are generated and to raise awareness about the advantages of their use, in a simple and didactic way.
- Participation: The project seeks to promote citizen participation in several of the legislative, implementation and control activities carried out by the municipalities, in areas such as participatory budgets or day-to-day management. To this end, a methodology has been developed and two catalogues are provided, one of participatory processes and the other of instruments for participation. A list has also been included with specific examples of participatory processes that can be taken as a reference when setting up an initiative of this type.
- Transparency: Accountability is also a fundamental area of Smart Cities, so mechanisms are needed to ensure that all activities carried out by the council are provided with full transparency. One way to provide this information is through simple visualizations, easy to understand by citizens without technical knowledge. The project explores different ways to facilitate these visualisations. Two interesting reports have been prepared: Report with the Analysis of External Visualisation Systems and the Report with the Analysis of Visualisation Extensions for CKAN.
Next steps
The Open Cities project is still in full development. Among the activities to be developed in the coming months is the definition of new vocabularies until completing those recommended by the UNE 178301:2015 standard, or the creation of a general scorecard that allows comparisons of all the transparency indicators between cities, thanks to the homogenization of the data and its availability in reusable formats. They are also working, through collaborative workshops with citizens, on the design of visualizations that allow to offer information on transparency in an interactive way and with a simple language.
All these actions will facilitate the creation of new Smart Cities projects not only in these cities but in various territories throughout the country.
Evento
From September 26th to October 5th the international workshop Visualizar'16 Open Cities will take place in the cultural space Medialab Prado (Madrid), an event dedicated to those cities in the world that are committed to openness of information, transparency and re-use of data to improve services provided for citizens.
On this occasion, two simultaneous calls are opened: one call for projects related to open cities and an application for collaborators. During the workshop a maximum of 8 proposals will be developed, selected among those submitted until August 14th and the final list will be published on August 25th. The project proposals may be submitted individually or collectively, but they must necessarily be open to other collaborators who can contribute to their development during the workshop.
Secondly, those interested in participating as collaborators may submit their request until next September 19th. The collaborators, led by the project leaders, will be part of the working groups, providing expertise and ideas in the development of the selected projects. As there will be no selection process, all applications will be accepted until full capacity. Moreover, working groups will be completely organized during the initial presentation of the projects.
Participants in the workshop may register through the online platform Community, an interactive network of Medialab Prado that allows collaborators to contact the project leaders and send questions, opinions or comments.
The projects developed during Visualizar'16 Open Cities will be presented at the Open Cities Summit, to be held in the same place in October 5th and included in the agenda of events before the International Open Data Conference. Once the summit is over, the work will be exposed in Medialab Prado until December 12th.
The aim of the Visualizar'16 workshop is to re-use the city open data in different fields such as environmental sustainability, infrastructure, citizenship or socio-cultural sector. The proposals may include visualization tools, mechanisms of participatory data collection, development of open hardware tools for information collection, open data initiatives ... or any idea to exploit the potential of this resource in urban environments.
During nine days, a solution prototype will be developed and tested through eight working groups that will be coordinated by each project leader. Projects will be developed with free software, open standards and under licenses that allow their re-use and redistribution.
This workshop is included within the Medialab Prado program, Visualizar, which organizes annual sessions on research processes related to theories, tools and data visualization strategies to improve their understanding and to use them for the general good.
Evento
On the occasion of the International Open Data Conference and included on the agenda of events before IODC 2016, the Open Cities Summit will take place on 5th October at Media-Lab Prado in Madrid.
This meeting will bring together international open data practitioners in order to show how open data is being used around the world to improve the lives of citizens at the city level, facilitate knowledge exchange around open cities, and ideate solutions to overcome identified challenges in creating open cities as regards four areas: management of an open data policy, urban planning, environment and competitiveness.
The Open Cities Summit is aimed at civil servants, journalists, civil society organizations, researchers and any citizen who believes in the potential of open data to improve the environments in which they live. Thus, the event will consist of workshops, lectures and round tables, which will be structured in three parts. Firstly, the experts will share policies of their open data cities and show how their open data policies are helping improve the lives of citizens. Secondly, participants will be working in groups to ideate solutions to overcome the four different challenges mentioned above and finally, there will be open space to discuss the challenges and opportunities of creating an open city.

The organizing committee has opened a Call for Actions for open data practitioners who can submit initiatives in the field, especially those that offer an answer to the problems of urban development, environment, competitiveness and management of open data policies. The aim is capture a representative sample of best practices and to enrich the debate on the potential of open data for subnational governments. The deadline for the proposals is 15th August.