Documentación
Data sharing has become a critical pillar for the advancement of analytics and knowledge exchange, both in the private and public sectors. Organizations of all sizes and industries—companies, public administrations, research institutions, developer communities, and individuals—find strong value in the ability to share information securely, reliably, and efficiently.
This exchange goes beyond raw data or structured datasets. It also includes more advanced data products such as trained machine learning models, analytical dashboards, scientific experiment results, and other complex artifacts that have significant impact through reuse. In this context, the governance of these resources becomes essential. It is not enough to simply move files from one location to another; it is necessary to guarantee key aspects such as access control (who can read or modify a given resource), traceability and auditing (who accessed it, when, and for what purpose), and compliance with regulations or standards, especially in enterprise and governmental environments.
To address these requirements, Unity Catalog emerges as a next-generation metastore, designed to centralize and simplify the governance of data and data-related resources. Originally part of the services offered by the Databricks platform, the project has now transitioned into the open source community, becoming a reference standard. This means that it can now be freely used, modified, and extended, enabling collaborative development. As a result, more organizations are expected to adopt its cataloging and sharing model, promoting data reuse and the creation of analytical workflows and technological innovation.

Figure 1. Image. Source: https://docs.unitycatalog.io/
Access the data lab repository on Github.
Run the data preprocessing code on Google Colab
Objectives
In this exercise, we will learn how to configure Unity Catalog, a tool that helps us organize and share data securely in the cloud. Although we will use some code, each step will be explained clearly so that even those with limited programming experience can follow along through a hands-on lab.
We will work with a realistic scenario in which we manage public transportation data from different cities. We’ll create data catalogs, configure a database, and learn how to interact with the information using tools like Docker, Apache Spark, and MLflow.
Difficulty level: Intermediate.

Figure 2: Unity catalogue schematic
Required Resources
In this section, we’ll explain the prerequisites and resources needed to complete this lab. The lab is designed to be run on a standard personal computer (Windows, macOS, or Linux).
We will be using the following tools and environments:
- Docker Desktop: Docker allows us to run applications in isolated environments called containers. A container is like a "box" that includes everything needed for the application to run properly, regardless of the operating system.
- Visual Studio Code: Our main working environment will be a Python Notebook, which we will run and edit using the widely adopted code editor Visual Studio Code (VS Code).
- Unity Catalog: Unity Catalog is a data governance tool that allows us to organize and control access to resources such as tables, data volumes, functions, and machine learning models. In this lab, we will use its open source version, which can be deployed locally, to learn how to manage data catalogs with permission control, traceability, and hierarchical structure. Unity Catalog acts as a centralized metastore, making data collaboration and reuse more secure and efficient.
- Amazon Web Services (AWS): AWS will serve as our cloud provider to host some of the lab’s data—specifically, raw data files (such as JSON) that we will manage using data volumes. We’ll use the Amazon S3 service to store these files and configure the necessary credentials and permissions so that Unity Catalog can interact with them in a controlled manner
Key Learnings from the Lab
Throughout this hands-on exercise, participants will deploy the application, understand its architecture, and progressively build a data catalog while applying best practices in organization, access control, and data traceability.
Deployment and First Steps
-
We clone the Unity Catalog repository and launch it using Docker.
-
We explore its architecture: a backend accessible via API and CLI, and an intuitive graphical user interface.
- We navigate the core resources managed by Unity Catalog: catalogs, schemas, tables, volumes, functions, and models.
Figure 2. Screenshot
What Will We Learn Here?
How to launch theapplication, understand its core components, and start interacting with it through different interfaces: the web UI, API, and CLI.
Resource Organization
-
We configure an external MySQL database as the metadata repository.
-
We create catalogs to represent different cities and schemas for various public services.

Figure 3. Screenshot
What Will We Learn Here?
How to structure data governance at different levels (city, service, dataset) and manage metadata in a centralized and persistent way.
Data Construction and Real-World Usage
-
We create structured tables to represent routes, buses, and bus stops.
-
We load real data into these tables using PySpark.
-
We set up an AWS S3 bucket as raw data storage (volumes).
- We upload JSON telemetry event files and govern them from Unity Catalog.
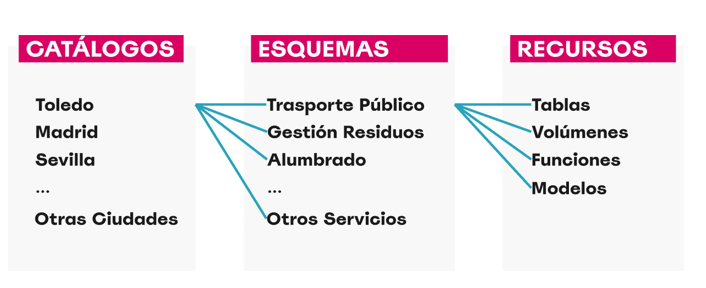
Figure 4. Diagram
What Will We Learn Here?
How to work with different types of data (structured and unstructured), and how to integrate them with external sources like AWS S3.
Reusable Functions and AI Models
-
We register custom functions (e.g., distance calculation) directly in the catalog.
-
We create and register machine learning models using MLflow.
- We run predictions from Unity Catalog just like any other governed resource.
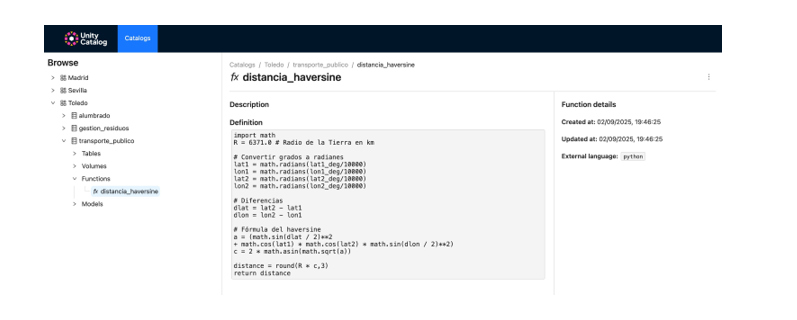
Figure 5. Screenshot
What Will We Learn Here?
How to extend data governance to functions and models, and how to enable their reuse and traceability in collaborative environments.
Results and Conclusions
As a result of this hands-on lab, we gained practical experience with Unity Catalog as an open platform for the governance of data and data-related resources, including machine learning models. We explored its capabilities, deployment model, and usage through a realistic use case and a tool ecosystem similar to what you might find in an actual organization.
Through this exercise, we configured and used Unity Catalog to organize public transportation data. Specifically, you will be able to:
- Learn how to install tools like Docker and Spark.
- Create catalogs, schemas, and tables in Unity Catalog.
- Load data and store it in an Amazon S3 bucket.
- Implement a machine learning model using MLflow.
In the coming years, we will see whether tools like Unity Catalog achieve the level of standardization needed to transform how data resources are managed and shared across industries.
We encourage you to keep exploring data science! Access the full repository here
Content prepared by Juan Benavente, senior industrial engineer and expert in technologies linked to the data economy. The contents and points of view reflected in this publication are the sole responsibility of the author.
Documentación
In the current landscape of data analysis and artificial intelligence, the automatic generation of comprehensive and coherent reports represents a significant challenge. While traditional tools allow for data visualization or generating isolated statistics, there is a need for systems that can investigate a topic in depth, gather information from diverse sources, and synthesize findings into a structured and coherent report.
In this practical exercise, we will explore the development of a report generation agent based on LangGraph and artificial intelligence. Unlike traditional approaches based on templates or predefined statistical analysis, our solution leverages the latest advances in language models to:
- Create virtual teams of analysts specialized in different aspects of a topic.
- Conduct simulated interviews to gather detailed information.
- Synthesize the findings into a coherent and well-structured report.
Access the data laboratory repository on Github.
Run the data preprocessing code on Google Colab.
As shown in Figure 1, the complete agent flow follows a logical sequence that goes from the initial generation of questions to the final drafting of the report.

Figure 1. Agent flow diagram.
Application Architecture
The core of the application is based on a modular design implemented as an interconnected state graph, where each module represents a specific functionality in the report generation process. This structure allows for a flexible workflow, recursive when necessary, and with capacity for human intervention at strategic points.
Main Components
The system consists of three fundamental modules that work together:
1. Virtual Analysts Generator
This component creates a diverse team of virtual analysts specialized in different aspects of the topic to be investigated. The flow includes:
- Initial creation of profiles based on the research topic.
- Human feedback point that allows reviewing and refining the generated profiles.
- Optional regeneration of analysts incorporating suggestions.
This approach ensures that the final report includes diverse and complementary perspectives, enriching the analysis.
2. Interview System
Once the analysts are generated, each one participates in a simulated interview process that includes:
- Generation of relevant questions based on the analyst's profile.
- Information search in sources via Tavily Search and Wikipedia.
- Generation of informative responses combining the obtained information.
- Automatic decision on whether to continue or end the interview based on the information gathered.
- Storage of the transcript for subsequent processing.
The interview system represents the heart of the agent, where the information that will nourish the final report is obtained. As shown in Figure 2, this process can be monitored in real time through LangSmith, an open observability tool that allows tracking each step of the flow.

Figure 2. System monitoring via LangGraph. Concrete example of an analyst-interviewer interaction.
3. Report Generator
Finally, the system processes the interviews to create a coherent report through:
- Writing individual sections based on each interview.
- Creating an introduction that presents the topic and structure of the report.
- Organizing the main content that integrates all sections.
- Generating a conclusion that synthesizes the main findings.
- Consolidating all sources used.
The Figure 3 shows an example of the report resulting from the complete process, demonstrating the quality and structure of the final document generated automatically.

Figure 3. View of the report resulting from the automatic generation process to the prompt "Open data in Spain".
What can you learn?
This practical exercise allows you to learn:
Integration of advanced AI in information processing systems:
- How to communicate effectively with language models.
- Techniques to structure prompts that generate coherent and useful responses.
- Strategies to simulate virtual teams of experts.
Development with LangGraph:
- Creation of state graphs to model complex flows.
- Implementation of conditional decision points.
- Design of systems with human intervention at strategic points.
Parallel processing with LLMs:
- Parallelization techniques for tasks with language models.
- Coordination of multiple independent subprocesses.
- Methods for consolidating scattered information.
Good design practices:
- Modular structuring of complex systems.
- Error handling and retries.
- Tracking and debugging workflows through LangSmith.
Conclusions and future
This exercise demonstrates the extraordinary potential of artificial intelligence as a bridge between data and end users. Through the practical case developed, we can observe how the combination of advanced language models with flexible architectures based on graphs opens new possibilities for automatic report generation.
The ability to simulate virtual expert teams, perform parallel research and synthesize findings into coherent documents, represents a significant step towards the democratization of analysis of complex information.
For those interested in expanding the capabilities of the system, there are multiple promising directions for its evolution:
- Incorporation of automatic data verification mechanisms to ensure accuracy.
- Implementation of multimodal capabilities that allow incorporating images and visualizations.
- Integration with more sources of information and knowledge bases.
- Development of more intuitive user interfaces for human intervention.
- Expansion to specialized domains such as medicine, law or sciences.
In summary, this exercise not only demonstrates the feasibility of automating the generation of complex reports through artificial intelligence, but also points to a promising path towards a future where deep analysis of any topic is within everyone's reach, regardless of their level of technical experience. The combination of advanced language models, graph architectures and parallelization techniques opens a range of possibilities to transform the way we generate and consume information.
Blog
The increasing complexity of machine learning models and the need to optimise their performance has been driving the development of AutoML (Automated Machine Learning) for years. This discipline seeks to automate key tasks in the model development lifecycle, such as algorithm selection, data processing and hyperparameter optimisation.
AutoML allows users to develop models more easily and quickly. It is an approach that facilitates access to the discipline, making it accessible to professionals with less programming experience and speeding up processes for those with more experience. Thus, for a user with in-depth programming knowledge, AutoML can also be of interest. Thanks to auto machine learning, this user could automatically apply the necessary technical settings, such as defining variables or interpreting the results in a more agile way.
In this post, we will discuss the keys to these automation processes and compile a series of free and/or freemium open source tools that can help you to deepen your knowledge of AutoML.
Learn how to create your own machine learning modeling
As indicated above, thanks to automation, the training and evaluation process of models based on AutoML tools is faster than in a usual machine learning (ML) process, although the stages for model creation are similar.
In general, the key components of AutoML are:
- Data processing: automates tasks such as data cleaning, transformation and feature selection.
- Model selection: examines a variety of machine learning algorithms and chooses the most appropriate one for the specific task.
- Hyperparameter optimisation: automatically adjusts model parameters to improve model performance.
- Model evaluation: provides performance metrics and validates models using techniques such as cross-validation.
- Implementation and maintenance: facilitates the implementation of models in production and, in some cases, their upgrade.
All these elements together offer a number of advantages as shown in the picture below
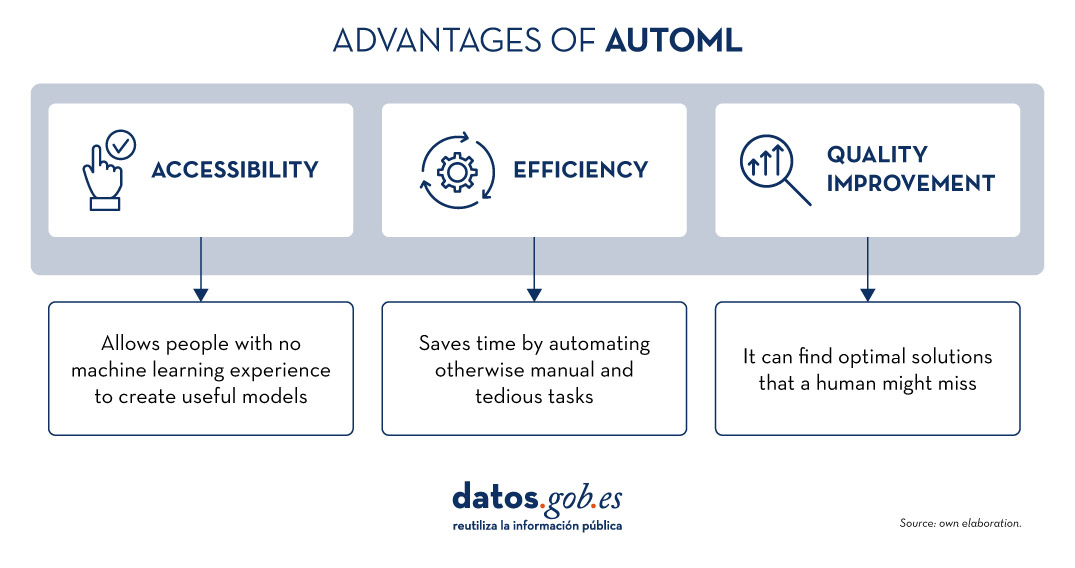
Figure 1. Source: Own elaboration
Examples of AutoML tools
Although AutoML can be very useful, it is important to highlight some of its limitations such as the risk of overfitting (when the model fits too closely to the training data and does not generalise knowledge well), the loss of control over the modelling process or the interpretability of certain results.
However, as AutoML continues to gain ground in the field of machine learning, a number of tools have emerged to facilitate its implementation and use. In the following, we will explore some of the most prominent open source AutoML tools:
H2O.ai, versatile and scalable, ideal for enterprises
H2O.ai is an AutoML platform that includes deep learning and machine learning models such as XGBoost (machine learning library designed to improve model efficiency) and a graphical user interface. This tool is used in large-scale projects and allows a high level of customisation. H2O.ai includes options for classification, regression and time series models, and stands out for its ability to handle large volumes of data.
Although H2O makes machine learning accessible to non-experts, some knowledge and experience in data science is necessary to get the most out of the tool. In addition, it enables a large number of modelling tasks that would normally require many lines of code, making it easier for the data analyst. H2O offers a freemium model and also has an open source community version.
TPOT, based on genetic algorithms, good option for experimentation
TPOT (Tree-based Pipeline Optimization Tool) is a free and open source Python machine learning tool that optimises processes through genetic programming.
This solution looks for the best combination of data pre-processing and machine learning models for a specific dataset. To do so, it uses genetic algorithms that allow it to explore and optimise different pipelines, data transformation and models. This is a more experimental option that may be less intuitive, but offers innovative solutions.
In addition, TPOT is built on top of the popular scikit-learn library, so models generated by TPOT can be used and adjusted with the same techniques that would be used in scikit-learn..
Auto-sklearn, accessible to scikit-learn users and efficient on structured problems
Like TPOT, Auto-sklearn is based on scikit-learn and serves to automate algorithm selection and hyperparameter optimisation in machine learning models in Python.
In addition to being a free and open source option, it includes techniques for handling missing data, a very useful feature when working with real-world datasets. On the other hand, Auto-sklearn offers a simple and easy-to-use API, allowing users to start the modelling process with few lines of code..
BigML, integration via REST APIs and flexible pricing models
BigML is a consumable, programmable and scalable machine learning platform that, like the other tools mentioned above, facilitates the resolution and automation of classification, regression, time series forecasting, cluster analysis, anomaly detection, association discovery and topic modelling tasks. It features an intuitive interface and a focus on visualisation that makes it easy to create and manage ML models, even for users with little programming knowledge.
In addition, BigML has a REST API that enables integration with various applications and languages, and is scalable to handle large volumes of data. On the other hand, it offers a flexible pricing model based on usage, and has an active community that regularly updates the learning resources available.
The following table shows a comparison between these tools:
| H2O.ai | TPOT | Auto-sklearn | BigML | |
|---|---|---|---|---|
| Use | For large-scale projects. | To experiment with genetic algorithms and optimise pipelines. | For users of scikit-learn who want to automate the model selection process and for structured tasks. | To create and deploy ML models in an accessible and simple way. |
| Difficult to configure | Simple, with advanced options. | Medium difficulty. A more technical option by genetic algorithms. | Medium difficulty. It requires technical configuration, but is easy for scikit-learn users. | Simple Intuitive interface with customisation options. |
| Ease of use | Easy to use with the most common programming languages. It has a graphical interface and APIs for R and Python. | Easy to use, but requires knowledge of Python. | Easy to use, but requires prior knowledge. Easy option for scikit-learn users. | Easy to use, focused on visualisation, no programming skills required. |
| Scalability | Scalable to large volumes of data. | Focus on small and medium-sized datasets. Less efficient on large datasets | Effective on small and medium sized datasets. | Scalable for different sizes of datasets. |
| Interoperability | Compatible with several libraries and languages, such as Java, Scala, Python and R. | Based on Python. | Based on Python integrating scikit-learn. | Compatible with REST APIs and various languages. |
| Community | Extensive and active sharing of reference documentation. | Less extensive, but growing. | It is supported by the scikit-learn community. | Active community and support available. |
| Disadvantages | Although versatile, its advanced customisation could be challenging for beginners without technical experience. | May be less efficient on large data sets due to the intensive nature of genetic algorithms. | Its performance is optimised for structured tasks (structured data), which may limit its use for other types of problems. | Its advanced customisation could be challenging for beginners without technical experience |
Figure 2. Comparative table of autoML tools. Source: Own elaboration
Each tool has its own value proposition, and the choice will depend on the specific needs and environment in which the user works.
Here are some examples of free and open source tools that you can explore to get into AutoML. We invite you to share your experience with these or other tools in the comments section below.
If you are looking for tools to help you in data processing, from datos.gob.es we offer you the report "Tools for data processing and visualisation", as well as the following monographic articles:.
Blog
As we do every year, the datos.gob.es team wishes you happy holidays. If this Christmas you feel like giving or giving yourself a gift of knowledge, we bring you our traditional Christmas letter with ideas to ask Father Christmas or the Three Wise Men.
We have a selection of books on a variety of topics such as data protection, new developments in AI or the great scientific discoveries of the 20th century. All these recommendations, ranging from essays to novels, will be a sure hit to put under the tree.
Maniac by Benjamin Labatut.
- What is it about? Guided by the figure of John von Neumann, one of the great geniuses of the 20th century, the book covers topics such as the creation of atomic bombs, the Cold War, the birth of the digital universe and the rise of artificial intelligence. The story begins with the tragic suicide of Paul Ehrenfest and progresses through the life of von Neumann, who foreshadowed the arrival of a technological singularity. The book culminates in a confrontation between man and machine in an epic showdown in the game of Go, which serves as a warning about the future of humanity and its creations.
- Who is it aimed at? This science fiction novel is aimed at anyone interested in the history of science, technology and its philosophical and social implications. Es ideal para quienes disfrutan de narrativas que combinan el thriller con profundas reflexiones sobre el futuro de la humanidad y el avance tecnológico. It is also suitable for those looking for a literary work that delves into the limits of thought, reason and artificial intelligence.
Take control of your data, by Alicia Asin.
- What is it about? This book compiles resources to better understand the digital environment in which we live, using practical examples and clear definitions that make it easier for anyone to understand how technologies affect our personal and social lives. It also invites us to be more aware of the consequences of the indiscriminate use of our data, from the digital trail we leave behind or the management of our privacy on social networks, to trading on the dark web. It also warns about the legitimate but sometimes invasive use of our online behaviour by many companies.
- Who is it aimed at? The author of this book is CEO of the data reuse company Libelium who participated in one of our Encuentros Aporta and is a leading expert on privacy, appropriate use of data and data spaces, among others. In this book, the author offers a business perspective through a work aimed at the general public.
Governance, management and quality of artificial intelligence by Mario Geraldo Piattini.
- What is it about? Artificial intelligence is increasingly present in our daily lives and in the digital transformation of companies and public bodies, offering both benefits and potential risks. In order to benefit properly from the advantages of AI and avoid problems it is very important to have ethical, legal and responsible systems in place. This book provides an overview of the main standards and tools for managing and assuring the quality of intelligent systems. To this end, it provides clear examples of best available practices.
- Who is it aimed at? Although anyone can read it, the book provides tools to help companies meet the challenges of AI by creating systems that respect ethical principles and align with engineering best practices.
Nexus, by Yuval Noah.
- What is it about? In this new installment, one of the most fashionable writers analyzes how information networks have shaped human history, from the Stone Age to the present era. This essay explores the relationship between information, truth, bureaucracy, mythology, wisdom and power, and how different societies have used information to impose order, with both positive and negative consequences. In this context, the author discusses the urgent decisions we must make in the face of current threats, such as the impact of non-human intelligence on our existence.
- Who is it aimed at? It is a mainstream work, i.e. anyone can read it and will most likely enjoy reading it. It is a particularly attractive option for readers seeking to reflect on the role of information in modern society and its implications for the future of humanity, in a context where emerging technologies such as artificial intelligence are challenging our way of life.
Generative Deep Learning: Teaching Machines to Paint, Write, Compose, and Play by David Foster (second edition 2024)
- What is it about? This practical book dives into the fascinating world of generative deep learning, exploring how machines can create art, music and text. Throughout, Foster guides us through the most innovative architectures such as VAEs, GANs and broadcasting models, explaining how these technologies can transform photographs, generate music and even write text. The book starts with the basics of deep learning and progresses to cutting-edge applications, including image creation with Stable Diffusion, text generation with GPT and music composition with MuSEGAN. It is a work that combines technical rigour with artistic creativity.
- Who is it aimed at? This technical manual is intended for machine learning engineers, data scientists and developers who want to enter the field of generative deep learning. It is ideal for those who already have a background in programming and machine learning, and wish to explore how machines can create original content. It will also be valuable for creative professionals interested in understanding how AI can amplify their artistic capabilities. The book strikes the perfect balance between mathematical theory and practical implementation, making complex concepts accessible through concrete examples and working code.
Information is beautiful, by David McCandless.
- What is it about? Esta guía visual en inglés nos ayuda a entender cómo funciona el mundo a través de impactantes infografías y visualizaciones de datos. This new edition has been completely revised, with more than 20 updates and 20 new visualisations. It presents information in a way that is easy to skim, but also invites further exploration.
- Who is it aimed at? This book is aimed at anyone interested in seeing and understanding information in a different way. It is perfect for those looking for an innovative and visually appealing way to understand the world around us. It is also ideal for those who enjoy exploring data, facts and their interrelationships in an entertaining and accessible way.
Collecting Field Data with QGIS and Mergin Maps, de Kurt Menke y Alexandra Bucha Rasova.
- What is it about? This book teaches you how to master the Mergin Maps platform for collecting, sharing and managing field data using QGIS. The book covers everything from the basics, such as setting up projects in QGIS and conducting field surveys, to advanced workflows for customising projects and managing collaborations. In addition, details on how to create maps, set up survey layers and work with smart forms for data collection are included.
- Who is it aimed at? Although it is a somewhat more technical option than the previous proposals, the book is aimed at new users of Mergin Maps and QGIS. It is also useful for those who are already familiar with these tools and are looking for more advanced workflows.
A terrible greenery by Benjamin Labatut.
- What is it about? This book is a fascinating blend of science and literature, narrating scientific discoveries and their implications, both positive and negative. Through powerful stories, such as the creation of Prussian blue and its connection to chemical warfare, the mathematical explorations of Grothendieck and the struggle between scientists like Schrödinger and Heisenberg, the author, Benjamin Labatut, leads us to explore the limits of science, the follies of knowledge and the unintended consequences of scientific breakthroughs. The work turns science into literature, presenting scientists as complex and human characters.
- Who is it aimed at? The book is aimed at a general audience interested in science, the history of discoveries and the human stories behind them, with a focus on those seeking a literary and in-depth approach to scientific topics. It is ideal for those who enjoy works that explore the complexity of knowledge and its effects on the world.
Designing Better Maps: A Guide for GIS Users, de Cynthia A. Brewer.
- What is it about? It is a guide in English written by the expert cartographer that teaches how to create successful maps using any GIS or illustration tool. Through its 400 full-colour illustrations, the book covers the best cartographic design practices applied to both reference and statistical maps. Topics include map planning, using base maps, managing scale and time, explaining maps, publishing and sharing, using typography and labels, understanding and using colour, and customising symbols.
- Who is it aimed at? This book is intended for all geographic information systems (GIS) users, from beginners to advanced cartographers, who wish to improve their map design skills.
Although in the post we link many purchase links. If you are interested in any of these options, we encourage you to ask your local bookshop to support small businesses during the festive season. Do you know of any other interesting titles? Write it in comments or send it to dinamizacion@datos.gob.es. We read you!
Evento
There is never an end to opportunities to discuss, learn and share experiences on open data and related technologies. In this post, we select some of the upcoming ones, and tell you everything you need to know: what it's about, when and where it takes place and how you can register.
Don't miss this selection of events on cutting-edge topics such as geospatial data, accessible data reuse strategies and even innovative trends in data journalism. the best thing? All are free of charge.
Let's talk about data in Alicante
The National Association of Big Data and Analytics (ANBAN) is organising an open and free event in Alicante to debate and exchange views on data and artificial intelligence. During the meeting, not only will use cases that relate data with AI be presented, but also a part of the event will be dedicated to encourage networking among the attendees.
- What is it about? let's talk about data' will start with two talks on artificial intelligence projects that are already making an impact. Afterwards, the course on AI organised by the University of Alicante together with ANBAN will be explained. The final part of the event will be more relaxed to encourage attendees to make valuable connections.
- When and where? Thursday 29 February at 20.30h at ULAB (Pza. San Cristóbal, 14) in Alicante.
- How do I register? Book your place by signing up here: https://www.eventbrite.es/e/entradas-hablemos-del-dato-beers-alicante-823931670807?aff=oddtdtcreator&utm_source=rrss&utm_medium=colaborador&utm_campaign=HDD-ALC-2902
Open Data Day in Barcelona: Re-using data to improve the city
Open Data Day is an international event that brings together open data activities around the world. Within this framework, the barcelona Open Data initiative initiative has organised an event to discuss projects and strategies for the publication and reuse of open data to make a clean, safe, friendly and accessible city possible.
- What is it about? Through open data projects and data-driven strategies, the challenge of security, coexistence of uses and maintenance of shared spaces in municipalities will be addressed. The aim is to generate dialogue between organisations that publish and reuse data to add value and develop strategies together.
- When and where? On 6 March from 5 to 7.30 p.m. at Ca l'Alier (C/ de Pere IV, 362).
- How do I register? Through this link: https://www.eventbrite.es/e/entradas-open-data-day-2024-819879711287?aff=oddtdtcreator
Presentation of the "Good Practice Guide for Data Journalists"
The Valencian Observatory of Open Data and Transparency of the Universitat Politècnica de València has created a guide for journalists and data professionals with practical advice on how to turn data into attractive and relevant journalistic stories for society. The author of this reference material will talk to a data journalist about the challenges and opportunities that data offers in journalism.
- What is it about? It is an event that will address key concepts of the Good Practice Guide for Data Journalists through practical examples and cases to analyse and visualise data correctly. Ethics will also be a theme of the presentation.
- When and where? Friday 8th March from 12h to 13h in the Assembly Hall of the Faculty of ADE of the UPV (Avda. Tarongers s/n) in Valencia.
- How do I register? More information and registration here: https://www.eventbrite.es/e/entradas-presentacion-de-la-guia-de-buenas-practicas-para-periodistas-de-datos-835947741197
Geodata Conference of the Madrid City Council Geoportal
Madrid hosts the sixth edition of this event which brings together heads of institutions and benchmark companies in cartography, geographic information systems, digital twin, BIM, Big Data and artificial intelligence. The event will also be used as an opportunity to award the prizes of the Geodata Stand.
- What is it about? Followingin the footsteps of previous years, the Madrid Geodata Conference will present case studies and new developments in cartography, digital twinning, reuse of georeferenced data, as well as the best papers presented at the Geodata Stand.
- When and where? The event starts on 12 March at 9am in the Auditorio de La Nave in Madrid and will last until 2pm. The following day, 13 March, the session will be virtual and will present the projects and new developments in geo-information production and distribution via the Madrid Geoportal.
- How do I register? Through the event portal. Places are limited https://geojornadas.madrid.es/
3rd URJC Free Culture Conference
The Free Culture Conference of the Universidad Rey Juan Carlos is a meeting point, learning and exchange of experiences about free culture in the university. Topics such as open publishing of teaching and research materials, open science, open data, and free software will be addressed.
- What is it about? The two-day event will feature presentations by experts, workshops on specific topics and an opportunity for the university community to present papers. In addition, there will be an exhibition space where tools and news related to culture and free software will be shared, as well as a poster exhibition area
- When and where? 20 and 21 March at the Fuenlabrada Campus of the URJC
- How do I register? Registration is free of charge via this link: https://eventos.urjc.es/109643/tickets/iii-jornadas-de-cultura-libre-de-la-urjc.html
These are some of the upcoming events. In any case, don't forget to follow us on social media so you don't miss any news about innovation and open data. We are on Twitter y LinkedIn you can also write to us at dinamizacion@datos.gob.es if you would like us to add another event to the list or if you need extra information.
Blog
2023 was a year full of new developments in artificial intelligence, algorithms and data-related technologies. Therefore, these Christmas holidays are a good time to take advantage of the arrival of the Three Wise Men and ask them for a book to enjoy reading during the holidays, the well-deserved rest and the return to routine after the holiday period.
Whether you are looking for a reading that will improve your professional profile, learn about new technological developments and applications linked to the world of data and artificial intelligence, or if you want to offer your loved ones a didactic and interesting gift, from datos.gob.es we want to offer you some examples. For the elaboration of the list we have counted on the opinion of experts in the field.
Take paper and pencil because you still have time to include them in your letter to the Three Wise Men!
1. Inteligencia Artificial: Ficción, Realidad y... sueños, Nuria Oliver, Real Academia de Ingeniería GTT (2023)
What it’s about: The book has its origin in the author's acceptance speech to the Royal Academy of Engineering. In it, she explores the history of AI, its implications and development, describes its current impact and raises several perspectives.
Who should read it: It is designed for people interested in entering the world of Artificial Intelligence, its history and practical applications. It is also aimed at those who want to enter the world of ethical AI and learn how to use it for social good.
2. A Data-Driven Company. 21 Claves para crear valor a través de los datos y de la Inteligencia Artificial, Richard Benjamins, Lid Editorial (2022)
What it's about: A Data-Driven Company looks at 21 key decisions companies need to face in order to become a data-driven, AI-driven enterprise. It addresses the typical organizational, technological, business, personnel, business, and ethical decisions that organizations must face to start making data-driven decisions, including how to fund their data strategy, organize teams, measure results, and scale.
Who should read it: It is suitable for professionals who are just starting to work with data, as well as for those who already have experience, but need to adapt to work with big data, analytics or artificial intelligence.
3. Digital Empires: The Global Battle to Regulate Technology, Anu Bradford, OUP USA (2023)
What it's about: In the face of technological advances around the world and the arrival of corporate giants spread across international powers, Bradford examines three competing regulatory approaches: the market-driven U.S. model, the state-driven Chinese model, and the rights-based European regulatory model. It examines how governments and technology companies navigate the inevitable conflicts that arise when these regulatory approaches clash internationally.
Who should read it: This is a book for those who want to learn more about the regulatory approach to technologies around the world and how it affects business. It is written in a clear and understandable way, despite the complexity of the subject. However, the reader will need to know English, because it has not yet been translated into Spanish.
4. El mito del algoritmo, Richard Benjamins e Idoia Salazar, Anaya Multimedia (2020)
What it's about: Artificial intelligence and its exponential use in multiple disciplines is causing an unprecedented social change. With it, philosophical thoughts as deep as the existence of the soul or debates related to the possibility of machines having feelings are beginning to emerge. This is a book to learn about the challenges, challenges and opportunities of this technology.
Who should read it: It is aimed at people with an interest in the philosophy of technology and the development of technological advances. By using simple and enlightening language, it is a book within the reach of a general public.
5. ¿Cómo sobrevivir a la incertidumbre?, de Anabel Forte Deltell, Next Door Publishers
What it is about: It explains in a simple way and with examples how statistics and probability are more present in daily life. The book starts from the present day, in which data, numbers, percentages and graphs have taken over our daily lives and have become indispensable for making decisions or for understanding the world around us.
Who should read it: A general public that wants to understand how the analysis of data, statistics and probability are shaping a large part of political, social, economic and social decisions?
6. Análisis espacial con R: Usa R como un Sistema de Información Geográfica, Jean François Mas, European Scientific Institute
What it is about: This is a more technical book, which provides a brief introduction to the main concepts for handling the R programming language and environment (types of objects and basic operations) and then introduces the reader to the use of the sf library or package for spatial data in vector format through its main functions for reading, writing and analysis. The book approaches, from a practical and applicative perspective with an easy-to-understand language, the first steps to get started with the use of R in spatial analysis applications; for this, it is necessary that users have basic knowledge of Geographic Information Systems.
Who should read it: A public with some knowledge of R and basic knowledge of GIS who wish to enter the world of spatial analysis applications.
This is just a small sample of the great variety of existing literature related to the world of data. We are sure that we have left some interesting book without including it, so if you have any extra recommendation you would like to make, do not hesitate to leave us your favorite title in the comments. Those of us on the datos.gob.es team would be delighted to read your recommendations.
Evento
We live in an era in which training has become an essential element, both to enter and to progress in an increasingly competitive labour market, as well as to be part of research projects that can lead to great improvements in our lifetime.
Summer is coming and with it, a renewed training offer that does not rest at all in the summer season, but quite the opposite. Every year, the number of courses related to data science, analytics or open data increases. The current labour market demands and requires professionals specialized in these technological fields, as reflected by the EC in its European Data Strategy, where it is highlighted that the EU will provide financing "to expand the digital talent pool with in the order of 250000 people who will be able to deploy the latest technologies in businesses throughout the EU”.
In this sense, the possibilities offered by new technologies to carry out any type of online training, from your own home with the maximum guarantees, help more professionals to use this type of course each year.
From datos.gob.es we have selected a series of online courses, both free and paid, related to data that may be of interest to you:
- We started with the Machine Learning and Data Science Course taught by the Polytechnic University of Valencia, which stands out for offering its future students the learning necessary to extract technical knowledge from the data. With a 5-week program, this course introduce R language and, among other things, different preprocessing techniques and data visualization.
- The Modern Methods in Data Analytics course is another option if you are looking to expand your data training and learn English at the same time. The University of Utrecht will begin to teach this course completely online from August 31, totally focused on the study of linear models and longitudinal data analysis, among other fields.
- Another of the English courses that will begin on June 16 is a 9-week training programme focused on Data Analytics and which is taught by the Ironhack International School. This is a recommended course for those who want to learn how to load, clean, explore and extract information from a wide range of datasets, as well as how to use Python, SQL and Tableau, among other aspects.
- Next we discover the course on Business Digitization and Big Data: Data, Information and Knowledge in Highly Competitive Markets, taught by FGUMA (General Foundation of the University of Malaga). Its duration is 25 hours and its registration deadline is June 15. If you are a professional related to business management and / or entrepreneurship, this course will surely be of interest to you.
- R for Data Science is another course offered by the FGUMA. Its main objective is to show an introductory view to the R programming language for data analysis tasks, including advanced reports and visualizations, presenting techniques typical of computer learning as an extra value. As with the previous course, the deadline for registration for this training is June 15.
- For its part, Google Cloud offers a completely online and free learning path for data professionals seeking to perfect the design, complication, analysis and optimization of macrodata solutions. Surely this Specialized program: Data Engineering, Big Data, and Machine Learning on GCP fits into the training you had planned.
In addition to these specific courses, it is worth noting the existence of online training platforms that offer courses related to new technologies on an ongoing basis. These courses are known as MOOC and are an alternative to traditional training, in areas such as Machine Learning, Data Analytics, Business Intelligence or Deep Learning, knowledge that is increasingly demanded by companies.
This is just a selection of the many courses that exist as data related training offerings. However, we would love to count on your collaboration by sending us, through the comments, other courses of interest in the field of data to complete this list in the future.