Blog
In a world increasingly exposed to natural hazards and humanitarian crises, accurate and up-to-date geospatial data can make the difference between effective response and delayed reaction. The building footprints, i.e. the contours of buildings as they appear on the ground, are one of the most valuable resources in emergency contexts.
In this post we will delve deeper into this concept, including where to obtain open building footprint data, and highlight its importance in one of its many use cases: emergency management.
What are buildings footprints
The building footprints are geospatial representations, usually in vector format, showing the outline of structures built on the ground. That is, they indicate the horizontal projection of a building on the ground, viewed from above, as if it were a floor plan.
These footprints can include residential buildings as well as industrial, commercial, institutional or even rural buildings. Depending on the data source, they may be accompanied by additional attributes such as height, number of floors, building use or date of construction, making them a rich source of information for multiple disciplines.
Unlike an architectural plan showing internal details, building footprints are limited to the perimeter of the building in contact with the ground. This simplicity makes them lightweight, interoperable and easily combined with other geographic information layers, such as road networks, risk areas, critical infrastructures or socio-demographic data.
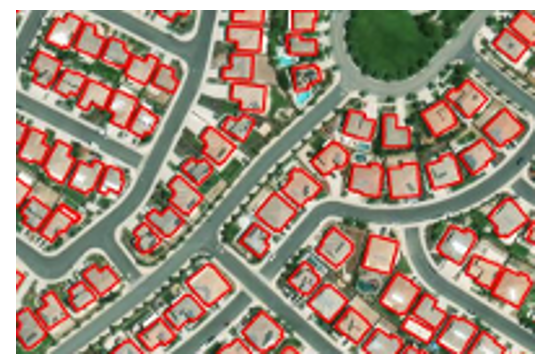
Figure 1. Example of building footprints: each polygon represents the outline of a building as seen from above.
How are they obtained?
There are several ways to generate building footprints:
- From satellite or aerial imagery: using photo-interpretation techniques or, more recently, artificial intelligence and machine learning algorithms.
- With cadastral data or official registers: as in the case of the Cadastre in Spain, which maintains precise vector bases of all registered constructions.
- By collaborative mapping: platforms such as OpenStreetMap (OSM) allow volunteer users to manually digitise visible footprints on orthophotos.
What are they for?
Building footprints are essential for:
- Urban and territorial analysis: allow the study of built density, urban sprawl or land use.
- Cadastral and real estate management: are key to calculating surface areas, applying taxes or regulating buildings.
- Planning of infrastructures and public services: they help to locate facilities, design transport networks or estimate energy demand.
- 3D modelling and smart cities: serve as a basis for generating three-dimensional urban models.
- Risk and emergency management: to identify vulnerable areas, estimate affected populations or plan evacuations.
In short, building footprints are a basic piece of the spatial data infrastructure and, when offered as open, accessible and up-to-date data, they multiply their value and usefulness for society as a whole.
Why are they key in emergency situations?
Of all the possible use cases, in this article we will focus on emergency management. During such a situation - such as an earthquake, flood or wildfire - responders need to know which areas are built-up, how many people can inhabit those structures, how to access them and where to concentrate resources. The building footprints allow:
- Rapidly estimate the number of people potentially affected.
- Prioritise intervention and rescue areas.
- Plan access and evacuation routes.
- Cross-reference data with other layers (social vulnerability, risk areas, etc.).
- Coordinate action between emergency services, local authorities and international cooperation.
Open data available
In an emergency, it is essential to know where to locate building footprint data. One of the most relevant developments in the field of data governance is the increasing availability of building footprints as open data. This type of information, previously restricted to administrations or specialised agencies, can now be freely used by local governments, NGOs, researchers and businesses.
Some of the main sources available for emergency management and other purposes are summarised below:
- JRC - Global Human Settlement Layer (GHSL): the Joint Research Centre of the European Commission offers a number of products derived from satellite imagery analysis:
- GHS-BUILT-S: raster data on global built-up areas.
- GHS-BUILD-V: AI-generated vector building footprints for Europe.
- Downloading data: https://ghsl.jrc.ec.europa.eu/download.php
- IGN and Cadastre of Spain: the footprints of official buildings in Spain can be obtained through the Cadastre and the Instituto Geográfico Nacional (IGN).. They are extremely detailed and up-to-date.
- Download centre of the IGN: https://centrodedescargas.cnig.es
- Cadastral Surveyor: https://www.sedecatastro.gob.es.
- Copernicus Emergency Management Service: provides mapping products generated in record time when an emergency (earthquakes, floods, fires, etc.) is triggered.. They include damage maps and footprints of affected buildings.
- Download centre: https://emergency.copernicus.eu/mapping/list-of-components/EMSR
- Important: to download detailed vector data (such as footprints), you need to register on the platform DIAS/Copernicus EMS or request access on a case-by-case basis.
- OpenStreetMap (OSM): collaborative platform where users from all over the world have digitised building footprints, especially in areas not covered by official sources. It is especially useful for humanitarian projects, rural and developing areas, and cases where rapid updating or local involvement is needed.
- Downloading data: https://download.geofabrik.de
- Google Open Buildings: this Google project offers more than 2 billion building footprints in Africa, Asia and other data-scarce regions, generated with artificial intelligence models. It is especially useful for humanitarian purposes, urban development in countries of the global south, and risk exposure assessment in places where there are no official cadastres.
- Direct access to the data: https://sites.research.google/open-buildings/
- Microsoft Building Footprints: Microsoft has published sets of building footprints generated with machine learning algorithms applied to aerial and satellite imagery. Coverage: United States, Canada, Uganda, Tanzania, Nigeria and recently India. The data is open access under the ODbL licence.
- Meta (ex Facebook) AI Buildings Footprints: Meta AI has published datasets generated through deep learning in collaboration with the Humanitarian OpenStreetMap Team (HOT). They focused on African and Southeast Asian countries.
- Direct access to the data: https://dataforgood.facebook.com/dfg/tools/buildings.
Comparative table of open building footprints sources
| Source/Project | Geographic coverage | Data type | Format | Requires registration | Main use |
|---|---|---|---|---|---|
| JRC GHSL | Global (raster) / Europe (vector) | Raster and vector | GeoTIFF / GeoPackage / Shapefile | No | Urban analysis, European planning, comparative studies |
| IGN + Cadastre Spain | Spain | Official vector | GML/Shapefile/WFS/WMS | No | Cadastral data, urban planning, municipal management |
| Copernicus EMS | Europe and global (upon activation) | Vector (post-emergency) | PDF / GeoTIFF / Shapefile | Yes (for detailed vector data) | Rapid mapping, emergency management |
| OpenStreetMap | Global (varies by area) | Collaborative vector | .osm / shapefile / GeoJSON | No | Base maps, rural areas, humanitarian aid |
| Google Open Buildings | Africa, Asia, LatAm (selected areas) | Vector (AI-generated) | CSV / GeoJSON | No | Risk assessment, planning in developing countries |
| Microsoft Buildings Footprints | USA, Canada, India, Africa | Vector (AI) | GeoJSON | No | Massive data, urban planning, rural areas |
| Meta AI | Africa, Asia (specific areas) | Vector (AI) | GeoJSON / CSV | No | Humanitarian aid, complementing OSM in uncovered areas |
Figure 2. Comparative table of open building footprint sources.
Combination and integrated use of data
One of the great advantages of these sources being open and documented is the possibility of combining them to improve the coverage, accuracy and operational utility of building footprints. Here are some recommended approaches:
1. Complementing areas without official coverage
- In regions where cadastre is not available or up to date (such as many rural areas or developing countries), it is useful to use Google Open Buildings or OpenStreetMap as a basis.
- GHSL also provides a harmonised view on a continental scale, useful for planning and comparative analysis.
2. Cross official and collaborative layers
- The Spanish cadastre footprints can be enriched with OSM data when new or modified areas are detected, especially after an event such as a catastrophe.
- This combination is ideal for small municipalities that do not have their own technical capacity, but want to keep their data up to date.
3. Integration with socio-demographic and risk data
- Footprints gain value when integrated into geographic information systems (GIS) alongside layers such as:
- Population per building (INE, WorldPop).
- Flood zones (MAPAMA, Copernicus).
- Health centres or schools.
- Critical infrastructure (electricity grid, water).
This allows modelling risk scenarios, planning evacuations or even simulating potential impacts of an emergency.
4. Combined use in actual activations
Some real-world examples of uses of this data include:
- In cases such as the eruption on La Palma, data from the Cadastre, OSM and Copernicus EMS products were used simultaneously to map damage, estimate the affected population and plan assistance.
- During the earthquake in Turkey in 2023, organisations such as UNOSAT and Copernicus combined satellite imagery with automatic algorithms to detect structural collapses and cross-reference them with existing footprints. This made it possible to quickly estimate the number of people potentially trapped.
In emergency situations, time is a critical resource. Artificial intelligence applied to satellite or aerial imagery makes it possible to generate building footprints much faster and more automated than traditional methods.
In short, the different sources are not exclusive, but complementary. Its strategic integration within a well-governed data infrastructure is what allows moving from data to impact, and putting geospatial knowledge at the service of security, planning and collective well-being.
Data governance and coordination
Having quality building footprints is an essential first step, but their true value is only activated when these data are well governed, coordinated between actors and prepared to be used efficiently in real-world situations. This is where data governancecomes into play: the set of policies, processes and organisational structures that ensure that data is available, reliable, up-to-date and used responsibly.
Why is data governance key?
In emergency or territorial planning contexts, the lack of coordination between institutions or the existence of duplicated, incomplete or outdated data can have serious consequences: delays in decision-making, duplication of efforts or, in the worst case, erroneous decisions. Good data governance ensures that:
- Data must be known and findable: It is not enough that it exists; it must be documented, catalogued and accessible on platforms where users can easily find it.
- Have standards and interoperability: building footprints should follow common formats (such as GeoJSON, GML, shapefile), use consistent reference systems, and be aligned with other geospatial layers (utility networks, administrative boundaries, risk zones...).
- Keep up to date: especially in urban or developing areas, where new construction is rapidly emerging. Data from five years ago may be useless in a current crisis.
- Coordination between levels of government: municipal, regional, national and European. Efficient sharing avoids duplication and facilitates joint responses, especially in cross-border or international contexts.
- Clear roles and responsibilities are defined: who produces the data, who validates it, who distributes it, who activates it in case of emergency?
The value of collaboration
A robust data governance ecosystem must also foster multi-sector collaboration. Public administrations, emergency services, universities, the private sector, humanitarian organisations and citizens can benefit from (and contribute to) the use and improvement of this data.
For example, in many countries, local cadastres work in collaboration with agencies such as national geographic institutes, while citizen science and collaborative mapping initiatives (such as OpenStreetMap) can complement or update official data in less covered areas.
Emergency preparedness
In crisis situations, coordination must be anticipated. It is not just about having the data, but about having clear operational plans on how to access it, who activates it, in what formats, and how it integrates with response systems (such as Emergency Coordination Centres or civil protection GIS).
Therefore, many institutions are developing protocols for activating geospatial data in emergencies, and platforms such as Copernicus Emergency Management Service already work on this principle, offering products based on well-governed data that can be activated in record time.
Conclusion
Building footprints are not just a technical resource for urban planners or cartographers: they are a critical tool for risk management, sustainable urban planning and citizen protection. In emergency situations, where time and accurate information are critical factors, having this data can make the difference between an effective intervention and an avoidable tragedy.
Advances in Earth observation technologies, the use of artificial intelligence and the commitment to open data by institutions such as the JRC and the IGN have democratised access to highly valuable geospatial information. Today it is possible for a local administration, an NGO or a group of volunteers to access building footprints to plan evacuations, estimate affected populations or design logistical routes in real time.
However, the challenge is not only technological, but also organisational and cultural. It is imperative to strengthen data governance: to ensure that these sets are well documented, updated, accessible and that their use is integrated into emergency and planning protocols. It is also essential to train key actors, promote interoperability and foster collaboration between public institutions, the private sector and civil society.
Ultimately, building footprints represent much more than geometries on a map: they are a foundation on which to build resilience, save lives and improve decision-making at critical moments. Betting for its responsible and open use means betting for a smarter, more coordinated and people-centred public management.
Content prepared by Mayte Toscano, Senior Consultant in Data Economy Technologies. The contents and points of view reflected in this publication are the sole responsibility of the author.
Entrevista
In this episode we will delve into the importance of three related categories of high-value datasets. These are Earth observation and environmental data, geospatial data and mobility data. To tell us about them, we have interviewed two experts in the field:
- Paloma Abad Power, deputy director of the National Centre for Geographic Information (CNIG).
- Rafael Martínez Cebolla, geographer of the Government of Aragón.
With them we have explored how these high-value datasets are transforming our environment, contributing to sustainable development and technological innovation.
Listen to the full podcast (only available in Spanish)
Summary / Transcript of the interview
1. What are high-value datasets and why are their important?
Paloma Abad Power: According to the regulation, high-value datasets are those that ensure highest socio-economic potential and, for this, they must be easy to find, i.e. they must be accessible, interoperable and usable. And what does this mean? That means that the datasets must have their descriptions, i.e. the online metadata, which report the statistics and their properties, and which can be easily downloaded or used.
In many cases, these data are often reference data, i.e. data that serve to generate other types of data, such as thematic data, or can generate added value.
Rafael Martínez Cebolla: They could be defined as those datasets that represent phenomena that are useful for decision making, for any public policy or for any action that a natural or legal person may undertake.
In this sense, there are already some directives, which are not so recent, such as the Water Framework Directive or the INSPIRE Directive, which motivated this need to provide shared data under standards that drive the sustainable development of our society.
2. These high-value data are defined by a European Directive and an Implementing Regulation which dictated six categories of high-value datasets. On this occasion we will focus on three of them: Earth observation and environmental data, geospatial data and mobility data. What do these three categories of data have in common and what specific datasets do they cover?
Paloma Abad Power: In my opinion, these data have in common the geographical component, i.e. they are data located on the ground and therefore serve to solve problems of different nature and linked to society.
Thus, for example, we have, with national coverage, the National Aerial Orthophotography Plan (PNOA), which are the aerial images, the System of Land Occupation Information (SIOSE), cadastral parcels, boundary lines, geographical names, roads, postal addresses, protected sites - which can be both environmental and also castles, i.e. historical heritage- etc. And these categories cover almost all the themes defined by the annexes of the INSPIRE directive.
Rafael Martínez Cebolla: It is necessary to know what is pure geographic information, with a direct geographic reference, as opposed to other types of phenomena that have indirect geographic references. In today's world, 90% of information can be located, either directly or indirectly. Today more than ever, geographic tagging is mandatory for any corporation that wants to implement a certain activity, be it social, cultural, environmental or economic: the implementation of renewable energies, where I am going to eat today, etc. These high-value datasets enhance these geographical references, especially of an indirect nature, which help us to make a decision.
3. Which agencies publish these high-value datasets? In other words, where could a user locate datasets in these categories?
Paloma Abad Power: It is necessary to highlight the role of the National Cartographic System, which is an action model in which the organisations of the NSA (National State Administration) and the autonomous communities participate. It is coordinating the co-production of many unique products, funded by these organisations.
These products are published through interoperable web services. They are published, in this case, by the National Center for Geographic Information (CNIG), which is also responsible for much of the metadata for these products.
They could be located through the Catalogues of the IDEE (Spatial Data Infrastructure of Spain) or the Official Catalogue of INSPIRE Data and Services, which is also included in datos.gob.es and the European Data Portal.
And who can publish? All bodies that have a legal mandate for a product classified under the Regulation. Examples: all the mapping bodies of the Autonomous Communities, the General Directorate of Cadastre, Historical Heritage, the National Statistics Institute, the Geological and Mining Institute (IGME), the Hydrographic Institute of the Navy, the Ministry of Agriculture, Fisheries and Food (MAPA), the Ministry for Ecological Transition and the Demographic Challenge, etc. There are a multitude of organisations and many of them, as I have mentioned, participate in the National Cartographic System, provide the data and generate a single service for the citizen.
Rafael Martínez Cebolla: The National Cartographic System defines very well the degree of competences assumed by the administrations. In other words, the public administration at all levels provides official data, assisted by private enterprise, sometimes through public procurement.
The General State Administration goes up to scales of 1:25,000 in the case of the National Geographic Institute (IGN) and then the distribution of competencies for the rest of the scales is for the autonomous or local administrations. In addition, there are a number of actors, such as hydrographic confederations, state departments or the Cadastre, which have under their competences the legal obligation to generate these datasets.
For me it is an example of how it should be distributed, although it is true that it is then necessary to coordinate very well, through collegiate bodies, so that the cartographic production is well integrated.
Paloma Abad Power: There are also collaborative projects, such as, for example, a citizen map, technically known as an X, Y, Z map, which consists of capturing the mapping of all organisations at national and local level. That is, from small scales 1:1,000,000 or 1:50,000,000 to very large scales, such as 1:1000, to provide the citizen with a single multi-scale map that can be served through interoperable and standardised web services.
4. Do you have any other examples of direct application of this type of data?
Rafael Martínez Cebolla: A clear example was seen with the pandemic, with the mobility data published by the National Institute of Statistics. These were very useful data for the administration, for decision making, and from which we have to learn much more for the management of future pandemics and crises, including economic crises. We need to learn and develop our early warning systems.
I believe that this is the line of work: data that is useful for the general public. That is why I say that mobility has been a clear example, because it was the citizen himself who was informing the administration about how he was moving.
Paloma Abad Power: I am going to contribute some data. For example, according to statistics from the National Cartographic System services, the most demanded data are aerial images and digital terrain models. In 2022 there were 8 million requests and in 2023 there were 19 million requests for orthoimages alone.
Rafael Martínez Cebolla: I would like to add that this increase is also because things are being done well. On the one hand, discovery systems are improved. My general feeling is that there are many successful example projects, both from the administration itself and from companies that need this basic information to generate their products.
There was an application that was generated very quickly with de-escalation - you went to a website and it told you how far you could walk through your municipality - because people wanted to get out and walk. This example arises from spatial data that have moved out of the public administration. I believe that this is the importance of successful examples, which come from people who see a compelling need.
5. And how do you incentivise such re-use?
Rafael Martínez Cebolla: I have countless examples. Incentivisation also involves promotion and marketing, something that has sometimes failed us in the public administration. You stick to certain competences and it seems that just putting it on a website is enough. And that is not all.
We are incentivising re-use in two ways. On the one hand, internally, within the administration itself, teaching them that geographic information is useful for planning and evaluating public policies. And I give you the example of the Public Health Atlas of the Government of Aragon, awarded by an Iberian society of epidemiology the year before the pandemic. It was useful for them to know what the health of the Aragonese was like and what preventive measures they had to take.
As for the external incentives, in the case of the Geographic Institute of Aragon, it was seen that the profile entering the geoportal was very technical. The formats used were also very technical, which meant that the general public was not reached. To solve this problem, we promoted portals such as the IDE didactica, a portal for teaching geography, which reaches any citizen who wants to learn about the territory of Aragon.
Paloma Abad Power: I would like to highlight the economic benefit of this, as was shown, for example, in the economic study carried out by the National Centre for Graphic Information with the University of Leuven to measure the economic benefit of the Spatial Data Infrastructure of Spain. It measure the benefit of private companies using free and open services, rather than using, for example, Google Maps or other non-open sources..
Rafael Martínez Cebolla: For better and for worse, because the quality of the official data sometimes we wish it were better. Both Paloma in the General State Administration and I in the regional administration sometimes know that there are official data where more money needs to be invested so that the quality of the data would be better and could be reusable.
But it is true that these studies are key to know in which dimension high-value datasets move. That is to say, having studies that report on the real benefit of having a spatial data infrastructure at state or regional level is, for me, key for two things: for the citizen to understand its importance and, above all, for the politician who arrives every N years to understand the evolution of these platforms and the revolution in geospatial information that we have experienced in the last 20 years.
6. The Geographic Institute of Aragon has also produced a report on the advantages of reusing this type of data, is that right?
Rafael Martínez Cebolla: Yes, it was published earlier this year. We have been doing this report internally for three or four years, because we knew we were going to make the leap to a spatial knowledge infrastructure and we wanted to see the impact of implementing a knowledge graph within the data infrastructure. The Geographic Institute of Aragon has made an effort in recent years to analyse the economic benefit of having this infrastructure available for the citizens themselves, not for the administration. In other words, how much money Aragonese citizens save in their taxes by having this infrastructure. Today we know that having a geographic information platform saves approximately 2 million euros a year for the citizens of Aragon.
I would like to see the report for the next January or February, because I think the leap will be significant. The knowledge graph was implemented in April last year and this gap will be felt in the year ahead. We have noticed a significant increase in requests, both for viewing and downloading.
Basically from one year to the next, we have almost doubled both the number of accesses and downloads. This affects the technological component: you have to redesign it. More people are discovering you, more people are accessing your data and, therefore, you have to dedicate more investment to the technological component, because it is being the bottleneck.
7. What do you see as the challenges to be faced in the coming years?
Paloma Abad Power: In my opinion, the first challenge is to get to know the user in order to provide a better service. The technical user, the university students, the users on the street, etc. We are thinking of doing a survey when the user is going to use our geographic information. But of course, such surveys sometimes slow down the use of geographic information. That is the great challenge: to know the user in order to make services more user-friendly, applications, etc. and to know how to get to what they want and give it to them better.
There is also another technical challenge. When the spatial infrastructures began, the technical level was very high, you had to know what a visualisation service was, the metadata, know the parameters, etc. This has to be eliminated, the user can simply say I want, for example, to consult and visualise the length of the Ebro river, in a more user-friendly way. Or for example the word LiDAR, which was the Italian digital model with high accuracy. All these terms need to be made much more user-friendly.
Rafael Martínez Cebolla: Above all, let them be discovered. My perception is that we must continue to promote the discovery of spatial data without having to explain to the untrained user, or even to some technicians, that we must have a data, a metadata, a service..... No, no. Basically it is that generalist search engines know how to find high-value datasets without knowing that there is such a thing as spatial data infrastructure.
It is a matter of publishing the data under friendly standards, under accessible versions and, above all, publishing them in permanent URIs, which are not going to change. In other words, the data will improve in quality, but will never change.
And above all, from a technical point of view, both spatial data infrastructures and geoportals and knowledge infrastructures have to ensure that high-value information nodes are related to each other from a semantic and geographical point of view. I understand that knowledge networks will help in this regard. In other words, mobility has to be related to the observation of the territory, to public health data or to statistical data, which also have a geographical component. This geographical semantic relationship is key for me.
Interview clips
1. What are high-value datasets and why are their important?
2. Where can a user locate geographic data?
3. How is the reuse of data with a geographic component being encouraged?
Blog
The National Centre for Geographic Information publishes open geospatial data from the National Cartographic System, the National Geographic Institute and other organisations through web applications and mobile applications to facilitate access to and consultation of geographic data by citizens.
Geospatial data is published via web services and APIs for reuse, so in the case of high-value datasets, it can be used in a variety of ways high-value datasets such as geographic names, hydrography or addresses as required by the as required by the EUthe EU has already made these datasets available to the public by June 2024 as they are associated with major benefits for society, the environment and the economy.
But in the applications listed below, the geographic data are visualised and consulted through web services, so that for downloading the data, it is possible to use web services and APIs directly, through a platform accessible to any user with a wide range of geographic information, ranging from topographic maps to satellite images.
But not only data can be reused, also application software is reusable, for example, the Solar Energy Potential of Buildings visualiser which is based on a visualiser API, named API-CNIG and allows the same tool to be used for different thematic areas.
Some examples of applications are:

Solar Energy Potential of Buildings
Provides the photovoltaic capacity of a building according to its location and characteristics. It also provides the average over the year and a point grid to identify the best location for solar panels.
National Geographic Gazetteer
It is a toponym search engine that collects the names, official or standardised by the corresponding competent bodies , with geographical references.
Unified postal address calculator
It is a converter that allows to know the geographical coordinates (latitude and longitude in WGS84) of the postal addresses of a place, and vice versa. In both cases, the input file is a CSV file, supporting both coordinates and postal addresses.
Basic Maps of Spain
It facilitates connection to IGN services and to the CNIG download centre to obtain maps and routes. With this mobile application you can follow the routes of the National Parks or the stages of the Camino de Santiago. It allows you to plan excursions using maps, navigate and take guided tours, without the need for an internet connection after downloading data.
Map a la carte
It allows you to create a customised map using the printed series of the National Topographic Map at scales 1:25.000 and 1:50.000. It offers the possibility of defining its area, incorporating contents, personalising the cover, obtaining a pdf file and even acquiring paper copies by post.
IGN Earthquakes
It allows the reception and visualisation of all seismic events in Spain and its surroundings. It provides the distance to the epicentre of the seismic event and epicentral parameters, as well as the geolocation of the user's position and the epicentre.
Maps of Spain
It is a free mobile viewer ideal for hiking, cycling, running, skiing, etc., which uses as background cartography the services of the National Geographic Institute and another set of services from other Ministries, such as the Cadastral information of the plots provided by the General Directorate of Cadastre.
Camino de Santiago
It includes information of a cultural and practical nature on each of the stages (hostels, monuments, etc.), as well as a complete Pilgrim's Guide detailing what you should know before starting out on any of the routes. This application is based on ESRI software.
National Parks
Displays information on the history, fauna, flora and excursions in Spain's National Parks. It includes hundreds of points of interest such as information centres, accommodation, viewpoints, refuges and even routes through the parks, indicating their duration and difficulty. The app is available for download on Android e iOS. This application is based on ESRI software.
GeoSapiens IGN
It presents interactive maps, free to use and free of charge, to study the physical and political geography of Spain and the world. It consists of different games relating to the whole of Spain or by autonomous communities, the whole world and by continent.
In addition to the applications developed by the CNIG, which are also presented in this video this videothere are many other digital solutions developed by third parties that reuse open geospatial data to offer a service to society. For example, in the list of data reusing applications.gob.es you can find from a map that shows the fires that are active in Spain in real time in Spain in real time to an app that shows where the parking spaces for people with reduced mobility parking spaces for people with reduced mobility in each town.
In short, anyone can make use of the open geographic data of the National Cartographic System, the National Geographic Institute and other bodies published by the CNIG , thus extending the advantages offered by the availability of open geographic data. do you know of any other application resulting from the reuse of open data? You can send it to us at dinamizacion@datos.gob.es
Blog
Geographic data allow us to learn about the world around us. From locating optimal travel routes to monitoring natural ecosystems, from urban planning and development to emergency management, geographic data has great potential to drive development and efficiency in multiple economic and social areas. They are therefore considered high-value datasets by the European Commission, and have a specific obligations to make their publication accessible and interoperable.
In order to understand the real impact of this type of data, several reports and studies have been carried out. The following are several of them, which address the challenge of measuring the impact of geographic information.
Geospatial data in the Ministry of Transport and Sustainable Mobility. Impact of information co-produced by IGN and CNIG (2024)
- You can read the full report here.
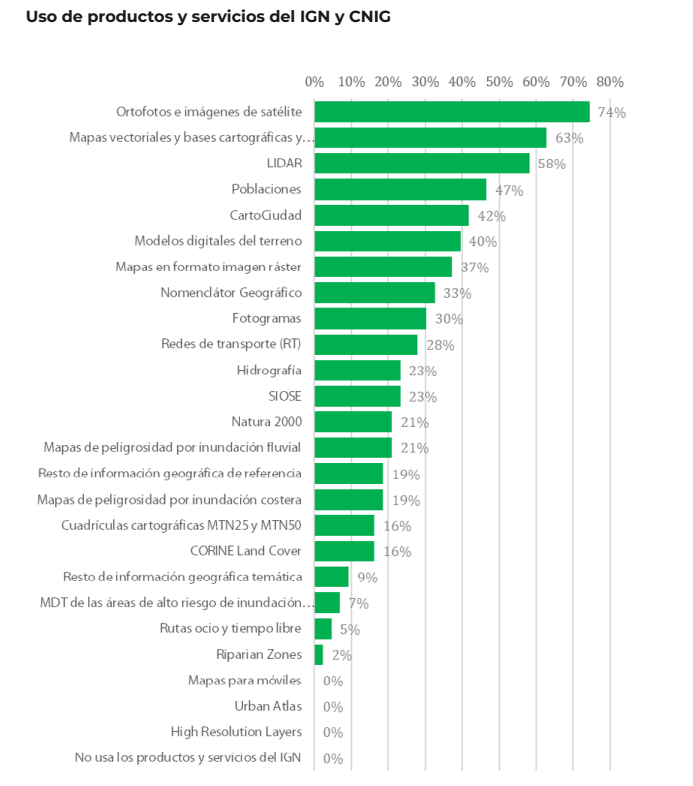
This report, produced by ASEDIE and CNIG, aims to draw conclusions about the use and perception of the services co-produced by National Geographic Institute (IGN) and National Centre for Geographic Information (CNIG) in order to understand the benefit they bring to the daily activity of the companies that use them and to society. For this purpose, a survey was carried out among companies using geospatial data, thanks to which a classification of companies reusing geographic data could be drawn up.
Of the 170 companies considered, 70.0% are self-employed and micro-enterprises (less than 10 employees). These companies are mainly located in the Community of Madrid (25.6%), Catalonia (16.3%), Andalusia (14%), Valencia (11.6%) and Castilla y León (11.6%). 53.3% claim to reuse data from Spatial Data Infrastructures (SDI) and 51% open data from INE, among others. The most used products are orthophotos and satellite images (74%), followed by vector maps and cartographic and topographic databases (63%), and LiDAR (58%).
In terms of economic impact, the report estimates an average impact of 35.7% on the sales of the companies surveyed. Specifically, open geographic information from the IGN and CNIG account for an impact of 12.4% of sales.
The report also includes the analysis of collected use cases, as well as in-depth interviews with companies in the sector as examples of best practices and, on the other hand, updates the information from Asedie's annual report on the Data Economy in its 2023 infomediary scope with respect to the economic data of the geographic subsector.
Economic benefits of the SDI central node by CNIG and University of Leuven (2021)
- You can read the full report here.
This document develops and tests a methodology for estimating the economic benefits generated by the Spanish Spatial Data Infrastructure (IDEE), which establishes the publication and accessibility of spatial data through free geographic web services for viewing and downloading produced by cartographic, environmental, cadastral and land observation organisations at national, regional and local level since 2004, in accordance with norms, standards and recommendations that guarantee their interoperability.
The study was to answer the question of what would happen if the NSDI were to disappear. For the study, only the central node of the NSDIE was considered, understanding as such the geographic services and data co-produced among the partners of the National Cartographic System, and focusing on web map services (WMS) and map tiles (WMTS). The nodes of ministries, autonomous communities and local entities were not part of its scope.
Two investigation paths were used to carry out the calculation:
- Comparison with the costs of using Google Maps. The application of the different scenarios led to a profit/value of the 6 WMTS and 13 WMS of minimum 355,646 and maximum 891,144 euros.
- Comparison with other countries' charges for the use of their data and services. Despite the difficulties in calculating the rate per application, due to the existence of different approaches in each country, the total value of the FDIE was estimated at between 34,000 and 14 million euros.
This report joins others produced by the NSDI, such as these documents to estimate the average cost of metadata generation or the implementation of visualisation and download services for Inspire-compliant datasets, both carried out in 2019.
In order to allow other organisations to adapt the study to their particularities, an Excel file has been created, as a calculator, with the following calculation template.
ICEARAGON and ARAGEA Performance Report by the Government of Aragon (2024)
- You can read the full report here.
Regional governments are also interested in knowing the impact of their geographic information services. This is the case of the Government of Aragon, which recently presented a report on the performance of the Spatial Knowledge Infrastructure of Aragon (ICEARAGON) and the Active Geodesy Network of Aragon (AREAGA).
In total, these services are estimated to have saved almost two million euros for all Aragonese citizens by 2023. According to the report, ICEARAGÓN received almost 5 million visits in 2023, an increase of 58.6% over 2022. These users made 1.7 million downloads. Most of the information downloaded (47.8%) refers to environmental layers. Information on administrative boundaries (13.8%) and maps of Aragon (13.4%) were also very successful. Regarding the user profile, 71% are from the surveying field and 27% belong to the agricultural sector.
These reports serve as a basis for the work of the European Commission on a regular basis, compiling progress in the different areas of INSPIRE implementation. As a result of this work, annual reports are generated for each country, including a section on costs and benefits.
All this work on measuring and estimating benefits highlights the economic value of providing geographic data and services to society. As a result, new products and services can be created that boost the economy of the whole country and provide benefits to all its citizens.
Entrevista
Copernicus is the Earth observation program of the European Union. Through 6 thematic services, and the images provided by its satellites, Copernicus provides complete, free and up-to-date geospatial data that helps the monitoring and management of the territory and the planet both at European and worldwide level.
In datos.gob.es, we have interviewed Nuria Valcárcel, Deputy Assistant Director (Observation of the Territory) of the General Directorate of Geodesy and Cartography, in the D.G. National Geographic Institute (IGN) of the Ministry of Development, an organization that represents Spain in the Copernicus Users Forum, for the monitoring and evolution of the program, together with the Ministry for Ecological Transition (MITECO).
Earth observation data, such as those linked to the Copernicus project, always awaken great interest. What are the reasons?
Copernicus geospatial data are essential as a decision-making tool in the current digital economy and government systems. These data can be used to analyze and monitor phenomena due to climate change, and help us find solutions. Its potential is also enormous in matters related to safety, transportation, emergency management, sustainability assessment...
There are many organizations that, aware of the current context, have highlighted the importance of this initiative to achieve the Sustainable Development Goals (SDGs), such as the United Nations Organization or the European Commission. The United Nations, in its document “Transforming our world: the 2030 Agenda for Sustainable Development”, indicates that national institutions should promote the use of Earth observation data and geospatial information, to follow up on the 2030 Agenda.
Specifically, what kind of data and information does Copernicus provide?
Copernicus data has 2 large components: on the one hand, the information obtained via satellite, such as the Sentinel constellations, and on the other the in-situ component, that is, any data not coming from satellites. For example, air quality data, water quality data in rivers and reservoirs, wave and sea level information through buoys, tide gauges, orthophotographs and digital elevation models ... In the case of Spain, these data are provided by different national organizations such as IGN, MITECO, AEMET or State Ports, among others.
Through the Copernicus hub you can access and download these data. The information obtained through Sentinel satellites is available for use by any citizen, but when we talk about the rest of the on-site data, we find differences according to the data policy of each country. In the case of Spain, it should be noted that we have really been pioneers in open data policies and much of the information we generate is available through Copernicus' own download platforms or national platforms.
Who are the main users of this type of data? Could you give an example?
Public administrations are the main users of Copernicus, but an increasing number of companies rely on these data to generate new opportunities and improve their competitiveness, as well as universities and research centers.
The IGN and other Spanish administrations are beginning to work with large and small Spanish companies to collaborate in the generation of data for Copernicus, but we also try to boost its reuse more and more. For example, for water management or smart agriculture, since they facilitate continuous monitoring of the state of the crops, allowing water resources to be optimized. As a concrete example, we can talk about the DIANA Project, in which the company AGRISAT and the Andalusian Federation of Irrigation Communities of Andalusia (FERAGUA) participate, to generate an innovative commercial services platform, based on Copernicus Earth Observation data and other sources, for the identification of illegal irrigation areas and the estimation of volumes of water extracted.
Forest management can also greatly benefit from Sentinel satellites and Copernicus data. This is the case of AGRESTA and its FORESMAP application, which combine satellite data with others data sources such as the Lidar provided by the IGN, to provide an online forest inventory calculation. This application has been awarded at the 2018 Copernicus Masters CGI Big Data Business Challenge.
Another area with great potential is marine services, for the sustainable exploitation of coastal resources, port management, or the optimization and safety of trade routes. Here we can mention NOLOGIN as an example. It provide a (web and mobile) real time application and predictions for decision making in system ports, based on Copernicus data, with an alert and report management interface.
And regarding public administrations, do you know any AA.PP. that intensively use Copernicus project data?
There are many experiences. To highlight some examples, the IGN provides Copernicus data directly through the Download Center and makes extensive use and dissemination of Sentinel satellite images through the National Remote Sensing Plan. These data are also used by the IGN to enrich the system for monitoring changes in the terrain, for example, to assess volcanic risk.
The data of the marine operational service are very useful for State Ports. knowing how marine currents evolve, and improving their predictive models is possible thanks to them
For its part, AEMET participates in the generation of Copernicus data and services in relation to Atmosphere and Climate Change, as a member of the European Centre for Medium-Range Weather Forecasts, which benefits Spanish institutions and scientists participating in numerous research programs.
The Spanish Agricultural Guarantee Fund, the National Parks Network, the General Water Directorate, the Autonomous Communities, as well as a large number of universities and study centers also use these type of data.
What are the main challenges and barriers to the reuse of Earth observation data?
The challenges that reusers have to face could be summarized in 4 areas.
In the first place, some technical knowledge is required to work with Copernicus data. Although sometimes we find some data or services easy to use by non-expert users, in other cases advanced capabilities are needed to locate and understand the information. Copernicus Program is making an effort to train professionals, through free courses, while working on the creation of environments where data are easily located and easy to use.
Secondly, we could talk about the coordination between the different levels of European administration (local, regional, state ...). A common effort must be made to generate better data, avoiding duplication, and for this, coordination between European and national institutions is essential. Currently, there are coordination mechanisms already established, but there are areas for improvement.
Thirdly, it is necessary to improve the interaction with users, to better understand their needs and thus be able to assess whether the Copernicus program is responding to those needs. And these needs are changing and require constant adaptation. Through the Spanish Users' Committees and Forum, the National Services Coordinators, and the Relay and Academy Networks, we are making a strong effort to approach as many users as possible, to work together in a common goal.
Finally, we cannot forget the need to encourage data to be interoperable, to meet common standards and to be harmonized. For example, the Mediterranean coast, and the different phenomena and dynamics that affect it, have to be monitored as a whole, and for this we need a common pan-European data, also harmonized with the national data that each country manages. Again, coordination between administrations is essential to achieve this goal.
One of the challenges you have mentioned is the user´s lack of knowledge about Copernicus data availability. What concrete actions are the IGN taking to publicize Copernicus data?
The European Union organizes different activities to encourage the use of Copernicus data in private companies. This is the case of the Copernicus Master competition, hackathons, the acceleration programs (Copernicus Accelerator) or business incubation (Copernicus Incubator). These types of activities, often aimed at entrepreneurs and start-ups, seek to support new ideas that involve the creation of services and commercial applications related to Copernicus.
In addition, the IGN, together with the Ministry for Ecological Transition (MITECO), in the Copernicus Users Forum, and also with representatives in the Copernicus Committee (the Ministry of Industry, Commerce and Tourism and the Centre for Technological and Industrial Development), works very actively with the different user groups in Spain. We are part of the Copernicus Users Forum, we carry out meetings and workshops for specific services and themes (Territory, Marine, Agriculture, Smart Cities, etc.), we encourage the participation of universities in Copernicus activities and proposals… In short, we seeks to generate a favorable ecosystem that facilitates the use of Copernicus.
Finally, could you tell us what your future plans are?
The Copernicus program is open to continuous review of requirements. In this regard, I would highlight two issues on the agenda.
First, the synergies between Copernicus and Galileo, the European Union navigation system, that the Ministry of Development also lead in Spain. The integration of both systems allows real-time monitoring of atmospheric phenomena to determine how vehicles move in cities. In this way, the constant impact of greenhouse gas emissions from vehicles could be monitored. It could also be used in matters of security, surveillance of natural hazards, etc.
On the other hand, the European Commission is directing its policies towards sustainability and the fight against climate change. In the new Copernicus operating cycle (2021-2027), some of the areas to be promoted are the monitoring of greenhouse gases or the monitoring of Polar Regions (snow and ice level). The civil security approach will also be expanded and the use of Copernicus data will be encouraged not only in Europe, but also in other regions, such as Latin America or Africa.