Documentación
1. Introduction
Visualizations are graphical representations of data that allow for the simple and effective communication of information linked to them. The possibilities for visualization are very broad, from basic representations such as line graphs, bar charts or relevant metrics, to visualizations configured on interactive dashboards.
In this section "Visualizations step by step" we are periodically presenting practical exercises using open data available on datos.gob.es or other similar catalogs. In them, the necessary steps to obtain the data, perform the transformations and relevant analyses to, finally obtain conclusions as a summary of said information, are addressed and described in a simple way.
Each practical exercise uses documented code developments and free-to-use tools. All generated material is available for reuse in the GitHub repository of datos.gob.es.
In this specific exercise, we will explore tourist flows at a national level, creating visualizations of tourists moving between autonomous communities (CCAA) and provinces.
Access the data laboratory repository on Github.
Execute the data pre-processing code on Google Colab.
In this video, the author explains what you will find on both Github and Google Colab.
2. Context
Analyzing national tourist flows allows us to observe certain well-known movements, such as, for example, that the province of Alicante is a very popular summer tourism destination. In addition, this analysis is interesting for observing trends in the economic impact that tourism may have, year after year, in certain CCAA or provinces. The article on experiences for the management of visitor flows in tourist destinations illustrates the impact of data in the sector.
3. Objective
The main objective of the exercise is to create interactive visualizations in Python that allow visualizing complex information in a comprehensive and attractive way. This objective will be met using an open dataset that contains information on national tourist flows, posing several questions about the data and answering them graphically. We will be able to answer questions such as those posed below:
- In which CCAA is there more tourism from the same CA?
- Which CA is the one that leaves its own CA the most?
- What differences are there between tourist flows throughout the year?
- Which Valencian province receives the most tourists?
The understanding of the proposed tools will provide the reader with the ability to modify the code contained in the notebook that accompanies this exercise to continue exploring the data on their own and detect more interesting behaviors from the dataset used.
In order to create interactive visualizations and answer questions about tourist flows, a data cleaning and reformatting process will be necessary, which is described in the notebook that accompanies this exercise.
4. Resources
Dataset
The open dataset used contains information on tourist flows in Spain at the CCAA and provincial level, also indicating the total values at the national level. The dataset has been published by the National Institute of Statistics, through various types of files. For this exercise we only use the .csv file separated by ";". The data dates from July 2019 to March 2024 (at the time of writing this exercise) and is updated monthly.
Number of tourists by CCAA and destination province disaggregated by PROVINCE of origin
The dataset is also available for download in this Github repository.
Analytical tools
The Python programming language has been used for data cleaning and visualization creation. The code created for this exercise is made available to the reader through a Google Colab notebook.
The Python libraries we will use to carry out the exercise are:
- pandas: is a library used for data analysis and manipulation.
- holoviews: is a library that allows creating interactive visualizations, combining the functionalities of other libraries such as Bokeh and Matplotlib.
5. Exercise development
To interactively visualize data on tourist flows, we will create two types of diagrams: chord diagrams and Sankey diagrams.
Chord diagrams are a type of diagram composed of nodes and edges, see Figure 1. The nodes are located in a circle and the edges symbolize the relationships between the nodes of the circle. These diagrams are usually used to show types of flows, for example, migratory or monetary flows. The different volume of the edges is visualized in a comprehensible way and reflects the importance of a flow or a node. Due to its circular shape, the chord diagram is a good option to visualize the relationships between all the nodes in our analysis (many-to-many type relationship).
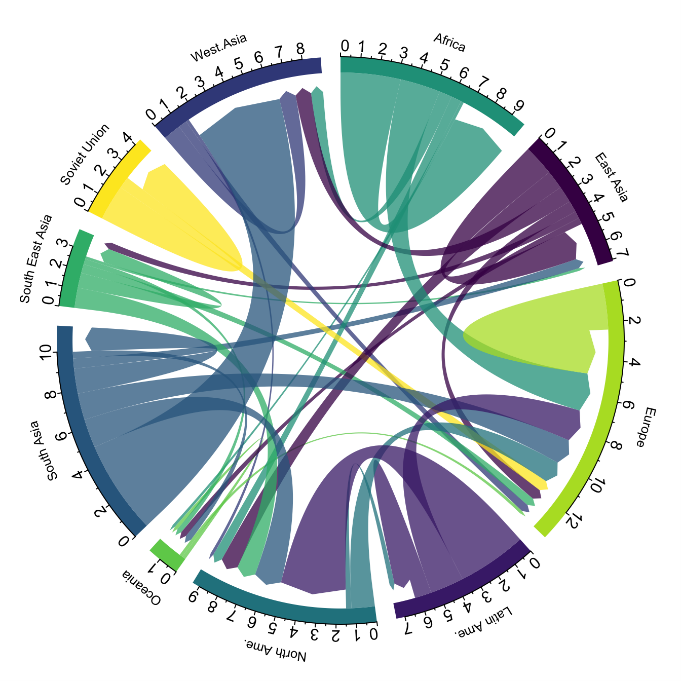
Figure 1. Chord Diagram (Global Migration). Source.
Sankey diagrams, like chord diagrams, are a type of diagram composed of nodes and edges, see Figure 2. The nodes are represented at the margins of the visualization, with the edges between the margins. Due to this linear grouping of nodes, Sankey diagrams are better than chord diagrams for analyses in which we want to visualize the relationship between:
- several nodes and other nodes (many-to-many, or many-to-few, or vice versa)
- several nodes and a single node (many-to-one, or vice versa)

Figure 2. Sankey Diagram (UK Internal Migration). Source.
The exercise is divided into 5 parts, with part 0 ("initial configuration") only setting up the programming environment. Below, we describe the five parts and the steps carried out.
5.1. Load data
This section can be found in point 1 of the notebook.
In this part, we load the dataset to process it in the notebook. We check the format of the loaded data and create a pandas.DataFrame that we will use for data processing in the following steps.
5.2. Initial data exploration
This section can be found in point 2 of the notebook.
In this part, we perform an exploratory data analysis to understand the format of the dataset we have loaded and to have a clearer idea of the information it contains. Through this initial exploration, we can define the cleaning steps we need to carry out to create interactive visualizations.
If you want to learn more about how to approach this task, you have at your disposal this introductory guide to exploratory data analysis.
5.3. Data format analysis
This section can be found in point 3 of the notebook.
In this part, we summarize the observations we have been able to make during the initial data exploration. We recapitulate the most important observations here:
| Province of origin | Province of origin | CCAA and destination province | CCAA and destination province | CCAA and destination province | Tourist concept | Period | Total |
|---|---|---|---|---|---|---|---|
| National Total | National Total | Tourists | 2024M03 | 13.731.096 | |||
| National Total | Ourense | National Total | Andalucía | Almería | Tourists | 2024M03 | 373 |
Figure 3. Fragment of the original dataset.
We can observe in columns one to four that the origins of tourist flows are disaggregated by province, while for destinations, provinces are aggregated by CCAA. We will take advantage of the mapping of CCAA and their provinces that we can extract from the fourth and fifth columns to aggregate the origin provinces by CCAA.
We can also see that the information contained in the first column is sometimes superfluous, so we will combine it with the second column. In addition, we have found that the fifth and sixth columns do not add value to our analysis, so we will remove them. We will rename some columns to have a more comprehensible pandas.DataFrame.
5.4. Data cleaning
This section can be found in point 4 of the notebook.
In this part, we carry out the necessary steps to better format our data. For this, we take advantage of several functionalities that pandas offers us, for example, to rename the columns. We also define a reusable function that we need to concatenate the values of the first and second columns with the aim of not having a column that exclusively indicates "National Total" in all rows of the pandas.DataFrame. In addition, we will extract from the destination columns a mapping of CCAA to provinces that we will apply to the origin columns.
We want to obtain a more compressed version of the dataset with greater transparency of the column names and that does not contain information that we are not going to process. The final result of the data cleaning process is the following:
| Origin | Province of origin | Destination | Province of destination | Period | Total |
|---|---|---|---|---|---|
| National Total | National Total | 2024M03 | 13731096.0 | ||
| Galicia | Ourense | Andalucía | Almería | 2024M03 | 373.0 |
Figure 4. Fragment of the clean dataset.
5.5. Create visualizations
This section can be found in point 5 of the notebook
In this part, we create our interactive visualizations using the Holoviews library. In order to draw chord or Sankey graphs that visualize the flow of people between CCAA and CCAA and/or provinces, we have to structure the information of our data in such a way that we have nodes and edges. In our case, the nodes are the names of CCAA or province and the edges, that is, the relationship between the nodes, are the number of tourists. In the notebook we define a function to obtain the nodes and edges that we can reuse for the different diagrams we want to make, changing the time period according to the season of the year we are interested in analyzing.
We will first create a chord diagram using exclusively data on tourist flows from March 2024. In the notebook, this chord diagram is dynamic. We encourage you to try its interactivity.
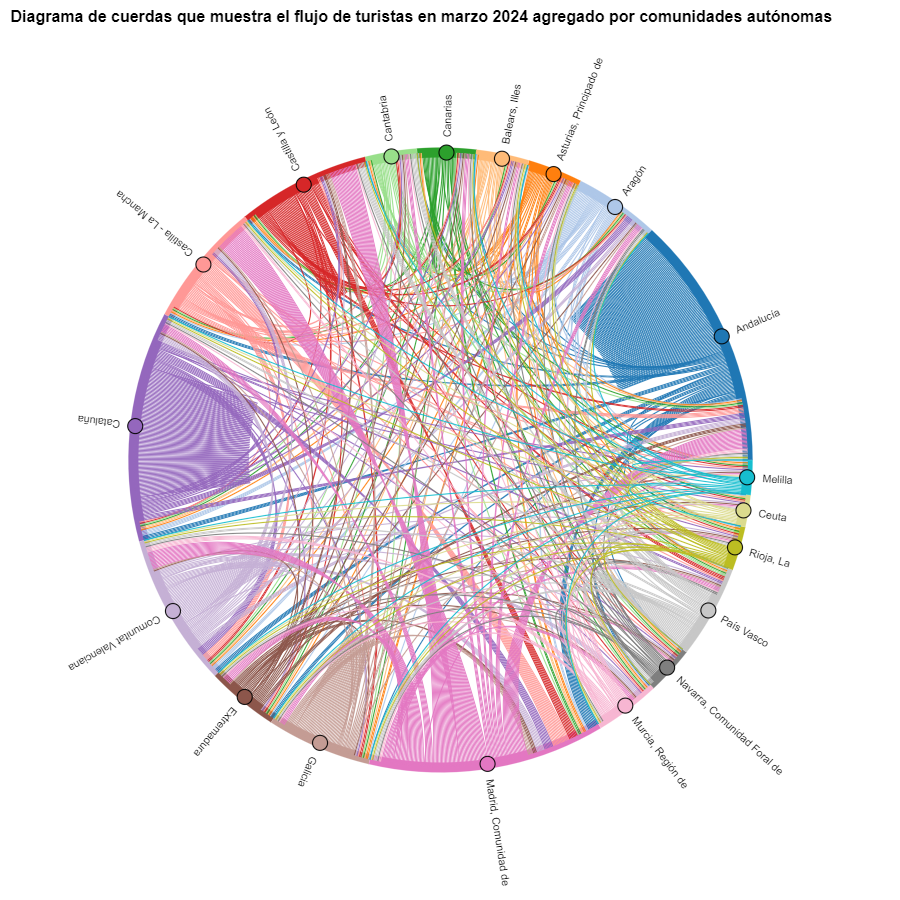
Figure 5. Chord diagram showing the flow of tourists in March 2024 aggregated by autonomous communities.
The chord diagram visualizes the flow of tourists between all CCAA. Each CA has a color and the movements made by tourists from this CA are symbolized with the same color. We can observe that tourists from Andalucía and Catalonia travel a lot within their own CCAA. On the other hand, tourists from Madrid leave their own CA a lot.
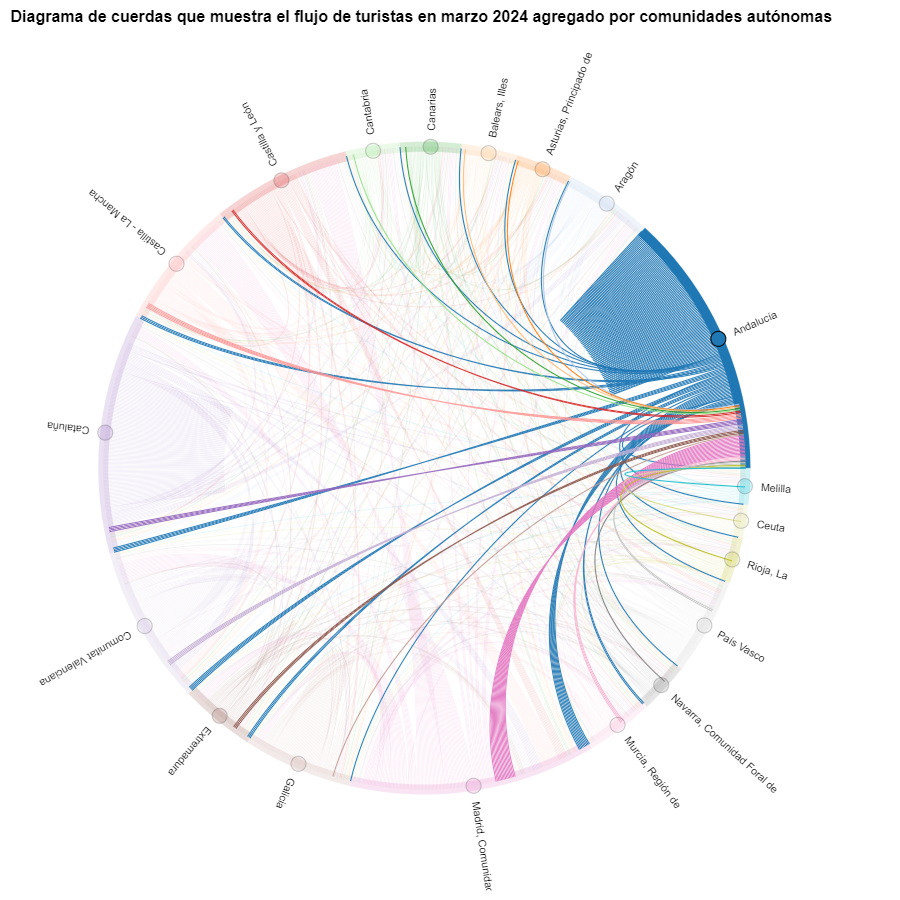
Figure 6. Chord diagram showing the flow of tourists entering and leaving Andalucía in March 2024 aggregated by autonomous communities.
We create another chord diagram using the function we have created and visualize tourist flows in August 2023.
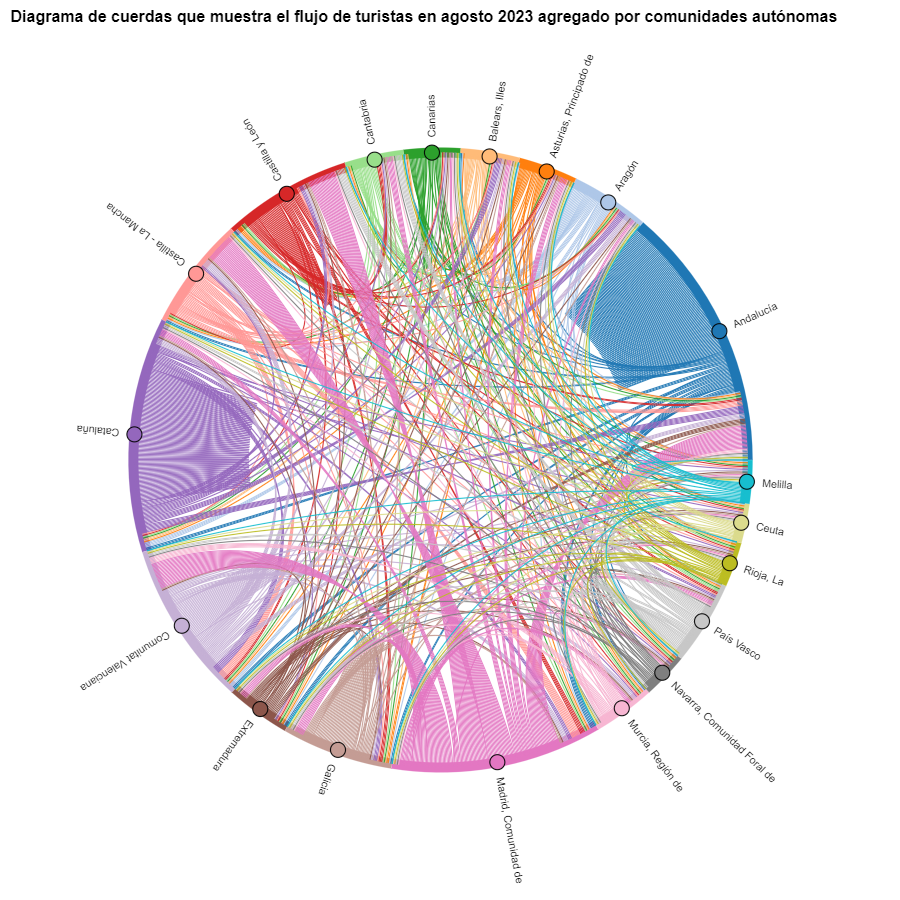
Figure 7. Chord diagram showing the flow of tourists in August 2023 aggregated by autonomous communities.
We can observe that, broadly speaking, tourist movements do not change, only that the movements we have already observed for March 2024 intensify.
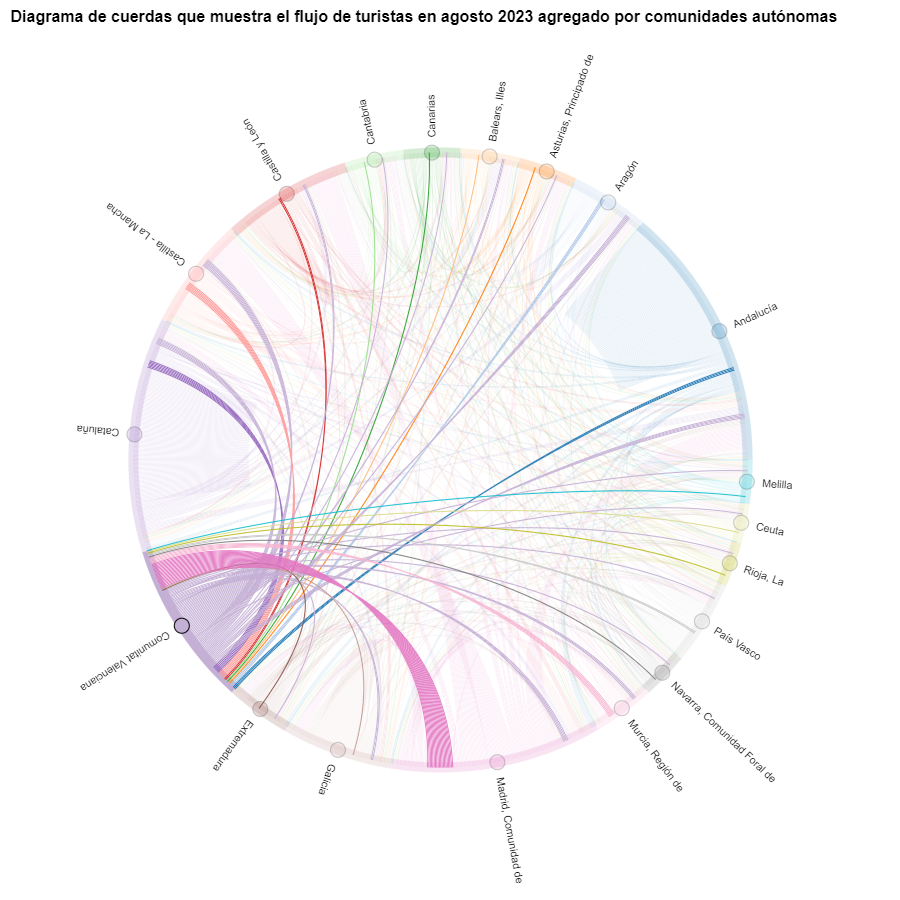
Figure 8. Chord diagram showing the flow of tourists entering and leaving the Valencian Community in August 2023 aggregated by autonomous communities.
The reader can create the same diagram for other time periods, for example, for the summer of 2020, in order to visualize the impact of the pandemic on summer tourism, reusing the function we have created.
For the Sankey diagrams, we will focus on the Valencian Community, as it is a popular holiday destination. We filter the edges we created for the previous chord diagram so that they only contain flows that end in the Valencian Community. The same procedure could be applied to study any other CA or could be inverted to analyze where Valencians go on vacation. We visualize the Sankey diagram which, like the chord diagrams, is interactive within the notebook. The visual aspect would be like this:
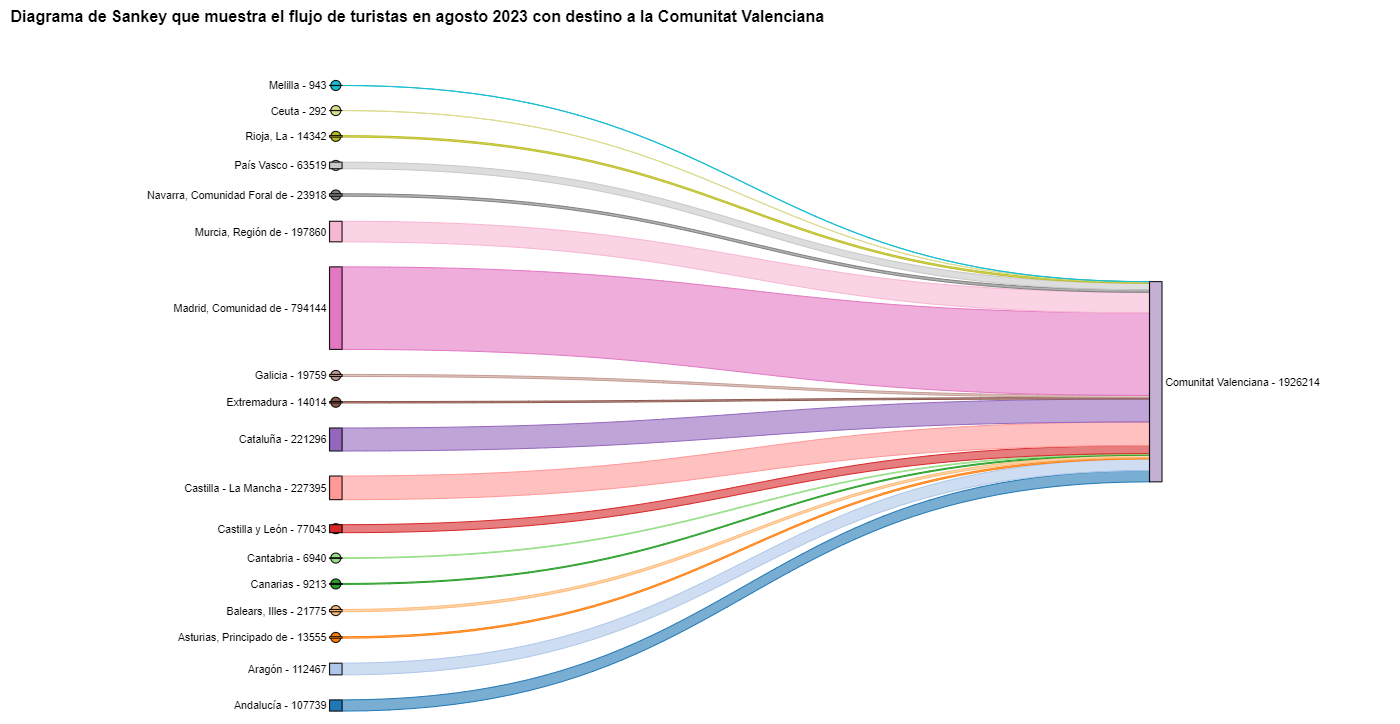
Figure 9. Sankey diagram showing the flow of tourists in August 2023 destined for the Valencian Community.
As we could already intuit from the chord diagram above, see Figure 8, the largest group of tourists arriving in the Valencian Community comes from Madrid. We also see that there is a high number of tourists visiting the Valencian Community from neighboring CCAA such as Murcia, Andalucía, and Catalonia.
To verify that these trends occur in the three provinces of the Valencian Community, we are going to create a Sankey diagram that shows on the left margin all the CCAA and on the right margin the three provinces of the Valencian Community.
To create this Sankey diagram at the provincial level, we have to filter our initial pandas.DataFrame to extract the relevant information from it. The steps in the notebook can be adapted to perform this analysis at the provincial level for any other CA. Although we are not reusing the function we used previously, we can also change the analysis period.
The Sankey diagram that visualizes the tourist flows that arrived in August 2023 to the three Valencian provinces would look like this:
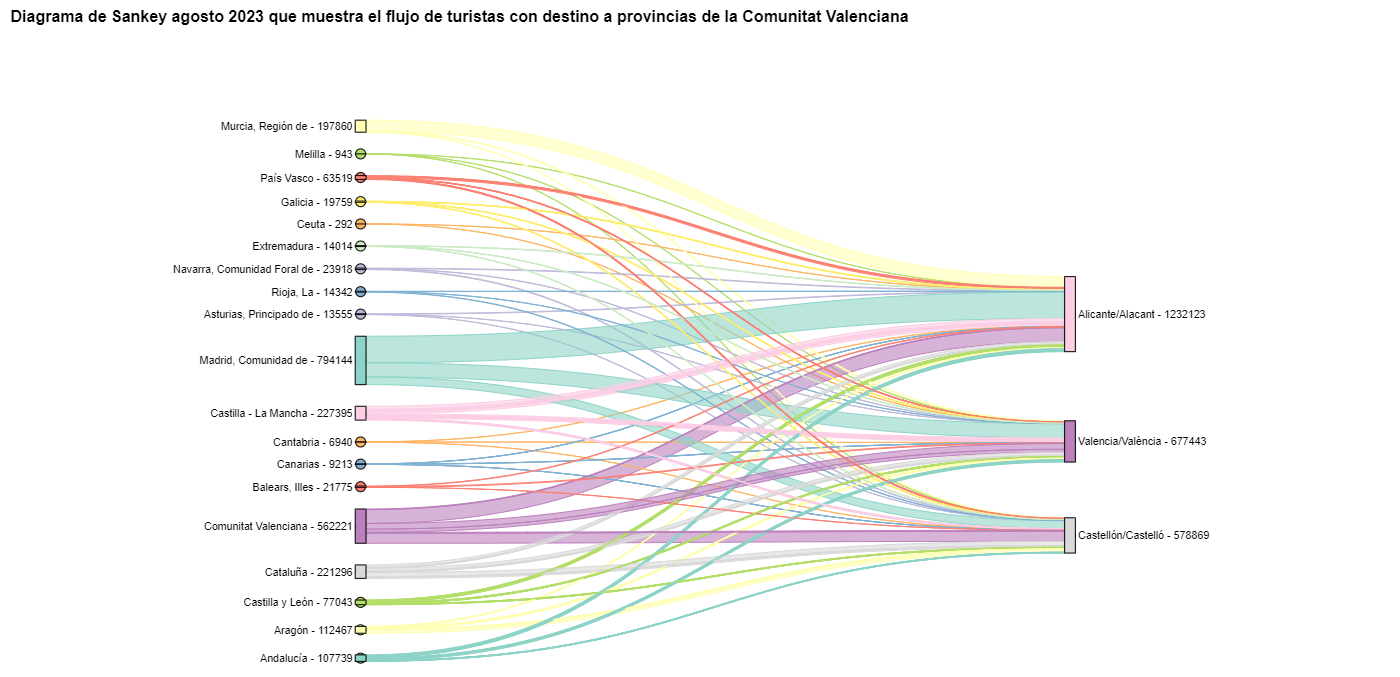
Figure 10. Sankey diagram August 2023 showing the flow of tourists destined for provinces of the Valencian Community.
We can observe that, as we already assumed, the largest number of tourists arriving in the Valencian Community in August comes from the Community of Madrid. However, we can verify that this is not true for the province of Castellón, where in August 2023 the majority of tourists were Valencians who traveled within their own CA.
6. Conclusions of the exercise
Thanks to the visualization techniques used in this exercise, we have been able to observe the tourist flows that move within the national territory, focusing on making comparisons between different times of the year and trying to identify patterns. In both the chord diagrams and the Sankey diagrams that we have created, we have been able to observe the influx of Madrilenian tourists on the Valencian coasts in summer. We have also been able to identify the autonomous communities where tourists leave their own autonomous community the least, such as Catalonia and Andalucía.
7. Do you want to do the exercise?
We invite the reader to execute the code contained in the Google Colab notebook that accompanies this exercise to continue with the analysis of tourist flows. We leave here some ideas of possible questions and how they could be answered:
- The impact of the pandemic: we have already mentioned it briefly above, but an interesting question would be to measure the impact that the coronavirus pandemic has had on tourism. We can compare the data from previous years with 2020 and also analyze the following years to detect stabilization trends. Given that the function we have created allows easily changing the time period under analysis, we suggest you do this analysis on your own.
- Time intervals: it is also possible to modify the function we have been using in such a way that it not only allows selecting a specific time period, but also allows time intervals.
- Provincial level analysis: likewise, an advanced reader with Pandas can challenge themselves to create a Sankey diagram that visualizes which provinces the inhabitants of a certain region travel to, for example, Ourense. In order not to have too many destination provinces that could make the Sankey diagram illegible, only the 10 most visited could be visualized. To obtain the data to create this visualization, the reader would have to play with the filters they apply to the dataset and with the groupby method of pandas, being inspired by the already executed code.
We hope that this practical exercise has provided you with sufficient knowledge to develop your own visualizations. If you have any data science topic that you would like us to cover soon, do not hesitate to propose your interest through our contact channels.
In addition, remember that you have more exercises available in the section "Data science exercises".
Noticia
The III National Open Data Meeting (better known by its acronym ENDA) took place on 31 May 2024 in the Gothic Hall of the Papa Luna Castle, in Peñíscola. The event was organised by the Diputación de Castellón, with the collaboration of the Diputación de Barcelona and the Government of Aragón. This Third Meeting took over from those held in Barcelona and Zaragoza in 2022 and 2023, respectively, thus closing the first cycle of meetings and giving way to three new organisers with new ideas and new challenges to face.
The main theme of the day was the promotion of the tourism sector. The objective was to ensure digitisation and easy access to open data in order to offer quality and sustainable tourism experiences.
Crucial issues related to effective management, strategic analysis and implementation of data in an increasingly information-driven world were addressed during the meeting. Round tables and conclusions of work carried out by experts in the months leading up to the congress provided a comprehensive view of the application of open data in the tourism sector and all its associated activities, with the aim of benefiting not only the public administrations themselves, but also the private sector and the general public.
The III National Open Data Meeting lasted approximately eight hours and was attended by almost 100 people. The organisers decided not to broadcast the event live, as had been done in previous editions, in order to encourage spectators to attend the castle in person.
Start at 08:30 a.m
The event started at 08:30 in the morning with the staggered arrival of attendees and the distribution of accreditations. Half an hour later, at 09:00, the official inauguration of the Meeting was held by Marta Barrachina Mateu, President of the Provincial Council of Castellón. The event welcomed the attendees and thanked the organisers, especially the Diputación de Castellón, for their great work in organising, disseminating and convening the event.
At 09:15 the opening speech was given by José Norberto Mazón López, Professor of Computer Languages and Systems at the University of Alicante. José spoke about the importance of creating a data-driven society, not only at the Spanish level, but also at the European level. He highlighted that there has been an exponential increase in the value of tourism data compared to the first data that started to be collected way back in 2018.
He further stressed that such data is underpinned by 3 main axes, namely public administrations, private businesses and citizens, and that it is crucial that all three entities collaborate with each other to ensure the quality, integrity and reliability of the data.
Table 1: Tourism and the economy: a data space for growth and development
The first round table, entitled "Tourism and economy: a data space to favour growth and development", started at 10:00 and was moderated by Sonia Castro García-Muñoz, Coordinator of the Digital Public Services Department of Red.es. The speakers at this first round table were as follows:
-
Sergio Ballentani, Head of the Comunitat Valenciana Geoportal/Tourist Map.
-
Desam Garcia Sevilla, Technician of product creation for international promotion and tourism of the Diputación de Valencia.
-
José Luis Galar, Head of the Analysis and Strategy Area of Aragon Tourism.
- Francisco Mestre, President of the Network of the Most Beautiful Villages of Spain.
This first round table dealt with the use of geographic data as a driving force for tourism thanks to the interactive services they can offer and which facilitate tourist movement. The need to use European standards to standardise the structure of the datasets and thus optimise the exchange of data between public administrations was also addressed, and it was stressed that Spain is currently the country most visited by tourists and one of the most competitive in the world in the field of tourism, highlighting the role played by private businesses and companies in the sector.
Once the first round table was over, there was a 30-minute break for coffee, stretching the legs and sharing impressions with the speakers and the rest of the attendees.
Table 2: How data can improve experiences and make tourism sustainable
After the break, the second round table, moderated by Borja Colón de Carvajal, Head of the Public Administration and Innovation Service of the Provincial Council of Castellón, began with a debate on how data can improve experiences and make tourism sustainable. This second roundtable featured the following speakers:
-
Virginia Ochoa, Manager of the Castellón Provincial Council's Tourist Board
-
Luis Falcón, President of the ASEDIE Geospatial Commission.
-
Alberto González-Yanes, Deputy Director of Statistical Modernisation of the Canary Islands Statistics Institute (ISTAC).
-
Enrique Crespo, Technical Advisor in the Directorate General for Transparency and Quality of Madrid City Council.
- Juan Carlos Lázaro López, Technical Manager of Open Data of the Government of Navarre.
The main topics discussed on this occasion were the use of open data to solve common problems of today's society in the field of tourism and how an intelligent use of these data can offer competitive advantages to administrations. To this end, a comparison was made of the situation in the province of Castellón, in the Canary Islands, in the city of Madrid and in the Community of Navarre.
This second round table discussion also focused on the main reasons why Spain is year after year one of the favourite destinations for tourists, concluding that up to 80% of visitors are attracted by the sun and beach product offered by our country.
Impact of open data
This was followed at around 13:30 by a brief presentation on a series of methodologies for measuring the impact of open data, given by Roberto Magro, coordinator of the Open Data Working Group of the FEMP Network and Deputy Director General for Youth, Children and Adolescents of Alcobendas City Council. Right after, Alberto Abella, Data Modelling Expert at Fiware presented the 4th report on open data in Spain. This round table was chaired by Ana Coroján, Head of Projects and Research at the NovaGob Foundation.
Roberto began by telling us how even today there are many public administrations that do not believe in data and, as such, either share bad data or do not share it at all. In this sense, he encouraged all attendees to make an effort to raise awareness among other public bodies about the importance of sharing reliable, truthful and quality data. It also called on re-users to make use of these data and make them available to citizens through data products such as visualisations and/or mobile applications.
Alberto presented the conclusions of the Cotec Foundation report on the reuse of open data in Spain. The main key points he highlighted in his presentation were that the number of open data portals had remained stable compared to the previous year, increasing the number of datasets available on them, but at the same time reducing the quality of their metadata, as well as the dissemination of this data to the public. Finally, he regretted that there are still 6% of the datasets that are either outdated or not available at all, which in his view is too high a percentage and should be minimised for the following year.
Table 3: Public management: Data-driven public policies to improve tourism activity
The third and last panel of the event took place after lunch, around 15:45 and was moderated by Vicent Rubio, Open Government Technician of the Castellón Provincial Council. This round table dealt with data-driven public policies to improve tourism activity, and consisted of the following speakers:
-
María Tormo Casañ, Deputy for Participation and Transparency of the Castellón Provincial Council.
-
Montse Giró Torrens, Head of LabTurisme, Diputació de Barcelona.
- Joseba Asiain Albisu, Director General of the Presidency, Open Government and Relations with the Parliament of the Government of Navarre.
This roundtable addressed the main challenges faced by public administrations in opening up data, as well as the key solutions and strategies they have implemented to achieve this, and the benefits these solutions have brought them, especially in the field of tourism.
Among other things, the importance of street surveys was highlighted as a fundamental tool for gaining first-hand knowledge of citizens' impressions, as well as their nationality, motivations and purchasing power, in order to be able to adapt the services offered to their needs.
Conclusions and closing of the event
Finally, the last block of the event was led by Marc Garriga, CEO of DesideDatum and rapporteur of the meeting, in which the main conclusions drawn throughout the session were presented, to finally introduce the next 3 organisers of the next triennium of meetings, which will be, in this order, the Government of the Canary Islands, which will organise the 2025 Meeting, the Government of Navarra, and finally the City Council of Madrid, which will be responsible for hosting the third and final meeting of this second phase.
Finally, as for the challenge for this year, it is still to be defined and the plan is to make it public in the coming weeks, and then include it on the website.
Application
This application designed for iOS devices offers a wide range of tourist activities in the Autonomous Community of Castilla y León. It acts as a travel assistant, allowing you to create an itinerary according to the interests of each user.
TUrMISMO allows you to discover activities to do in the area, save your favourite places or plans, and trace your own route. To do this, it offers geolocated information on places as diverse as tourist offices, restaurants and wineries, organised excursions and ski schools, among many others.
The app was presented this year 2024 to the VII Open Data Competition of Castilla y León and uses open data provided by the Junta de Castilla y León.
Blog
The year 2023 was undoubtedly the year of artificial intelligence. This has brought data, and therefore open data, back to the forefront, as it is the raw material that fuels this technology, which is key to value creation in our increasingly digital economy.
Perhaps that is why 2023 has also left us a number of new developments in terms of the drive to open data, many of which could lead to the creation of significant economic and social value through re-use. One of these developments is the obligation for public sector bodies to open in the first half of 2024 a number of high-value datasets, already specified in a regulation that was published in the last few days of 2022 in order to implement the provisions of open data directive (2019). Specifically, there are six high-value thematic categories: geospatial, earth observation and environmental, meteorology, statistics, companies and company ownership and mobility.
In order to comply with this obligation and with the rest of the obligations set out in Directive 2019/1024, in 2023, Spain has amended the Law 37/2007 on the re-use of public sector information has been amended in Spain in 2023. This amendment emphasises the duty to encourage the openness of high-value data published under an open data attribution licence (CC BY 4.0 or equivalent), in machine-readable format and accompanied by metadata describing the characteristics of the datasets.
The European Statistical System and the National Statistical Plan 2021-2024
Of the six thematic categories, number four, Statistics, is dedicated to statistical datasets, characterised by their broad definition and specification. It is based on the European Statistical System which ensures that European statistics produced in all Member States are reliable, following common criteria and definitions and treating data in an appropriate way, so that they are always comparable between EU countries. Specifically, the regulation defines 21 statistical datasets as high-value (it actually includes 22, but one of them is redundant as it is broken down into three components: population, fertility and mortality).
The National Statistical Institute] is part of the European Statistical System and is in charge of the production of the harmonised national statistics that Eurostat then compiles and analyses to provide comparable figures, so that Community policies can be defined, implemented and analysed.
In Spain, the National Statistical Plan is the main instrument that organises the statistical activity of the General State Administration, the backbone of statistics for state purposes. The current plan was published at the end of 2020, covering the 2021-2024 period.
The National Statistical Plan 2021-2024 includes new strategic lines such as the use of new sources of information, including, for example, Big Data and massive databases. It also promotes new production models, such as experimental statistics, and incorporates a special focus on the inclusion of gender, disability, age and nationality perspectives, as well as improvements in real estate market information, especially on rentals.
High-value statistical datasets
In these strategic lines, the plan does not yet contain any mention of high-value datasets. However, as the plan is developed and implemented through specific annual programmes detailing the statistical operations to be carried out, their objectives, the bodies involved, and the budget appropriations statistical operations to be carried out, their objectives, the bodies involved and the budget appropriations needed to finance them, it is possible to get an idea of which of these statistical operations are aligned with the 21 categories of high value Ssatistical datasets regulation.
The following table shows the possible equivalences:
| High-value statistical datasets | Equivalence in the Inventory of Statistical Operations (IOE) |
|---|---|
| Industrial production | IOE 30050 data sheet, Industrial Production Indices |
| Industrial producer price index breakdowns by activity | IOE 30051 data sheet , Industrial Price Indices |
| Volume of sales by activity | Partially covered by IOE 32092 data sheet Statistics on Sales, Employment and Wages in Large enterprises and SMEs and 32096 data sheet, Daily Domestic Sales. |
| EU International trade in goods statistics | There does not seem to be a clear correspondence in the plan, as the planned statistical operations on international trade are focused on services, while trade in goods is worked out in terms of trade between EU Member States. However, part of the specified data could be found in the IOE 30029 data sheet, Annual National Accounts of Spain: Main Aggregates, although perhaps at a higher level of aggregation than required. |
| Tourism flows in Europe | Many similarities with what is defined in the IOE 16028 data sheet, Statistics on Tourist Movements at Borders (FRONTUR) and 16023, Residents' Tourism Survey (ETR/FAMILITUR). |
| Harmonised Indices of consumer prices | IOE 30180 data sheet, Harmonised Index of Consumer Prices (HICP). |
| National Accounts - key indicators on GDP | IOE 30029 data sheet, Annual National Accounts of Spain: Main Aggregates. |
| National accounts - key indicators on corporations | |
| National accounts- key indicators on households | |
| Government expenditure and revenue | It is reflected in the three IOE data sheets on the settlement of budgets of the different levels of public administration: 31125 data sheet, Budget Settlement Statistics of the State and its Public Bodies, Companies and Foundations; 31030 datasheet Budgets Settlement of the Autonomous Communities (MHAC); and 31026 Budgets Settlement of Local Entities (MHAC). |
| Consolidated government gross debt | |
| Environmental accounts and statistics | It is reflected in the eight data sheet (from 30084 to 30095) of the inventory of statistical operations regarding Environmental Accounts. View listing here. |
| Population | IOE 30264 data sheet, Basic Demographic Indicators. |
| Fertility | |
| Mortality | IOE 30271 data sheet, Mortality Tables. |
| Current healthcare expenditure | IOE 54012 data sheet, Satellite Accounts of Public Health Expenditure |
| Poverty | IOE 30453 data sheet, Living Conditions Survey (LCS). |
| Inequality | |
| Employment | There are quite a few statistical operations that study the labor market, of which the IOE 0308 Labor Force Survey stands out. |
| Unemployment | |
| Potential labour force | IOE 30308 data sheet, Labor force Survey, which also contains worksheet 30309 data sheet, Community Labour Force Survey (CLFS). |
En definitiva, parece que la mayor parte de las variables clave que el reglamento europeo ha previsto para los conjuntos estadísticos de alto valor están ya produciéndose de acuerdo con el plan estadístico nacional vigente. El plan estadístico nacional, que sucederá al actualmente vigente, comenzará en 2025 y a buen seguro se publicará a lo largo de este 2024. Este año veremos en Europa un intenso trabajo para cumplir con las obligaciones del reglamento, ya que, además, la Comisión Europea ha publicado recientemente el informe "Identification of data themes for the extensions of public sector High-Value Datasets" donde se incluyen siete nuevas categorías que se estudia considerar como datos de alto valor y que previsiblemente acabarán siendo incluidas en el reglamento.
All in all, it seems that most of the key variables that the European regulation has foreseen for high value statistical datasets are already being produced according to the existing national statistical plan. The national statistical plan, which will succeed the current one, will start in 2025 and will most likely be published in the course of 2024. This year will see intense work in Europe to comply with the obligations of the regulation, as the European Commission has also recently published the report "Identification of data themes for the extensions of public sector High-Value Datasets" which includes seven new categories that are being considered as high-value datasets and are expected to be included in the regulation and which will foreseeably end up being included in the regulation.
Content prepared by Jose Luis Marín, Senior Consultant in Data, Strategy, Innovation & Digitalization. The contents and views reflected in this publication are the sole responsibility of the author.
Evento
31 May 2024 is the date chosen to celebrate the 3rd National Open Data Meeting organised once again this year by the Provincial Council of Castellón, with the collaboration of the Provincial Council of Barcelona and the Government of Aragon. Under the slogan "Data to boost the tourism sector", experts in the field will meet in a unique setting, Peñíscola Castle, to discuss the importance of the availability and reuse of open data in this sector.
Among other issues, during the event, the importance of open data as a resource for understanding and achieving relevant and sustainable tourismwill be disseminated. This will be done by sharing resources that can benefit different users. The value of open data for implementing innovative technological solutions, e.g. based on artificial intelligence, will also be discussed.
Who is it aimed at?
This is an open event, where any citizen interested in the subject is welcome. In particular, it may be of particular interest to:
- Technicians and professionals in the field of tourism.
- Mayors' offices, councillors' offices, departments and departments of the state, territorial and local administration.
- Journalists and communication professionals.
- Tour operators.
- Responsible for data governance and open data portals of administrations.
What is the programme?
The event will start at 9:00 with the inauguration by María Tormo Casañ, representative of the Diputación de Castellón. It will be followed by the inaugural address by José Norberto Mazón López, professor of computer languages and systems at the University of Alicante.
This will be followed by a series of round tables and presentations:
- 10.00 Table 1. Tourism and the economy: a data space for growth and development.
- 11:30 Coffee break.
- 12:00 Table 2. How data can improve experiences and make tourism sustainable.
- 13.30 Presentation: conclusions of the technical challenges on open data.
- 14:15 Lunch.
- 15.45 Public management roundtable: data-driven public policies to improve tourism activity.
The event will end at 17.30, after the presentation of the conclusions.
How can I register?
The event can only be followed in person, as there will be no live broadcast. As mentioned at the beginning, the event will take place on 31 May in the Gothic hall of Peñíscola Castle. To register you must complete the form available at this link.
The importance of open data in tourism
Open data on tourism allows us to understand the state of the sector so that both tourism businesses and public bodies can make informed decisions to help boost this important economic driver. At the same time, they can serve as a basis for implementing technological solutions that improve the travellers' experience and allow them to easily organise and enjoy their trip. This is the case of some of the applications with information on accommodation, restaurants, tourist sites, activities of interest, etc.
Public bodies are aware of this situation and therefore there are more and more spaces where data on this issue can be shared. In this sense, we find national initiatives, such as Dataestur or promoted by autonomous regional bodies, such as the asturias tourism data catalogue. For its part, the Castellón Provincial Council is currently developing a specific area on tourism in its Open Data Portal specific space on tourism in its Open Data Portal, which aims to bring together all the knowledge which aims to bring together all the knowledge generated around the 3rd National Open Data Meeting.
If you are interested in the subject, in the tourism sectorial of datos.gob.es you will find featured datasets, news and analysis articles, as well as examples of applications and companies reusers that base their activity on open data from the tourism sector.
Events such as the III National Open Data Meeting are another interesting opportunity to keep up to date with developments in the sector. Remember that you can sign up through this link.
Application
This mobile application developed by the City Council of Ourense allows you to consult updated information about the city: news, notices or upcoming events on different topics such as:
- Arts and festivities: Cultural events organized by the city council.
- Tourism: Information about thermal facilities, tourist attractions, heritage, routes and gastronomy.
- Notifications: Real time notifications about possible traffic cuts, opening of monuments or other specific issues.
- Information: Data of general interest such as emergency telephone numbers or citizen services of the city council.
The mOUbil app, developed through local open data sets, unifies all the information of interest to the neighbors of Ourense, as well as tourists who want to know the city. In addition, anyone can make suggestions for improvement on the application through this form: Queries and Suggestions (ourense.gal).
Your download is available for both Android mOUbil - Ourense no peto! - Apps in Google Play and iOS: moubil - Ourense no peto! in App Store (apple.com)
Application
The application shows all public wireless networks in the city of Valencia and allows its geolocation. It offers a map to identify the location of the network and a free text field to insert any comment. It also has a detailed screen with which the user can rate from 1 to 5 the quality of the installation and the signal.
All this is stored on the device so that nothing is lost when closing the application.
The application is available in English, Spanish, Chinese and Japanese.
Blog
In the vast technological landscape, few tools have made as deep a mark as Google Maps. Since its inception, this application has become the standard for finding and navigating points of interest on maps. But what happens when we look for options beyond the ubiquitous map application? In this post we review possible alternatives to the well-known Google application.
Introduction
At the beginning of 2005, Google's official blog published a brief press release in which they presented their latest creation: Google Maps. To get an idea of what 2005 was like, technologically speaking, it is enough to look at the most groundbreaking mobile terminals that year:

Imagen credits: Cinco móviles que marcaron el año 2005
Some of us still remember what the experience (or lack of experience) of running apps on these terminals was like. Well, in that year the first version of Google Maps was launched, allowing us to search for restaurants, hotels and other elements near our location, as well as to find out the best route to go from point A to point B on a digital version of a map of our city. In addition, that same year, Google Earth was also launched, which represented a real technological milestone by providing access to satellite images for almost all citizens of the world.
Since then, Google's digital mapping and navigation ecosystem, with its intuitive interface and innovative augmented reality features, has been a beacon guiding millions of users on their daily journeys.
But what if we are looking for something different? What alternatives are there for those who want to explore new horizons? Join us on this journey as we venture into the fascinating world of your competitors. From more specialized options to those that prioritize privacy, we will discover together the various routes we can take in the vast landscape of digital navigation.
Alternatives to Google Maps
Almost certainly some of you readers have seen or used some of the open source alternatives to Google Maps, although you may not know it. Just to mention some of the most popular alternatives:
-
OpenStreetMap (OSM): OpenStreetMap is a collaborative project that creates a community-editable map of the world. It offers free and open geospatial data that can be used for a variety of applications, from navigation to urban analysis.
-
uMap: uMap is an online tool that allows users to create custom maps with OpenStreetMap layers. It is easy to use and offers customization options, making it a popular choice for quick creation of interactive maps.
-
GraphHopper: GraphHopper is an open source routing solution that uses OpenStreetMap data. It stands out for its ability to calculate efficient routes for vehicles, bicycles and pedestrians, and can be used as part of custom applications.
-
Leaflet: Leaflet is an open source JavaScript library for interactive maps compatible with mobile devices. It is probably the most widespread library because of its low KB weight and because it includes all the mapping functions that most developers might need.
-
Overture Maps: While the previous four solutions are already widely established in the market, Overture Maps is a new player. It is a collaborative project to create interoperable open maps.
Of all of them, we are going to focus on OpenStreetMap (OSM) and Overture Maps.
Open Street Maps: an open and collaborative tool
Of the aforementioned solutions, probably the most widespread and well-known is Open Street Maps.
OpenStreetMap (OSM) stands out as one of the best open source alternatives to Google Maps for several reasons:
-
First, the fundamental characteristic of OpenStreetMap lies in its collaborative and open nature, where a global community contributes to the creation and constant updating of geospatial data.
-
In addition, OpenStreetMap provides free and accessible data that can be used flexibly in a wide range of applications and projects. To quote verbatim from their website: OpenStreetMap is open data: you are free to use it for any purpose as long as you credit OpenStreetMap and its contributors. If you modify or build upon the data in certain ways, you may distribute the result only under the same license. See the Copyright and License page for more details.
-
The ability to customize maps and the flexibility of OpenStreetMap integration are also outstanding features. Developers can easily tailor maps to the specific needs of their applications by leveraging the OpenStreetMap API. This is the key to the development of an ecosystem of applications around OSM such as uMap, Leaflet or GraphHopper, among many others.
Overture Maps. A unique competitor
Perhaps, one of the most promising projects to have recently appeared on the global technology scene is Overture Maps. As indicated (last July of this year) by its foundation (OMF Overture Maps Foundation), it has released its first open dataset, marking a significant milestone in the collaborative effort to create interoperable open map products. The first Overture release includes four unique data layers:
-
Places of Interest (POIs)
-
Buildings
-
Transportation Network
-
Administrative Boundaries

Example coverage of public places worldwide identified in the initial project dataset. The first version of the overture maps dataset contains, among others, 59 million records of points of interest, 780 million buildings, transport networks and national and regional administrative boundaries worldwide.
These layers, which merge various open map data sources, have been validated and contrasted through quality checks and are released under the Overture Maps data schema, made public in June 2023. Specifically, the Places of Interest layer includes data on more than 59 million places worldwide. This dataset is presented as a fundamental building block for navigation, local search and for various location-based applications. The other three layers include detailed building information (with more than 780 million building footprints worldwide), a global transportation network derived from the OpenStreetMap project, and worldwide administrative boundaries with regional names translated into more than 40 languages.
Perhaps one of the most significant pieces of information in this announcement is the number of collaborators that have come together to realize this project. The Overture collaboration, founded in December 2022 by Amazon Web Services (AWS), Meta, Microsoft and TomTom, now boasts more than a dozen geospatial and technology companies, including new members such as Esri, Cyient, InfraMappa, Nomoko, Precisely, PTV Group, SafeGraph, Sanborn and Sparkgeo. The central premise of this collaboration is the need to share map data as a common asset to support future applications.
As a good open source project, the Overture Foundation has made available to the development community a Github repository where they can contribute to the project.
In short, digital maps, their corresponding geospatial data layers, navigation and photo-geolocation capabilities are vital and strategic assets for social and technological organizations around the world. Now, with the 20th anniversary of the birth of Google Maps just around the corner, there are good open source alternatives and the big players in the international technology landscape are coming together to generate even more valuable spatial assets. Who will win this new race? We don't know, but we will keep a close eye on the current news on this topic.
Evento
On November 9, Valencia will host the DataBeersVLC no29 event, jointly organized by the DataBeersVLC collective and the Open Government area of the Valencia City Council, which can also be followed live on the Internet. The program includes four talks on data, three of which will focus on open data.
DataBeers is a non-profit initiative that is present all over the world. This organization aims to create a worldwide community of data lovers and for this purpose organizes events open to the general public, where they share the most advanced results and methods in Data Science in an understandable way in an informal environment. DataBeers was born in Madrid in 2014 but has already spread around the world and is currently present in 25 cities in different countries.
In Spain it has presence in Madrid, Barcelona, Málaga o Valencia, among other locations. In the latter, the DataBeersVLC community that was born in 2016, organizes the fourth edition of AI & Dataviz on November 9 at 19:00h at the Centro de Cultura Contemporánea Octubre. In line with its goal of bringing data closer to all types of audiences, the meeting will be streamed live through its Youtube channel. In addition, all talks will be recorded and can be viewed later through the same medium.
Open data in the fight against climate change, the improvement of tourism and agriculture
The day's program includes four talks. As usual in DataBeers events, the talks will be short, around ten minutes, in a language that can be understood by all kinds of audiences. The relaxed atmosphere created and the didactic tone of the speakers make it possible to bring the world of data closer to the attendees.
On this occasion, the first talk will deal with 'Air quality in Valencia' and will be given by Inmaculada Coma, professor of the Department of Computer Science at the University of Valencia and director of the Chair of Artificial Intelligence and Information Visualization of this academic institution.
This talk will present the data from the different monitoring network stations of the city of Valencia that are available in tne open data portal of the City Council and will review the evolution of pollution in the city thanks to the analysis and visualization of this information. This is an example of how open data can help to raise public awareness in a context of climate change and energy transition.
Another of the topics to be addressed at this meeting is tourism, where open data is playing a key role in the sector's transition towards sustainability and digitalization. Laya Targa, data scientist, will present a 'Visualization and optimization of tourist routes in the city of Valencia'. Targa is a member of the Data Interaction and Augmentation Research Group (DINA) and a technician in the ClioViz project at the Institute of Robotics and Information and Communication Technologies (IRTIC) at the University of Valencia. The talk will address some of the innovative data-driven strategies that serve to improve the planning and enjoyment of routes through different monuments in the city. It will explore visualization techniques and demonstrate how routes can be optimized thanks to data and achieve a better experience for tourists that is at the same time respectful of the city and its inhabitants.
Ferran Fernandez will address a talk on data farming, specifically on 'Saving water with predictive irrigation models'. Fernandez, a specialist in AgTech, will start from the fact that agriculture consumes the largest amount of fresh water in the world, with emphasis on the increasingly frequent episodes of extreme droughts. Thus, he will delve into the need to establish strategies that enable more efficient, sustainable and profitable agriculture.
In this area, we cannot forget that the digital transformation is enabling the agricultural sector to modernize and move towards what is known as precision agriculture. In this process, data is a fundamental tool for farmers to know exactly what is happening in their crops and to be able to make more efficient decisions in terms of production and more environmentally sustainable. Water resource management is a key part of this process and this talk will explore in depth the new possibilities that open data offers in this area.
In addition to the applications of open data in different sectors, during the conference Ricard Martínez, director of the Microsoft Chair of Privacy and Digital Transformation at the University of Valencia, will talk about data protection, a topic that usually arouses great interest among citizens. In the era of artificial intelligence that we are beginning, privacy is one of the main concerns and for this, it is necessary to maintain the balance between open access to information and the protection of personal data to ensure the privacy of individuals. The talk will discuss how to protect them from the design and traceability, fleeing from radical solutions such as prohibiting the processing of data.
In short, the program of the fourth edition of AI & Dataviz organized by DataBeersVLC will show the use of open data in areas with a direct and very visible impact on society. The dissemination of the use of open data is essential to promote trust in data and digital infrastructures, as well as to raise public awareness of some of the challenges we face today, such as climate change.
To attend the event in person, all you need to do is register here. It is also possible to follow the live webcast by connecting to the DataBeersVLC channel on YouTube.
Blog
Europe is developing a common data space for tourism, aiming to integrate various stakeholders, including local and regional authorities, the private sector, and multiple member states. Spain is among them, where several workshops have already been conducted as part of the process to energize the national tourism data space, focusing on discussing the challenges, opportunities, and use cases in the sector.
The future tourism data space is at the core of the transition towards greater sustainability and profound digitization in the tourism sector. This initiative is also aligned with the European data strategy, which envisions creating a single market where information can be freely shared, promoting innovation across different economic sectors and certain areas of public interest. Furthermore, future data spaces hold significant importance in Europe's quest to regain digital sovereignty, reasserting control over data, fostering innovation, and the ability to develop and implement its own legislation in the digital environment.
Even in last year's conference on the Future of the European Union, the importance of data spaces in sectors like tourism and mobility was highlighted, recognizing them as key sectors in the digital transformation. Tourism, in particular, stands to benefit greatly from such initiatives due to its dynamic and ever-evolving nature, heavily reliant on user experiences and the timely access to necessary information.
Therefore, the European common data space for tourism aims to boost data exchange and reuse, establishing a governance model that respects existing legislation. The ultimate goal is to benefit all stakeholders in various ways, including:
- Promoting innovation in the sector by enhancing and personalizing services through access to high-quality information.
- Assisting public authorities in making data-driven decisions for the sustainability of their tourism offerings.
- Supporting specialized businesses in providing better services based on data analysis and market trends.
- Facilitating market access for sector businesses in Europe.
- Improving data availability for the creation of high-quality official statistics.
However, there are several challenges in sharing existing data in the tourism sector, primarily stemming from concerns regarding reciprocity and data reuse. These challenges can be summarized as follows:
- Data interoperability: Designing and managing a European tourist experience involves handling a wide array of non-personal data across various domains like mobility, environmental management, or cultural heritage, all of which enrich the tourist experience. The primary challenge in this regard is the ability to share and cross-reference information from different sources without duplications, with a reference framework that promotes interoperability between different sectors, utilizing existing standards where possible.
- Data access: Unlike other sectors, the European Union's tourism ecosystem lacks a single marketplace platform. Various offerings are modeled and cataloged by different actors, both public and private, at national, regional, or local levels. While the tourism data space does not aim to serve as a central booking node, it can greatly contribute by providing effective information search tools, facilitating access to necessary data, decision-making, and fostering innovation in the sector.
- Data provision by public and private entities: There is a wide variety of data in this sector, from open data like schedules and weather conditions to private and commercial data such as search, bookings, and payments. A significant portion of these commercial data are managed by a small group of large private entities, making it necessary to establish inclusive dialogue for fair and appropriate rules on data access within the shared data space.
To consolidate this initiative, the Transition Path for Tourism emphasizes the need to advance in the creation and optimization of a specific data space for the tourism sector. This aims to modernize and enhance this crucial economic sector in Europe through key actions:
- Governance: The governance of the tourism data space will determine how the main enablers will relate to ensure interoperability. The goal is to ensure that data is accessed, shared, and used lawfully, fairly, transparently, proportionally, and without discrimination to build trust, support research, and foster innovation within the sector.
- Semantics for interoperability: Common data models and vocabularies are needed for effective interoperability. National statistical agencies and Eurostat already have some consensus definitions, but their adoption within the tourism sector remains uneven. Therefore, clarifying definitions within the multilingual European context is crucial to establish a common European data model, accompanied by implementation guidelines. Spain has already made pioneering efforts in semantic interoperability, such as the development of the Tourism Ontology, technical standards for semantic applied to smart tourism destinations, or the model for collecting, exploiting, and analyzing tourism data.
- Technical standards for interoperability: The Data Spaces Support Center (DSSC) is already working to identify common technical standards that can be reused, taking into account existing or ongoing initiatives and regulatory frameworks. Additionally, all data spaces will also benefit from Simpl, a cloud federation middleware that will serve as a foundation for major data initiatives funded by the European Commission. Furthermore, there are specific technical standards in the sector, such as those developed by Eurostat for sharing accommodation data.
- Defining the role of the private sector: The European common data space for tourism will clearly benefit from cooperation with the private sector and the market for new services and tools it can offer. Some platforms already share data with Eurostat, and new agreements are being developed to share other non-personal tourism data, along with the creation of a new code of conduct to foster trust among various stakeholders.
- Supporting SMEs in the transition to a data space: The European Commission has long provided specific support to SMEs through Digital Innovation Hubs (DIHs) and the Enterprise Europe Network (EEN), offering technical and financial support, as well as assistance in developing new digital skills. Some of these centers specialize in tourism. Additionally, the European Tourism Enterprises Network (SGT), with 61 members in 23 countries, also provides support for digitalization and internationalization. This support for SMEs is particularly relevant given that they represent nearly all of the companies in the tourism sector, specifically 99.9%, of which 91% are microenterprises.
- Supporting tourism destinations in the transition to a data space: Tourism destinations must integrate tourism into their urban plans to ensure sustainable and beneficial tourism for residents and the environment. Several Commission initiatives enhance the availability of necessary information for tourism management and the exchange of best practices, promoting cooperation among destinations and proposing actions to improve digital services.
- Proof of concept for the tourism data space: The European Commission, along with several member states and private actors, is currently conducting a series of pilot tests for tourism data spaces through the DSFT and DATES coordination and support actions (CSAs). The main goal of these tests is to align with existing technical standards for accommodation data and demonstrate the value of interoperability and business models that arise from data sharing through a realistic and inclusive approach, focusing on short-term rentals and accommodation. In Spain, the report on the state of the tourism data space explains the current status of the national data space design.
In conclusion, the European Commission is firmly committed to supporting the creation of a space where tourism-related data flows while respecting the principles of fairness, accessibility, security, and privacy, in line with the European data strategy and the Pact for Skills development. The goal is to build a common data space for tourism that is progressive, robust, and integrated within the existing interoperability framework. To achieve this, the Commission urges all stakeholders to share data for the mutual benefit of everyone involved in an ecosystem that will be crucial for the entire European economy.
At the end of October, there will also be a new opportunity to learn more about the tourism data space and the challenges associated with data spaces in general, through the European Big Data Value Forum in Valencia.
Content created by Carlos Iglesias, Open Data Researcher and Consultant, World Wide Web Foundation.
The content and viewpoints reflected in this publication are the sole responsibility of the author.