Documentación
1. Introduction
Visualizations are graphical representations of the data allowing to transmit in a simple and effective way related information. The visualization capabilities are extensive, from basic representations, such as a line chart, bars or sectors, to visualizations configured on control panels or interactive dashboards.
In this "Step-by-Step Visualizations" section we are periodically presenting practical exercises of open data visualizations available in datos.gob.es or other similar catalogs. They address and describe in an easy manner stages necessary to obtain the data, to perform transformations and analysis relevant to finally creating interactive visualizations, from which we can extract information summarized in final conclusions. In each of these practical exercises simple and well-documented code developments are used, as well as open-source tools. All generated materials are available for reuse in the GitHub repository.
In this practical exercise, we made a simple code development that is conveniently documented relying on free to use tools.
Access the data lab repository on Github
Run the data pre-procesing code on top of Google Colab
2. Objective
The main scope of this post is to show how to generate a custom Google Maps map using the "My Maps" tool based on open data. These types of maps are highly popular on websites, blogs and applications in the tourism sector, however, the useful information provided to the user is usually scarce.
In this exercise, we will use potential of the open-source data to expand the information to be displayed on our map in an automatic way. We will also show how to enrich open data with context information that significantly improves the user experience.
From a functional point of view, the goal of the exercise is to create a personalized map for planning tourist routes through the natural areas of the autonomous community of Castile and León. For this, open data sets published by the Junta of Castile and León have been used, which we have pre-processed and adapted to our needs in order to generate a personalized map.
3. Resources
3.1. Datasets
The datasets contain different tourist information of geolocated interest. Within the open data catalog of the Junta of Castile and León, we may find the "dictionary of entities" (additional information section), a document of vital importance, since it defines the terminology used in the different data sets.
- Viewpoints in natural areas
- Observatories in natural areas
- Shelters in natural areas
- Trees in natural areas
- Park houses in natural areas
- Recreational areas in natural areas
- Registration of hotel establishments
These datasets are also available in the Github repository.
3.2. Tools
To carry out the data preprocessing tasks, the Python programming language written on a Jupyter Notebook hosted in the Google Colab cloud service has been used.
"Google Colab" also called " Google Colaboratory", is a free cloud service from Google Research that allows you to program, execute and share from your browser code written in Python or R, so it does not require installation of any tool or configuration.
For the creation of the interactive visualization, the Google My Maps tool has been used.
"Google My Maps" is an online tool that allows you to create interactive maps that can be embedded in websites or exported as files. This tool is free, easy to use and allows multiple customization options.
If you want to know more about tools that can help you with the treatment and visualization of data, you can go to the section "Data processing and visualization tools".
4. Data processing and preparation
The processes that we describe below are commented in the Notebook which you can run from Google Colab.
Before embarking on building an effective visualization, we must carry out a prior data treatment, paying special attention to obtaining them and validating their content, ensuring that they are in the appropriate and consistent format for processing and that they do not contain errors.
The first step necessary is performing the exploratory analysis of the data (EDA) in order to properly interpret the starting data, detect anomalies, missing data or errors that could affect the quality of the subsequent processes and results. If you want to know more about this process, you can go to the Practical Guide of Introduction to Exploratory Data Analysis.
The next step is to generate the tables of preprocessed data that will be used to feed the map. To do so, we will transform the coordinate systems, modify and filter the information according to our needs.
The steps required in this data preprocessing, explained in the Notebook, are as follows:
- Installation and loading of libraries
- Loading datasets
- Exploratory Data Analysis (EDA)
- Preprocessing of datasets
During the preprocessing of the data tables, it is necessary to change the coordinate system since in the source datasets the ESTR89 (standard system used in the European Union) is used, while we will need them in the WGS84 (system used by Google My Maps among other geographical applications). How to make this coordinate change is explained in the Notebook. If you want to know more about coordinate types and systems, you can use the "Spatial Data Guide".
Once the preprocessing is finished, we will obtain the data tables "recreational_natural_parks.csv", "rural_accommodations_2stars.csv", "natural_park_shelters.csv", "observatories_natural_parks.csv", "viewpoints_natural_parks.csv", "park_houses.csv", "trees_natural_parks.csv" which include generic and common information fields such as: name, observations, geolocation,... together with specific information fields, which are defined in details in section "6.2 Personalization of the information to be displayed on the map".
You will be able to reproduce this analysis, as the source code is available in our GitHub account. The code can be provided through a document made on a Jupyter Notebook once loaded into the development environment can be easily run or modified. Due to informative nature of this post and to favor understanding of non-specialized readers, the code is not intended to be the most efficient, but rather to facilitate its understanding so you could possibly come up with many ways to optimize the proposed code to achieve similar purposes. We encourage you to do so!
5. Data enrichment
To provide more related information, a data enrichment process is carried out on the dataset "hotel accommodation registration" explained below. With this step we will be able to automatically add complementary information that was initially not included. With this, we will be able to improve the user experience during their use of the map by providing context information related to each point of interest.
For this we will apply a useful tool for such kind of a tasks: OpenRefine. This open-source tool allows multiple data preprocessing actions, although this time we will use it to carry out an enrichment of our data by incorporating context by automatically linking information that resides in the popular Wikidata knowledge repository.
Once the tool is installed on our computer, when executed – a web application will open in the browser in case it is not opened automatically.
Here are the steps to follow.
Step 1
Loading the CSV into the system (Figure 1). In this case, the dataset "Hotel accommodation registration".
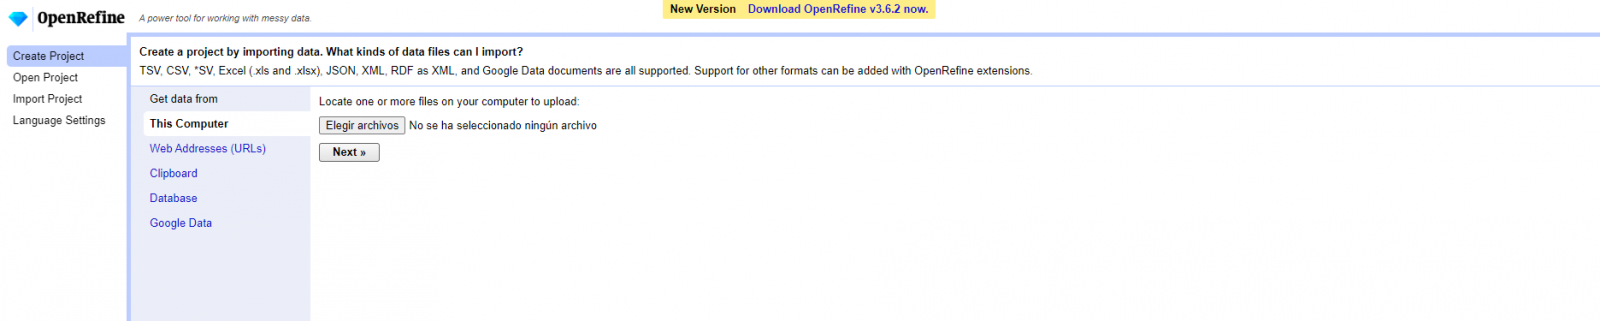
Figure 1. Uploading CSV file to OpenRefine
Step 2
Creation of the project from the uploaded CSV (Figure 2). OpenRefine is managed by projects (each uploaded CSV will be a project), which are saved on the computer where OpenRefine is running for possible later use. In this step we must assign a name to the project and some other data, such as the column separator, although the most common is that these last settings are filled automatically.
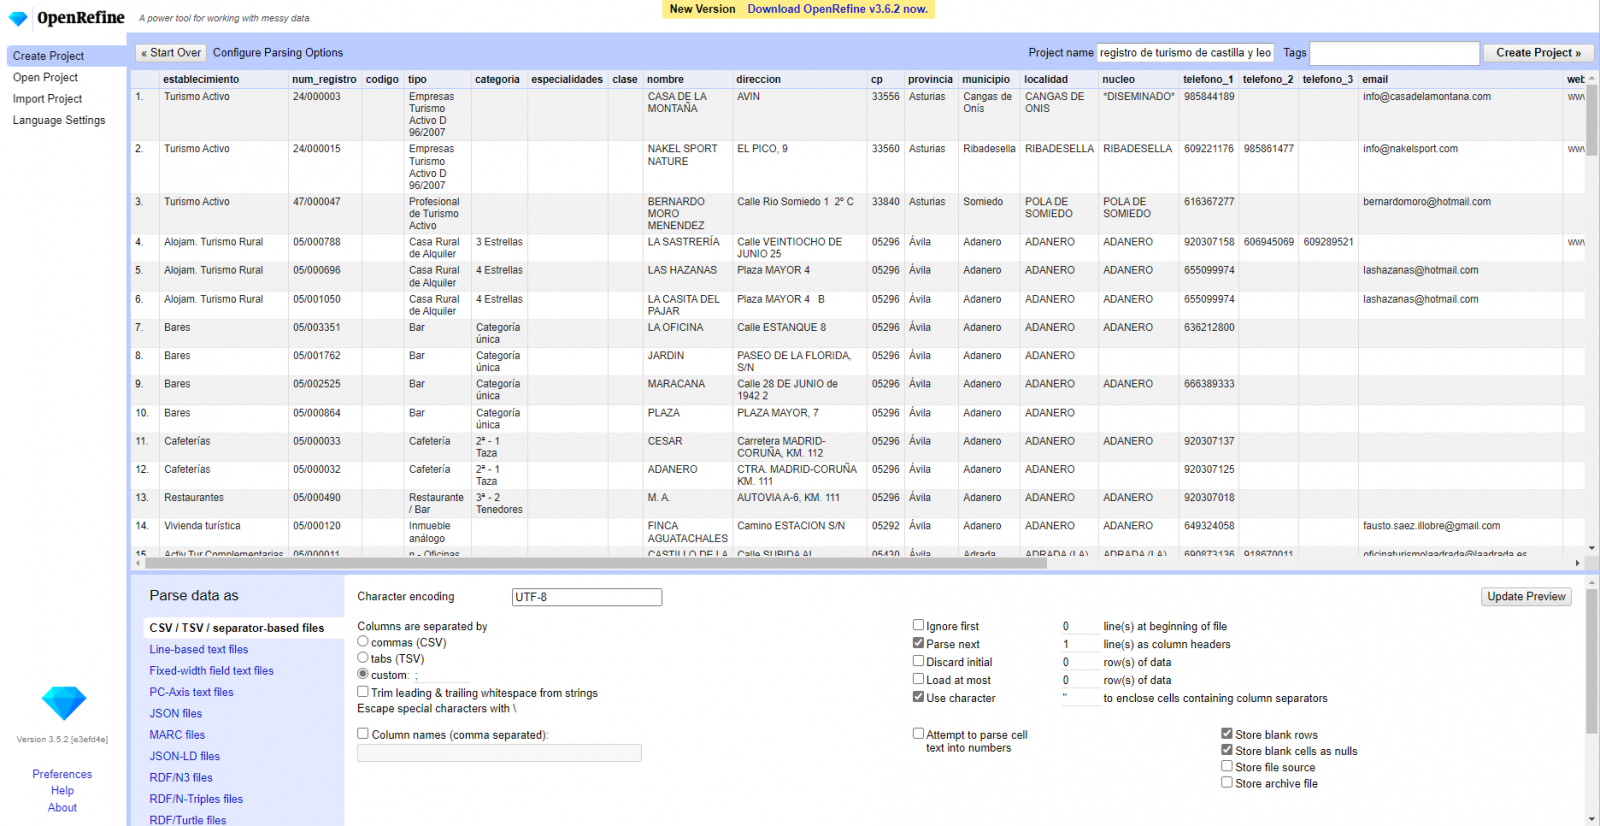
Figure 2. Creating a project in OpenRefine
Step 3
Linked (or reconciliation, using OpenRefine nomenclature) with external sources. OpenRefine allows us to link resources that we have in our CSV with external sources such as Wikidata. To do this, the following actions must be carried out:
- Identification of the columns to be linked. Usually, this step is based on the analyst experience and knowledge of the data that is represented in Wikidata. As a hint, generically you can reconcile or link columns that contain more global or general information such as country, streets, districts names etc., and you cannot link columns like geographical coordinates, numerical values or closed taxonomies (types of streets, for example). In this example, we have the column "municipalities" that contains the names of the Spanish municipalities.
- Beginning of reconciliation (Figure 3). We start the reconciliation and select the default source that will be available: Wikidata. After clicking Start Reconciling, it will automatically start searching for the most suitable Wikidata vocabulary class based on the values in our column.
- Obtaining the values of reconciliation. OpenRefine offers us an option of improving the reconciliation process by adding some features that allow us to conduct the enrichment of information with greater precision.
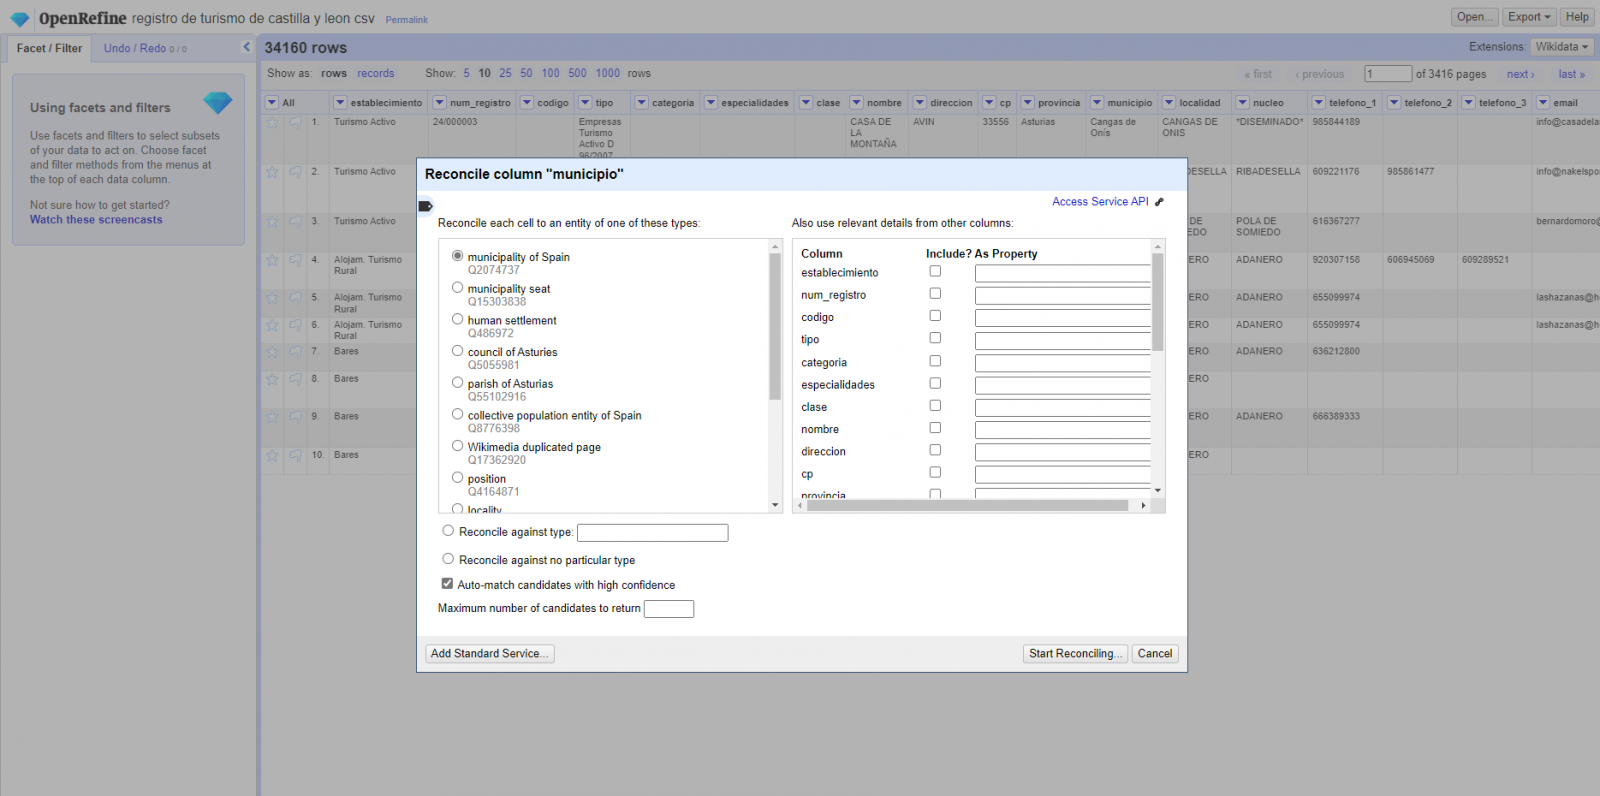
Figure 3. Selecting the class that best represents the values in the "municipality"
Step 4
Generate a new column with the reconciled or linked values (Figure 4). To do this we need to click on the column "municipality" and go to "Edit Column → Add column based in this column", where a text will be displayed in which we will need to indicate the name of the new column (in this example it could be "wikidata"). In the expression box we must indicate: "http://www.wikidata.org/ entity/"+cell.recon.match.id and the values appear as previewed in the Figure. "http://www.wikidata.org/entity/" is a fixed text string to represent Wikidata entities, while the reconciled value of each of the values is obtained through the cell.recon.match.id statement, that is, cell.recon.match.id("Adanero") = Q1404668
Thanks to the abovementioned operation, a new column will be generated with those values. In order to verify that it has been executed correctly, we click on one of the cells in the new column which should redirect to the Wikidata webpage with reconciled value information.
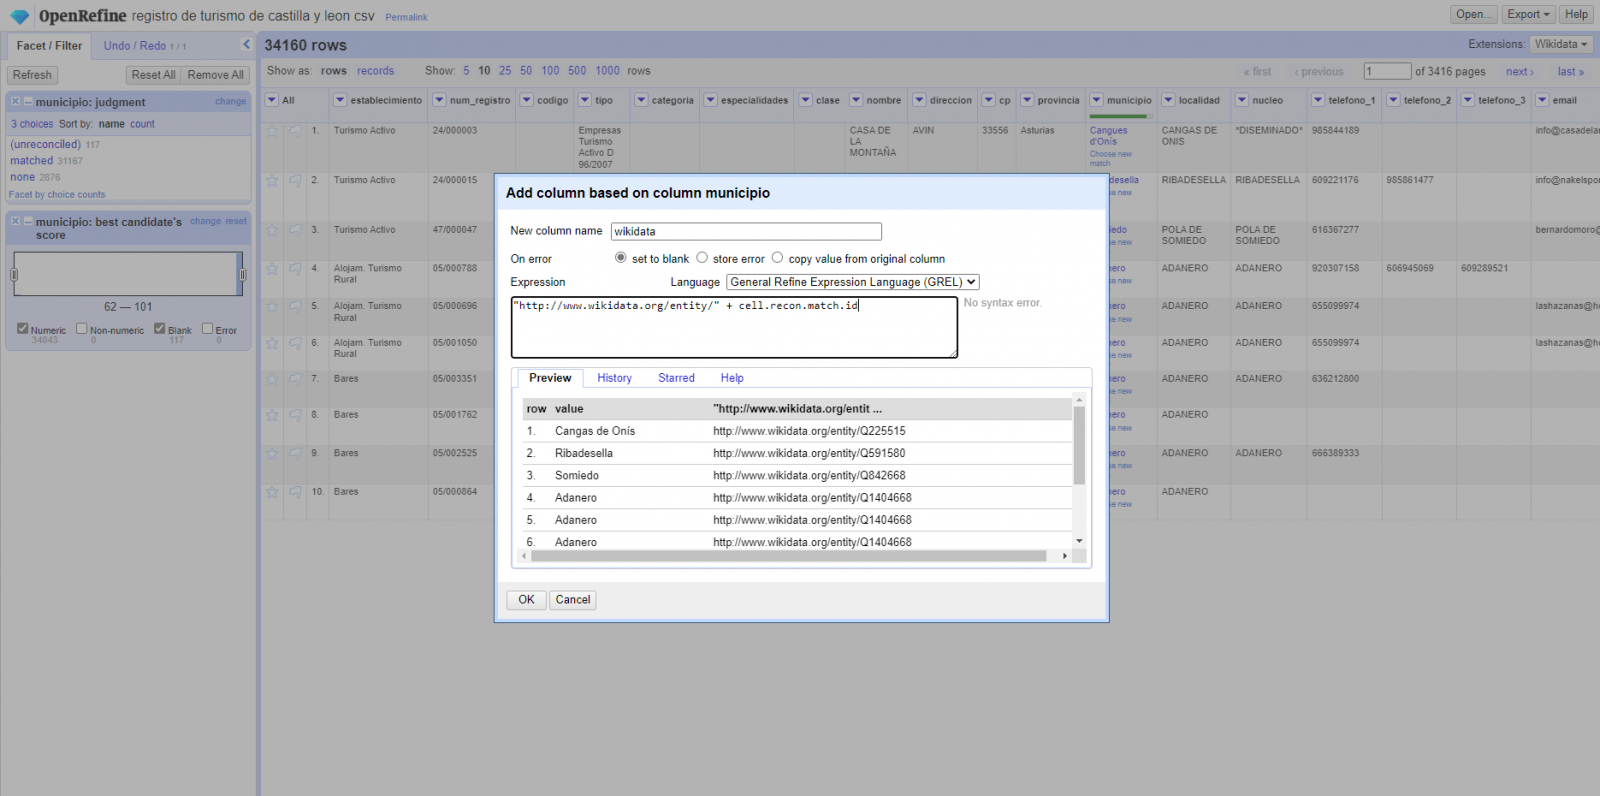
Figure 4. Generating a new column with reconciled values
Step 5
We repeat the process by changing in step 4 the "Edit Column → Add column based in this column" with "Add columns from reconciled values" (Figure 5). In this way, we can choose the property of the reconciled column.
In this exercise we have chosen the "image" property with identifier P18 and the "population" property with identifier P1082. Nevertheless, we could add all the properties that we consider useful, such as the number of inhabitants, the list of monuments of interest, etc. It should be mentioned that just as we enrich data with Wikidata, we can do so with other reconciliation services.
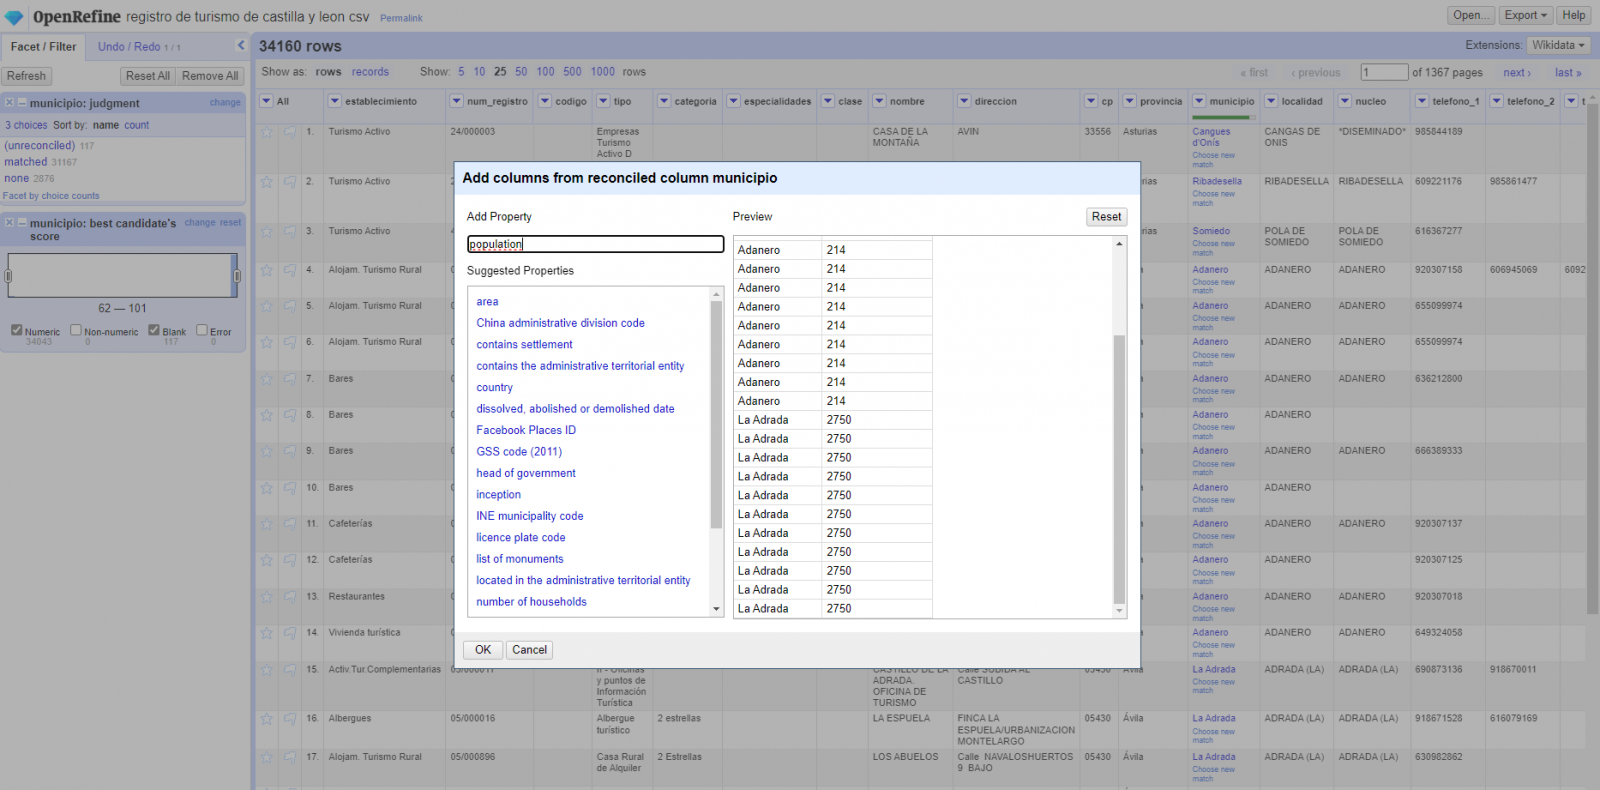
Figura 5. Choice of property for reconciliation
In the case of the "image" property, due to the display, we want the value of the cells to be in the form of a link, so we have made several adjustments. These adjustments have been the generation of several columns according to the reconciled values, adequacy of the columns through commands in GREL language (OpenRefine''s own language) and union of the different values of both columns. You can check these settings and more techniques to improve your handling of OpenRefine and adapt it to your needs in the following User Manual.
6. Map visualization
6.1 Map generation with "Google My Maps"
To generate the custom map using the My Maps tool, we have to execute the following steps:
- We log in with a Google account and go to "Google My Maps", with free access with no need to download any kind of software.
- We import the preprocessed data tables, one for each new layer we add to the map. Google My Maps allows you to import CSV, XLSX, KML and GPX files (Figure 6), which should include associated geographic information. To perform this step, you must first create a new layer from the side options menu.
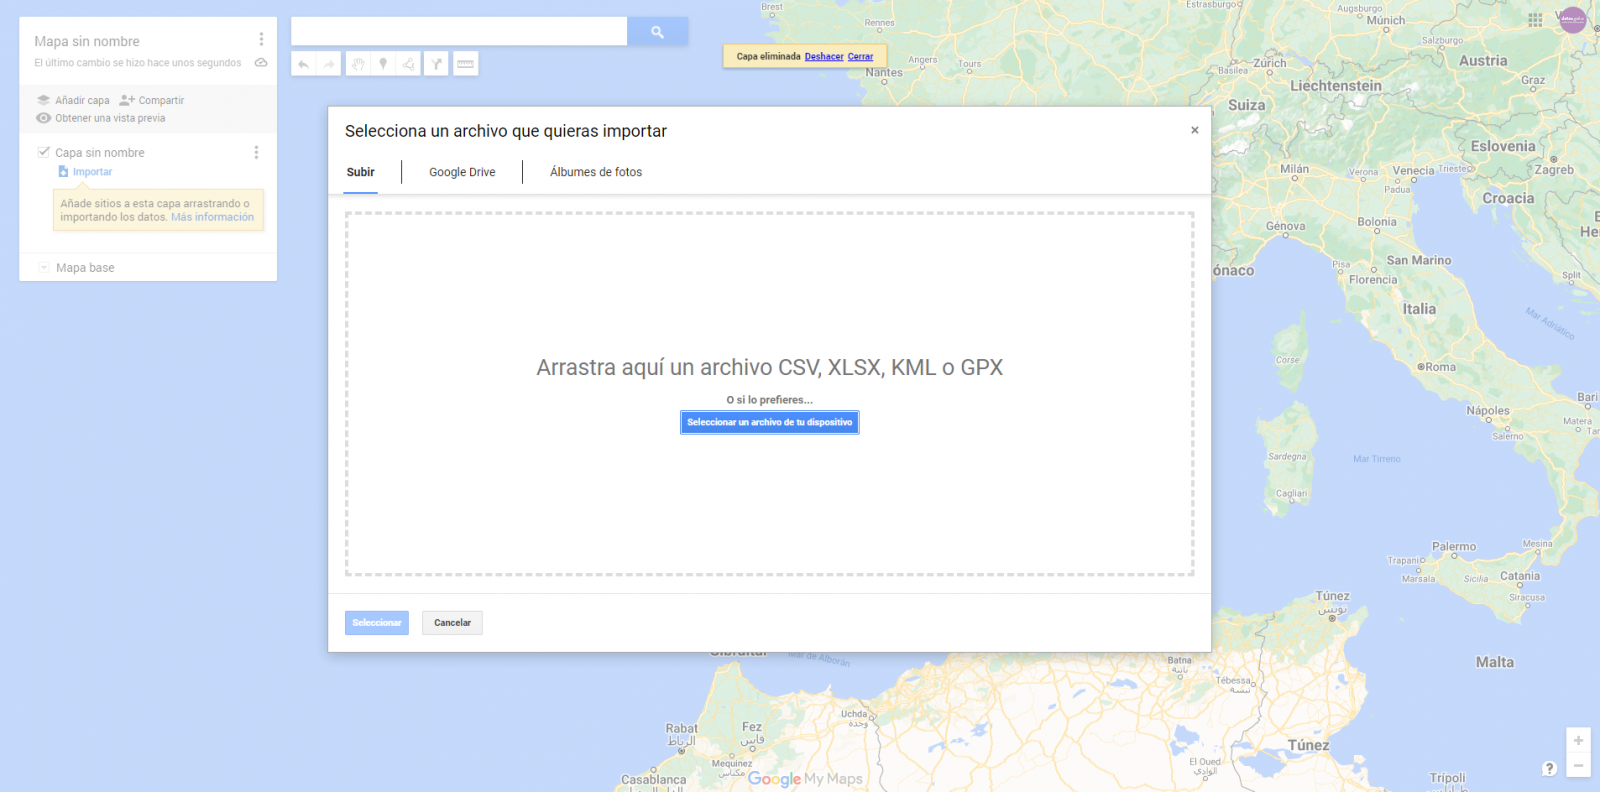
Figure 6. Importing files into "Google My Maps"
- In this case study, we''ll import preprocessed data tables that contain one variable with latitude and other with longitude. This geographic information will be automatically recognized. My Maps also recognizes addresses, postal codes, countries, ...
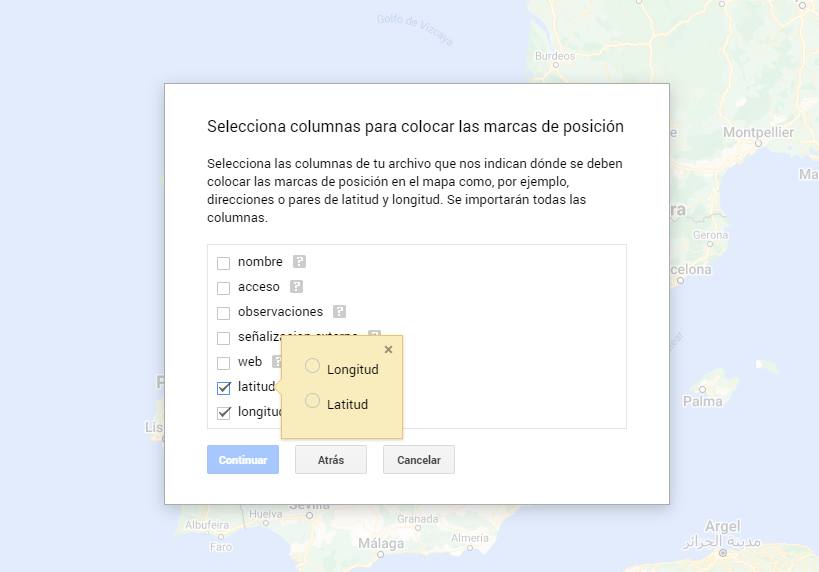
Figura 7. Select columns with placement values
- With the edit style option in the left side menu, in each of the layers, we can customize the pins, editing their color and shape.

Figure 8. Position pin editing
- Finally, we can choose the basemap that we want to display at the bottom of the options sidebar.
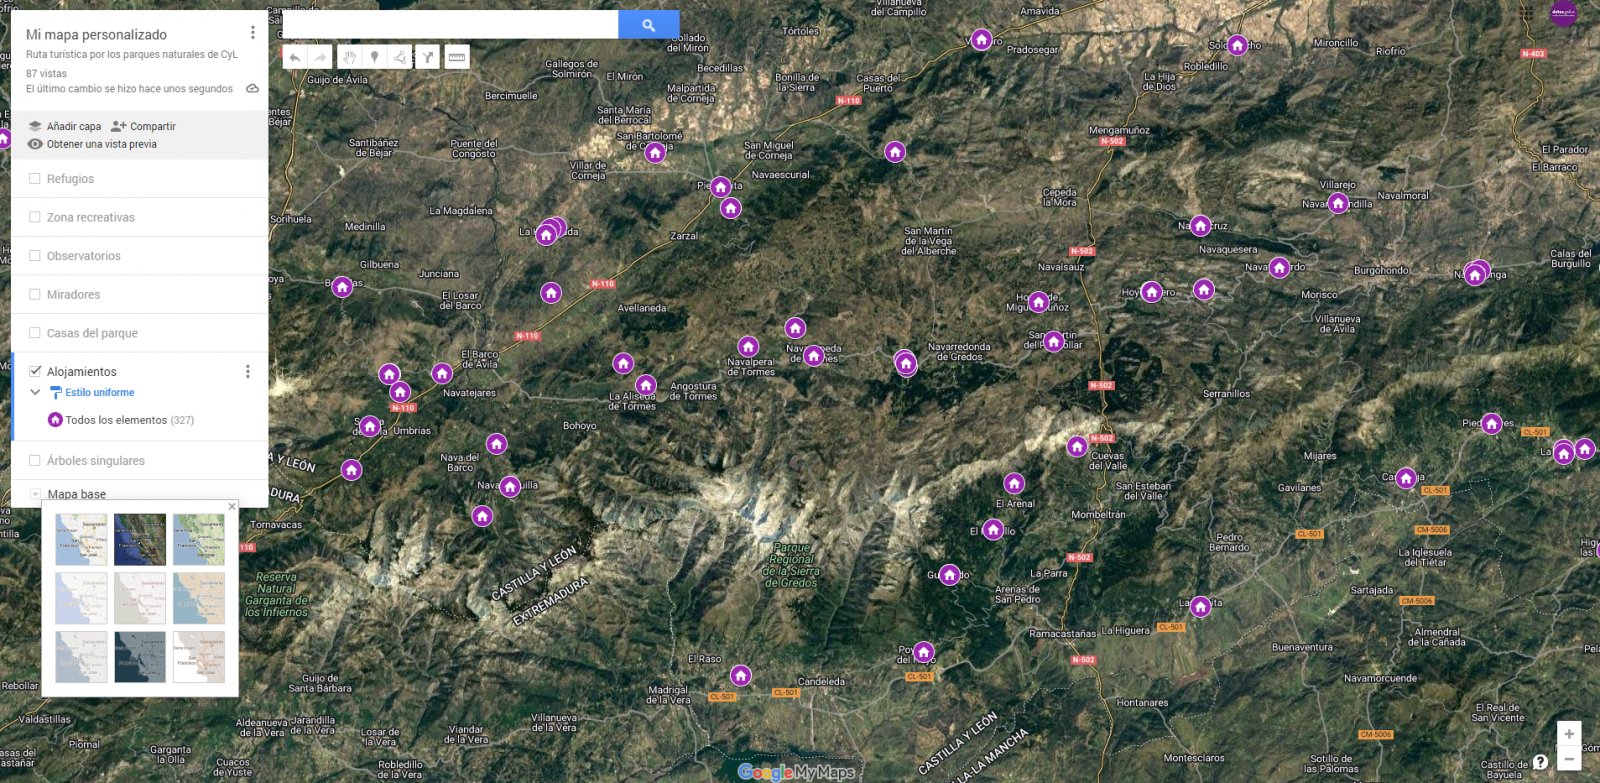
Figura 9. Basemap selection
If you want to know more about the steps for generating maps with "Google My Maps", check out the following step-by-step tutorial.
6.2 Personalization of the information to be displayed on the map
During the preprocessing of the data tables, we have filtered the information according to the focus of the exercise, which is the generation of a map to make tourist routes through the natural spaces of Castile and León. The following describes the customization of the information that we have carried out for each of the datasets.
- In the dataset belonging to the singular trees of the natural areas, the information to be displayed for each record is the name, observations, signage and position (latitude / longitude)
- In the set of data belonging to the houses of the natural areas park, the information to be displayed for each record is the name, observations, signage, access, web and position (latitude / longitude)
- In the set of data belonging to the viewpoints of the natural areas, the information to be displayed for each record is the name, observations, signage, access and position (latitude / longitude)
- In the dataset belonging to the observatories of natural areas, the information to be displayed for each record is the name, observations, signaling and position (latitude / longitude)
- In the dataset belonging to the shelters of the natural areas, the information to be displayed for each record is the name, observations, signage, access and position (latitude / longitude). Since shelters can be in very different states and that some records do not offer information in the "observations" field, we have decided to filter to display only those that have information in that field.
- In the set of data belonging to the recreational areas of the natural park, the information to be displayed for each record is the name, observations, signage, access and position (latitude / longitude). We have decided to filter only those that have information in the "observations" and "access" fields.
- In the set of data belonging to the accommodations, the information to be displayed for each record is the name, type of establishment, category, municipality, web, telephone and position (latitude / longitude). We have filtered the "type" of establishment only those that are categorized as rural tourism accommodations and those that have 2 stars.
Following a visualization of the custom map we have created is returned. By selecting the icon to enlarge the map that appears in the upper right corner, you can access its full-screen display
6.3 Map functionalities (layers, pins, routes and immersive 3D view)
At this point, once the custom map is created, we will explain various functionalities offered by "Google My Maps" during the visualization of the data.
- Layers
Using the drop-down menu on the left, we can activate and deactivate the layers to be displayed according to our needs.
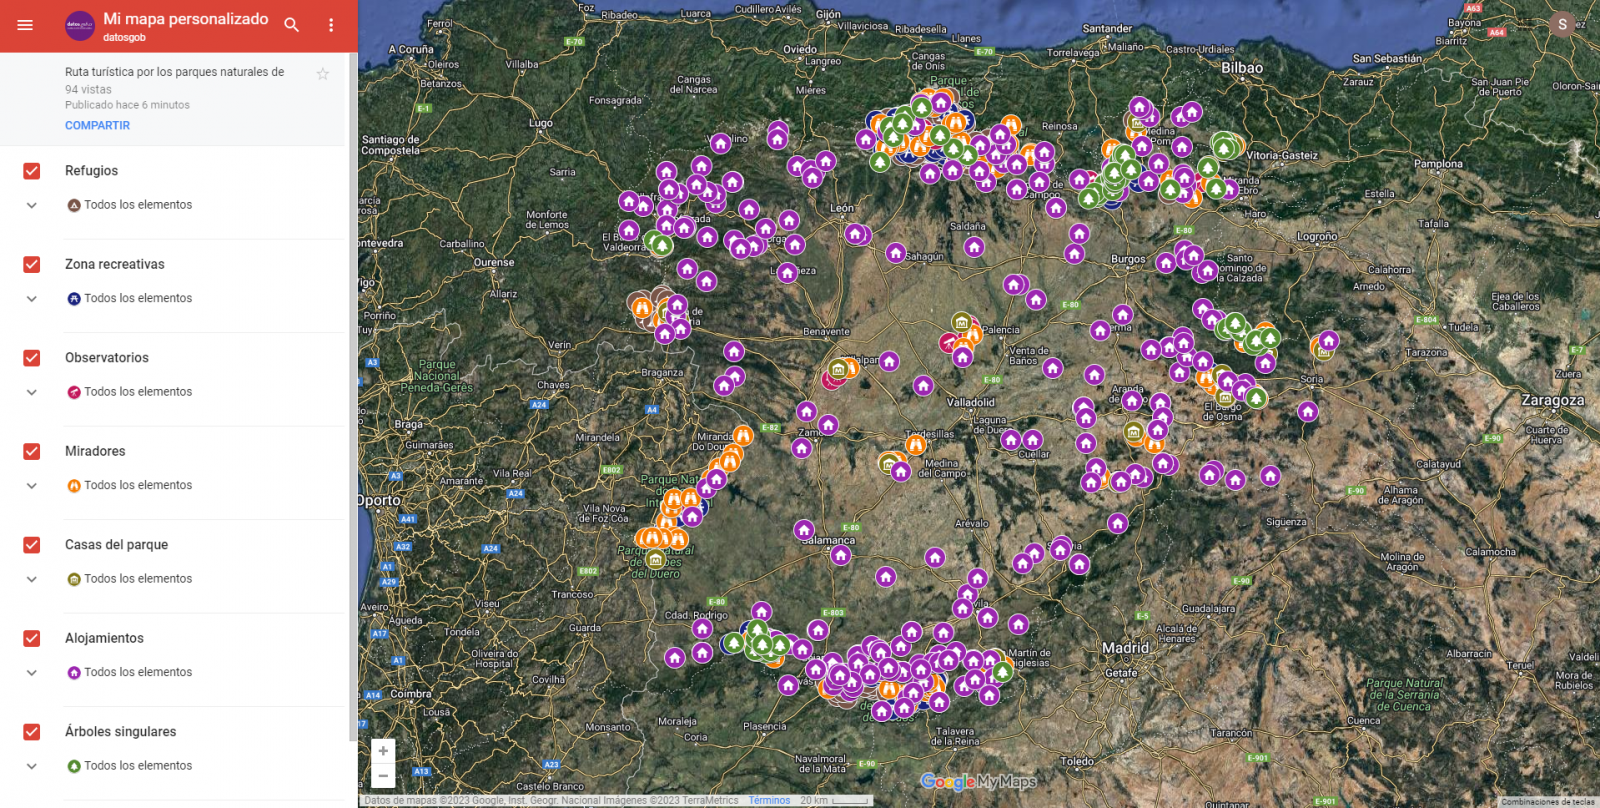
Figure 10. Layers in "My Maps"
-
Pins
By clicking on each of the pins of the map we can access the information associated with that geographical position.
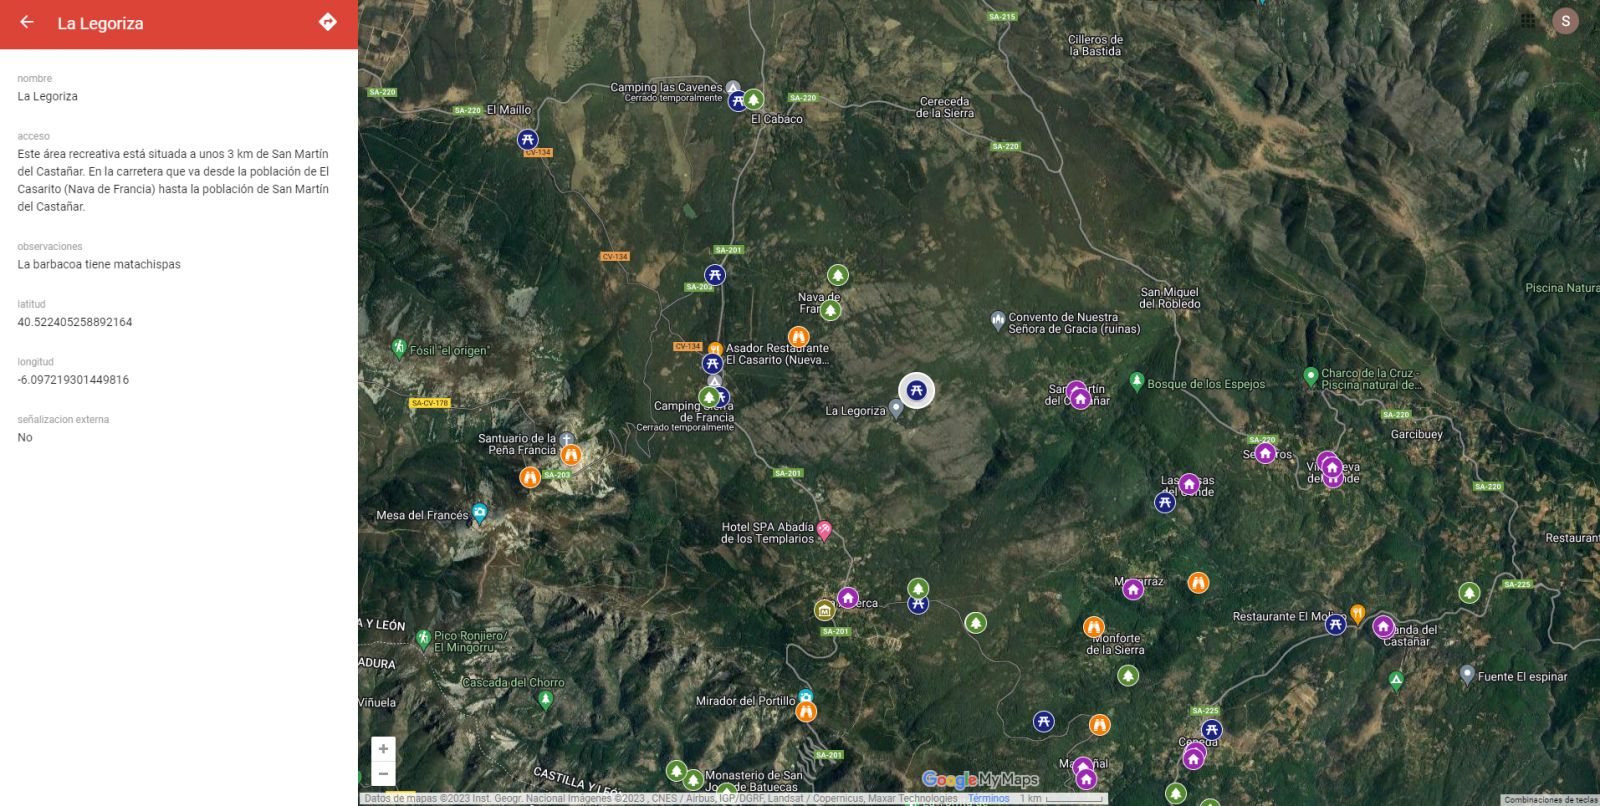
Figure 11. Pins in "My Maps"
-
Routes
We can create a copy of the map on which to add our personalized tours.
In the options of the left side menu select "copy map". Once the map is copied, using the add directions symbol, located below the search bar, we will generate a new layer. To this layer we can indicate two or more points, next to the means of transport and it will create the route next to the route indications.

Figure 12. Routes in "My Maps"
-
3D immersive map
Through the options symbol that appears in the side menu, we can access Google Earth, from where we can explore the immersive map in 3D, highlighting the ability to observe the altitude of the different points of interest. You can also access through the following link.
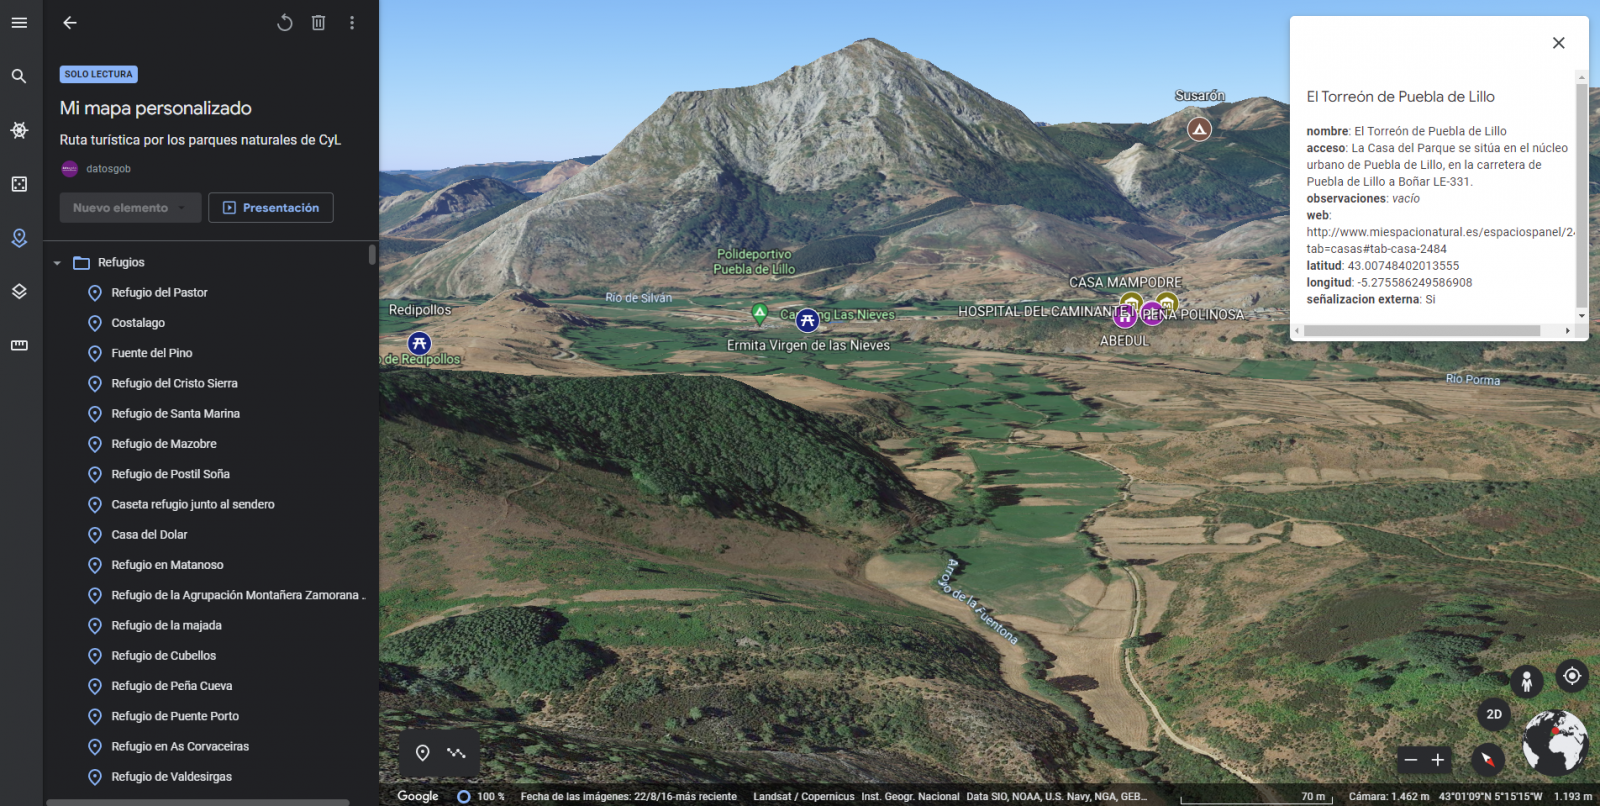
Figure 13. 3D immersive view
7. Conclusions of the exercise
Data visualization is one of the most powerful mechanisms for exploiting and analyzing the implicit meaning of data. It is worth highlighting the vital importance that geographical data have in the tourism sector, which we have been able to verify in this exercise.
As a result, we have developed an interactive map with information provided by Linked Data, which we have customized according to our interests.
We hope that this step-by-step visualization has been useful for learning some very common techniques in the treatment and representation of open data. We will be back to show you new reuses. See you soon!
Blog
The Spanish Hub of Gaia-X (Gaia-X Hub Spain), a non-profit association whose aim is to accelerate Europe's capacity in data sharing and digital sovereignty, seeks to create a community around data for different sectors of the economy, thus promoting an environment conducive to the creation of sectoral data spaces. Framed within the Spain Digital 2026 strategy and with the Recovery, Transformation and Resilience Plan as a roadmap for Spain's digital transformation, the objective of the hub is to promote the development of innovative solutions based on data and artificial intelligence, while contributing to boosting the competitiveness of our country's companies.
The hub is organized into different working groups, with a specific one dedicated to analyzing the challenges and opportunities of data sharing and exploitation spaces in the tourism sector. Tourism is one of the key productive sectors in the Spanish economy, reaching a volume of 12.2% of the national GDP.
Tourism, given its ecosystem of public and private participants of different sizes and levels of technological maturity, constitutes an optimal environment to contrast the benefits of these federated data ecosystems. Thanks to them, the extraction of value from non-traditional data sources is facilitated, with high scalability, and ensuring robust conditions of security, privacy, and thus data sovereignty.
Thus, with the aim of producing the first X-ray of this dataspace in Spain, the Data Office, in collaboration with the Spanish Hub of Gaia-X, has developed the report 'X-ray of the Tourism Dataspace in Spain', a document that seeks to summarize and highlight the current status of the design of this dataspace, the different opportunities for the sector, and the main challenges that must be overcome to achieve its deployment, offering a roadmap for its construction and deployment.
Why is a tourism data space necessary?
If something became clear after the outbreak of the COVID-19 pandemic, it is that tourism is an interdependent activity with other industries, so when it was paused, sectors such as mobility, logistics, health, agriculture, automotive, or food, among others, were also affected.
Situations like the one mentioned above highlight the possibilities offered by data sharing between sectors, as they can help improve decision-making. However, achieving this in the tourism sector is not an easy task since deploying a data space for this sector requires coordinated efforts among the different parts of society involved.
Thus, the objective and challenge is to create intelligent "spaces" capable of providing a context of security and trust that promotes the exchange and combination of data. In this way, and based on the added value generated by data, it would be possible to solve some of the existing problems in the sector and create new strategies focused on better understanding the tourist and, therefore, improving their travel experience.
The creation of these data sharing and exploitation spaces will bring significant benefits to the sector, as it will facilitate the creation of more personalized offers, products, and services that provide an enhanced and tailored experience to meet the needs of customers, thus improving the capacity to attract tourists. In addition, it will promote a better understanding of the sector and informed decision-making by both public and private organizations, which can more easily detect new business opportunities.
Challenges of security and data governance to take advantage of digital tourism market opportunities
One of the main obstacles to developing a sectoral data space is the lack of trust in data sharing, the absence of shared data models, or the insufficient interoperability standards for efficient data exchange between different existing platforms and actors in the value chain.
Moving to more specific challenges, the tourism sector also faces the need to combine B2B data spaces (sharing between private companies and organizations) with C2B and G2B spaces (sharing between users and companies, and between the public sector and companies, respectively). If we add to this the ideal need to land the tourism sector's datasets at the national, regional, and local levels, the challenge becomes even greater.
To design a sector data space, it is also important to take into account the differences in data quality among the aforementioned actors. Due to the lack of specific standards, there are differences in the level of granularity and quality of data, semantics, as well as disparity in formats and licenses, resulting in a disconnected data landscape.
Furthermore, it is essential to understand the demands of the different actors in the industry, which can only be achieved by listening and taking notes on the needs present at the different levels of the industry. Therefore, it is important to remember that tourism is a social activity whose focus should not be solely on the destination. The success of a tourism data space will also rely on the ability to better understand the customer and, consequently, offer services tailored to their demands to improve their experience and incentivize them to continue traveling.
Thus, as stated in the report prepared by the Data Office, in collaboration with the Spanish hub of Gaia-X, it is interesting to redirect the focus and shift it from the destination to the tourist, in line with the discovery and generation of use cases by SEGITTUR. While it is true that focusing on the destination has helped develop digital platforms that have driven competitiveness, efficiency, and tourism strategy, a strategy that pays the same attention to the tourist would allow for expanding and improving the available data catalogs.
Measuring the factors that condition tourists' experience during their visit to our country allows for optimizing their satisfaction throughout the entire travel circuit, while also contributing to creating increasingly personalized marketing campaigns, based on the analysis of the interests of different market segments.
Current status of the construction of the Spanish Tourism data space and next steps
The lack of maturity of the market in the creation of data spaces as a solution makes an experimental approach necessary, both for the consolidation of the technological components and for the validation of the different facets (soft infrastructure) present in the data spaces.
Currently, the Tourism Working Group of the Spanish Gaia-X Hub is working on the definition of the key elements of the tourism data space, based on use cases aligned with the sector's challenges. The objective is to answer some key questions, using existing knowledge in the field of data spaces:
- What are the key characteristics of the tourism environment and what business problems can be addressed?
- What data-oriented models can be worked on in different use cases?
- What requirements exist and what governance model is necessary? What types of participants should be considered?
- What business, legal, operational, functional, and technological components are necessary?
- What reference technology architecture can be used?
- What development, integration, testing, and technology deployment processes can be employed?
Noticia
On 25 October, the workshop "Use cases of the Spanish Tourism data space" was held, with the aim of starting the design and deployment of the first interoperable Tourism dataspace at European level, built under the Gaia-X seal.
This activity, organised by the Data Office in collaboration with the Secretary of State for Tourism, through SEGITTUR, is part of the public-private collaboration model for the constitution of sectoral data spaces promoted by the Secretary of State for Digitalisation and Artificial Intelligence of the Ministry of Economic Affairs and Digital Transformation. The event is a continuation of the process of revitalisation of national data spaces that began with the event "Governmental impulse to a data-driven reindustrialisation - Spanish Tourism Data Space", and is part of the actions carried out by the Government of Spain to create the legal, political, technological and funding environment conducive to the deployment of the data economy, as detailed in the Digital Spain 2026 strategy. This action is aligned with the European scene.
Why a tourism data space?
Data is a vital element in the development and sustainability of the tourism sector. Enabling its proper valorisation reinforces the already significant contribution of the sector to the national economy. The place to realise this latent value is the data space.
According to their European meaning, data spaces are ecosystems where different actors share data voluntarily and securely. In this way, the sharing of data between participants is realised while respecting the principles of self-determination in data sharing (sovereignty), privacy, transparency, security and fair competition.
Tourism, given its ecosystem of public and private participants of different sizes and technological maturity, is an optimal environment in which to test the benefits of these federated data ecosystems. They facilitate the extraction of value from non-traditional data sources, with high scalability, and guaranteeing in any case robust conditions of security, privacy and therefore data sovereignty.
The high availability of tourism data brings great benefits to the sector, as it facilitates the creation of more personalised offers, products and services that provide an improved experience tailored to the needs of customers, thus improving the ability to attract tourists. It also fosters greater knowledge of the sector and informed decision-making by both public and private organisations, which can more easily identify new business opportunities.
An eminently practical workshop
During the workshop, the more than one hundred participants, from both the tourism and technology sectors, tackled the detailed characterisation of different data sharing use cases that could satisfy specific business needs in the tourism sector. The participants were organised around different working groups considering the maturity of the use cases proposed, seeking to encourage the variety of profiles and the grouping of interests. The different work dynamics were carried out in accordance with the methodology for the discovery and design of use cases developed by the Data Office, allowing the validation of their content and their scalability to the rest of the sectoral data spaces to be created.
During the final conclusions of the conference, the Data Office emphasised the central role of data spaces as a place to create new business opportunities within the tourism sector. It was also highlighted that the synergies derived from data sharing go beyond the sum of individual data, and investments, duly supported by public-private collaboration, must be seen beyond the short term and need to be backed by management. The problem to be solved is a business problem and the solution is not exclusively technological. Simple solutions must be sought that are easy to adopt and use, with robust, agile and simple deployment that do not generate barriers to entry for small participants. Taking advantage of the current technological, economic, political and social situation, it is possible to develop a tourism sector that is data-oriented, sustainable, generates social value and is inclusive.
In this link you can see the presentation of the workshop, which includes, among others, methodological aspects for the creation of data spaces, such as the characteristics or the elements to be considered.Below you can also access several infographics:
- Tourism Data Spaces and the Gaia-X Model
- Use case sheet for data sharing
- Identification and proposal of use cases in tourism
- Elements involved in the data sharing process
Evento
60 participants, 10 mentors and €2,000 in prizes. These are the figures managed by DiValHack, the Hackathon promoted by Red.es and the Diputación de Valencia to bring the project "Connecta Valencia: Smart and Sustainable Tourism Territory" to the citizens. This project, financed by the public entity Red.es with FEDER funds, seeks to improve the tourism competitiveness of Valencian municipalities, increasing their knowledge to offer a better and more sustainable experience to tourists.
What is DiValHack?
DiValHack participants must develop a technological solution that responds to a challenge using the resources and infrastructures that Connecta Valencia offers.
Participants can propose a challenge of their choice related to Connecta Valencia or try to respond to some of the organisation's proposals:
- Mobility challenges: for example, determining the actual congestion of different points of interest, helping to locate parking spaces or helping tourists to travel with a lower carbon footprint.
- Environmental challenges: such as monitoring the air situation or comparing environmental quality between municipalities.
- Tourism challenges: e.g. showcasing thematic routes or promoting nomadism and rural tourism.
Solutions that address several challenges, as well as combining different data sources, from Connecta Valencia and other external repositories, will be considered positively. For example, solutions that monitor noise in contrast to the influx of people or that recommend routes based on the weather or air quality.
When does it take place?
The hackathon will be held on 10 and 17 November 2022, starting at 12:30. Both sessions will be face-to-face.
In the first session, resources will be presented and teams and roadmaps will be defined.
During the week the teams will work on their projects, supported by online mentoring.
On the 17th, the teams will present their solutions, which will be evaluated by a jury, and prizes will be awarded to the three solutions with the best scores. The evaluation criteria are defined in the terms and conditions of the call.
Who can participate?
The hackathon is aimed at students and professionals. The only requirement is to be of legal age.
Participation will take place in teams of three to six people. The team should be multidisciplinary, including technological, financial, business, communication and/or social science profiles, as the evaluation criteria are not only technical.
What do the prizes consist of?
The three proposals with the best scores will receive cash prizes of 2,000 euros, distributed as follows:
- First prize: 1,000 euros
- Second prize: 750 euros
- Third prize: 250 euros
How can I participate?
Participation is free of charge. The deadline for registration is 30 October. To register you must fill in this form.
You can register alone or in a group. If you register alone, the organisation will find a group for you at the event.
Find out more about Connecta Valencia
The Connecta Valencia project has provided the 266 Valencian municipalities with the necessary infrastructure to analyse the flow of tourists in their territory, as well as their impact on the environment, by installing devices that measure mobility and environmental quality. This information allows informed decisions to be taken and public policies to be improved.
To this end, an open source platform has been set up to facilitate access to data through two mechanisms: an API and an open data portal that offers datasets in CSV and JSON formats. Among other information, users can access to data from meteorological and environmental sensors, mobility flows, etc.
You can learn more about the project in the following videos:
Noticia
The Tourism Data Space event took place on 9 June, organised by Gaia-X, the European private sector initiative for the creation of an open, federated and interoperable data infrastructure to drive the Data Economy while respecting digital sovereignty. During the event, which was held online, international experts from the public and private sector discussed "How can data spaces contribute to the development of tourism in Europe through citizen-centric offerings?”. The event was a success with more than 250 attendees from 21 countries.
The tourism sector has a strong economic weight in Europe, although it has been affected by the COVID-19 pandemic and the drop in international tourist arrivals, which exceeded 70% worldwide. In this context, Gaia-X and data spaces are positioned as a great opportunity for companies in the sector. Gaia-X aims to make European data available to improve the ability to attract tourists by creating more personalised offers, products and services, resulting in an enhanced experience tailored to customers' needs. It was with this premise in mind that the event kicked off, focusing on the requirements and need for a secure, decentralised and citizen-oriented European tourism data space.
The opening speech of the event was given by Carme Artigas, Secretary of State for Digitalisation and Artificial Intelligence of the Spanish Ministry of Economy and Digital Transformation, who highlighted the importance of the tourism sector: "“Finally, we are giving the tourism the importance it deserves also in the data economy. At the EU level, the tourism sector directly contributes to almost 4% of GDP with 2.3 million businesses, majority of which are SMEs”. This sector also employs 22.4% of the service sector workforce, as Francesco Bonfiglio, Director General of Gaia-X AISBL, commented: "This market is worth billions of euros, and is one of the areas with the greatest impact if we decide to invest in a common European data space".
Artigas also stressed that "Before the end of the year we will have a new digital space for tourism at European level, and this is great news", always respecting the basic principles of data sovereignty, privacy, security and interoperability.
Yvo Volman, Chief Data Officer at DG-CNECT (European Commission), explained that in order to achieve the set objectives, empowerment and data sharing also across sectors is essential. This is the only way to establish better services and promote sustainability. The importance of education was also stressed by Natalia Bayona, Director of Innovation, Education and Investment at the World Tourism Organisation (UNWTO): "Tourism is the main employer of women and young people. However, 50% of people working in tourism have only secondary skills. If we want to develop a high-level economic sector, we have to develop education". In her speech, she also focused on the need for a public-private relationship, with projects such as Gaia-X as a spearhead to drive innovation.
This was followed by several presentations focused on providing an overview of the landscape of the Gaia-X Tourism data space in Europe, with experts from different countries. From Spain, Ana Moniche, Senior Analyst at Turismo Andaluz and NECSTourR, and Cristina Núñez, Director of Necstour, spoke about European regional practices for competitive and sustainable tourism, highlighting how European data sharing is fundamental to develop strategies based on quality information. Data sharing also offers companies with fewer resources the possibility of accessing large amounts of data, which they would not be able to access through their own mechanisms.
Dolores Ordóñez, Director of AnySolution and Vice President of the Spanish Gaia-X Hub, also spoke in this section. In her speech, she highlighted the need for collaboration between companies of different sizes and sectors, especially in four major areas: tourism, health, industry 4.0 and mobility. In the section dedicated to the pillars of tourism data spaces, among other speakers, Alberto Palomo, CDO of the Government of Spain, pointed out the importance of generating scalability in data sharing, as well as the creation of a common framework that shapes governance mechanisms that are useful and accepted by industry players. He also warned that the paradigm we are facing is that of an "innovative decentralised infrastructure", something that all participants must be clear about, because of the cultural change it implies.
To conclude, the event was divided into 3 thematic sessions, designed to create an atmosphere of cross-border collaboration and help create a sustainable data infrastructure for the tourism industry. These sessions focused on smart destinations, the tourism value chain and its technological enablers. More information about the event can be found in the video teaser. This event is part of a series of meetings organised by Gaia-X around data spaces. Two previous events have focused on mobility and health. Gaia-X will continue to hold such activities in the coming months, as can be seen in its calendar. In addition, it has launched a magazine and a podcast series to keep up to date with the latest trends related to the data space.
Noticia
In recent times, open data has become an element of great value when it comes to improving the quality of life and offering greater benefits to citizens in different sectors. One of them is tourism, and it is that the number of public administrations that are opening their data in this field is increasing.
One of the main reasons is found in the great economic benefit that this sector brings to a country like Spain, which welcomes millions of tourists every year. Therefore, it is not surprising that municipalities and administrations show increasing interest in disseminating the services they offer in order to attract as many visitors as possible.
The data related to the tourism sector is highly dynamic and for this reason there are many organizations that are committed to offering it through APIs, which facilitate access in a much more efficient way.
The opening of data in the tourism sector it is a practice that encourages the creation of services and technologies capable of offering solutions to current problems from the reuse of open data. This is the case of some applications such as Casual Learn, which uses information from the Open Data Portal of Castilla y León for its users to learn art history while touring the community's monuments. Or also from Maps of Spain, a free viewer IGN aimed at citizens who want to carry out activities in nature, which they can access from their mobile phone without the need to connect to the internet.
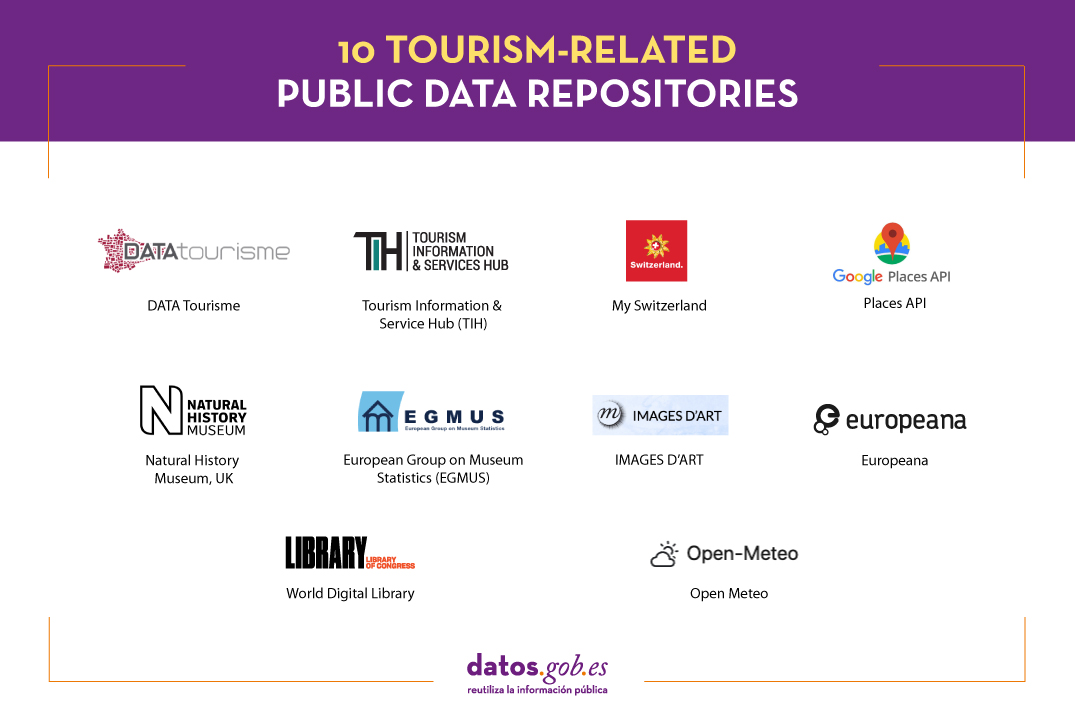
If you are interested in accessing this type of data, then we have collected 10 examples of repositories related to tourism at an international level, divided into three categories: tourism, leisure and culture, and meteorology.
Tourism
DATA Tourisme
- Publisher: Government of Singapore
The Tourism Information and Service Center (TIH) is a digital resource platform that enables businesses and developers to access relevant information on Singapore's tourism offerings and travel software services.
Undoubtedly, the highlight of this portal is that it has an API to facilitate access to its data offer. Data APIs allow developers to access datasets related to Singapore tourism through an API key.
Accommodation, attractions, excursions, shopping centers and stores or number of visitors are just some examples of the type of data that can be found on this portal.
Tourism Information & Service Hub (TIH)
- Publicador: Gobierno de Singapur
El Centro de información y servicios turísticos (TIH) es una plataforma de recursos digitales que permite a empresas y desarrolladores acceder a información relevante sobre las ofertas turísticas y los servicios de software de viajes de Singapur.
Sin duda, lo más destacado de este portal es que cuenta con una API para facilitar el acceso a su oferta de datos. Las API de datos permiten a los desarrolladores acceder a conjuntos de datos relacionados con el turismo de Singapur a través de una clave API.
Alojamiento, atracciones, excursiones, centros comerciales y tiendas o número de visitantes son solo algunos ejemplos del tipo de datos que se pueden encontrar en este portal.
My Switzerland
- Publisher: Government of Switzerland
This platform offers data sets related to tourism in Switzerland that are provided through an API. It is a public API that presents tourist information translated into 16 languages and its main source of content is the portal from My Switzerland.
Currently this API provides data about tourist destinations, attractions and offers of interest, although this list will be expanded in the near future with more types of data depending on the needs of partners and reusers.
Places API
- Publisher: Google
This API developed by Google allows you to search for information on more than 200 million places through a wide variety of categories, including establishments, prominent points of interest or geographical locations.
Through this API, developers can access a wide variety of Google data to provide their users with a real-time location-based experience by displaying place names and information rather than a set of coordinates.
Leisure and culture
UK Natural History Museum
- Publisher: UK Natural History Museum
Through this portal it is possible to consult and download data about the museum's research and collections. It currently has an approximate number of 200 data sets on various topics such as entomology, zoology, botany, or paleontology, among others.
All datasets are available through a API to facilitate downloading for users who wish to use the data in their own software or applications.
European Group on Museum Statistics (EGMUS)
- Publisher: European Groupon Museum Statistics (EGMUS)
The European Group for Museum Statistics (EGMUS) is an organization founded in 2002 in which 30 European countries are represented. The main objective of EGMUS is the collection and publication of statistical data relating to the participating European museums.
Information available from national museum statistics and surveys is collected, updated and stored in the Abridged List of Museum Key Indicators (ALOKMI) table. ALOKMI is the first step towards the harmonization of museum statistics in Europe.
The data tables offered by EGMUS are available for download in CSV format.
IMAGES D’ART
- Publisher: Réunion des musées nationaux - Grand Palais
Images d'Art (Art Images) is a platform that offers an extensive database of hundreds of thousands of works by approximately 30,000 artists. This image database contains works from French museums that have been digitized and documented by the photography agency NMR-GP.
In this portal we can filter the information around some parameters such as museums, historical periods, authors, technique, keywords or advanced search.
Europeana
- Publisher: Europeana
Europeana is a portal that provides cultural heritage enthusiasts, practitioners, teachers and researchers with digital access to European cultural heritage material. This platform has information on more than 3,700 different institutions. A network of aggregator partners collects the data, thoroughly checks it, and enriches it with information such as geographic location or links it to other materials or data sets through associated people, places, or topics.
Europeana offers data on works of art, books, music and videos, newspapers, archaeology, fashion, science or sports, among many others. To facilitate access to this information, this portal has different APIs.
World Digital Library
- Publisher: World Digital Library (WDL)
The World Digital Library was a project created in 2009 by the United States Library of Congress, with the support of UNESCO and contributions from libraries, archives, museums, educational institutions, and international organizations around the world.
The WDL contains extremely interesting materials that are essential for understanding cultures around the world. The data it offers is available free of charge and in a wide variety of languages. In addition, it offers a menu that allows you to filter the data by format, date, location, theme or language, among others.
Meteorology
Open Meteo
- Publisher: Open Meteo
Open-Meteo offers a weather data API for free global weather forecasting. This API is especially aimed at open source developers and non-commercial use, to access it no password is required and its information is updated every 3 hours.
Data related to temperature, wind, pressure, humidity or precipitation are just some of the meteorological variables that users have available through this API.
This has been just a small selection of data repositories related to the tourism sector that could be of interest to you. Do you know any more relevant related to this field? Leave us a comment or send us an email at dinamizacion@datos.gob.es
Noticia
Who hasn't ever used an app to plan a romantic getaway, a weekend with friends or a family holiday? More and more digital platforms are emerging to help us calculate the best route, find the cheapest petrol station or make recommendations about hotels and restaurants according to our tastes and needs. Many of them have a common denominator, and that is that their operation is based on the use of data coming, for the most part, from public administrations.
It is becoming increasingly easy to find tourism-related data that have been published openly by various public bodies. Tourism is one of the sectors that generates the most revenue in Spain year after year. Therefore, it is not surprising that many organisations choose to open tourism data in exchange for attracting a greater number of visitors to the different areas of our country.
Below, we take a look at some of the datasets on tourism that you can find in the National Catalogue of Open Data in order to reuse them to develop new applications or services that offer improvements in this field.
These are the types of data on tourism that you can find in datos.gob.es
In our portal you can access a wide catalogue of data that is classified by different sectors. The Tourism category currently has 2,600 datasets of different types, including statistics, financial aid, points of interest, accommodation prices, etc.
Of all these datasets, here are some of the most important ones together with the format in which you can consult them:
At the state level
- National Statistics Institute (Ministry of Economic Affairs and Digital Transformation). Average stay, by type of accommodation by Autonomous Communities and Autonomous Cities. CSV, XLSX, XLS, HTML, JSON, PC-Axis.
- State Meteorological Agency (AEMET). Forecast by municipality, 7 days. XML.
- Geological and Mining Institute of Spain (Ministry of Science and Innovation). Spanish Inventory of Places of Geological Interest (IELIG). HTML, JSON, KMZ, XML.
- National Statistics Institute (Ministry of Economic Affairs and Digital Transformation). Rural Tourism Accommodation Price Index (RTAPI): national general index and by tariffs. CSV, HTML, JSON, PC-Axis, CSV
- National Statistics Institute (Ministry of Economic Affairs and Digital Transformation). Holiday Dwellings Price Index (HDPI): national general index and by tariffs. CSV, HTML, JSON, PC-Axis, CSV
- National Statistical Institute (Ministry of Economic Affairs and Digital Transformation). Tourist Campsite Price Index (TCPI): national general index and by tariffs. CSV, HTML, JSON, PC-Axis
At the level of the Autonomous Regions
- Regional Government of Andalusia. Andalusia Tourism Situation Survey. CSV, HTML
- Autonomous Community of the Basque Country. Tourist destinations in the Basque Country: towns, counties, routes, walks and experiences. RSS, API, XLSX, GeoJSON, XML, JSON, KML.
- Autonomous Community of Navarre. Signposting Camino Santiago. CSV, HTML, JSON, ODS, TSV, XLSX, XML.
- Autonomous Community of the Canary Islands. Active Tourism Activities registered in the General Tourism Register. XLS, CSV.
- Autonomous Community of Navarra. Ornithological tourism. CSV, HTML, JSON, ODS, TSV, XLSX, XML.
- Autonomous Community of Aragon. Footpaths of Aragon. XML, JSON, CSV, XLS.
- Cantabrian Institute of Statistics. Directory of Collective Tourist Accommodation (ALOJATUR) of the Canary Islands. JSON, XML, ZIP, CSV.
At the local level
- Valencia City Council. Tourist monuments. CSV, GML, JSON, KML, KMZ, OCTET-STREAM, WFS, WMS.
- Lorca City Council. Itineraries of tourist routes in the city centre. KMZ.
- Almendralejo Town Hall. Restaurants and bars of Almendralejo. XML, TSV, CSV, JSON, XLSX.
- Madrid City Council. Tourist offices of Madrid. HTML, RDF-XML, RSS, XML, CSV, JSON.
- Vigo City Council. Urban Tourism. CSV, JSON, KML, ZIP, XLS, CSV.
Some examples of re-use of tourism-related data
As we indicated at the beginning of this article, the opening up of data by public administrations facilitates the creation of applications and platforms that, by reusing this information, offer a quality service to citizens, improving the experience of travellers, for example, by providing updated information of interest. This is the case of Playas de Mallorca, which informs its users about the state of the island's beaches in real time, or Castilla y León Gurú, a tourist assistant for Telegram, with information about restaurants, monuments, tourist offices, etc. We can also find applications that make saving money easier (Geogasolineras) or that help people with disabilities to get around the destination (Ruta Accesible - How to get there in a wheelchair).
Public administrations can also take advantage of this information to get to know tourists better. For example, Madrid en Bici, thanks to the data provided by the city's portal, is able to draw up an X-ray of the real use of bicycles in the capital. This makes it possible to make decisions related to this service.
In our impact section, in addition to applications, you can also find numerous companies related to the tourism sector that use public data to offer and improve their services. This is the case of Smartvel or Bloowatch.
Do you know of any company that uses tourism data or an application based on it? Then don't hesitate to leave us a comment with all the information or send us an email to contacto@datos.gob.es. We will be happy to read it!
Blog
Today's tourism industry has a major challenge in managing the concentration of people visiting both open and closed spaces. This issue was already very important in 2019, when, according to the World Tourism Organisation, the number of travellers worldwide exceeded 1.4 billion. The aim was to minimise the negative impact of mass tourism on the environment, local communities and the tourist attractions themselves. But also, to ensure the quality of the experience for visitors who will prefer to schedule their visits in situations where the total occupancy of the area they intend to visit is lower.
The restrictions associated with the pandemic drastically reduced visitor numbers, which in 2020 and 2021 were less than a third of the number recorded in 2019, but made it much more important to manage visitor flows, even if this was for public health reasons.
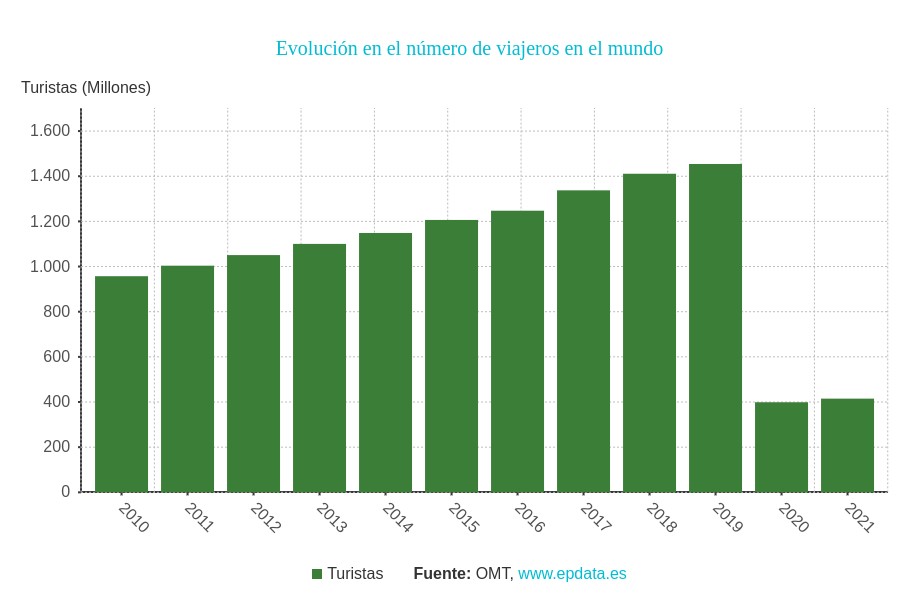
We are now in an intermediate situation between restrictions that seem to be in their final phase and a steady growth in visitor numbers, making cities more sensitive than ever to use data-driven solutions to promote tourism and at the same time control visitor flows.
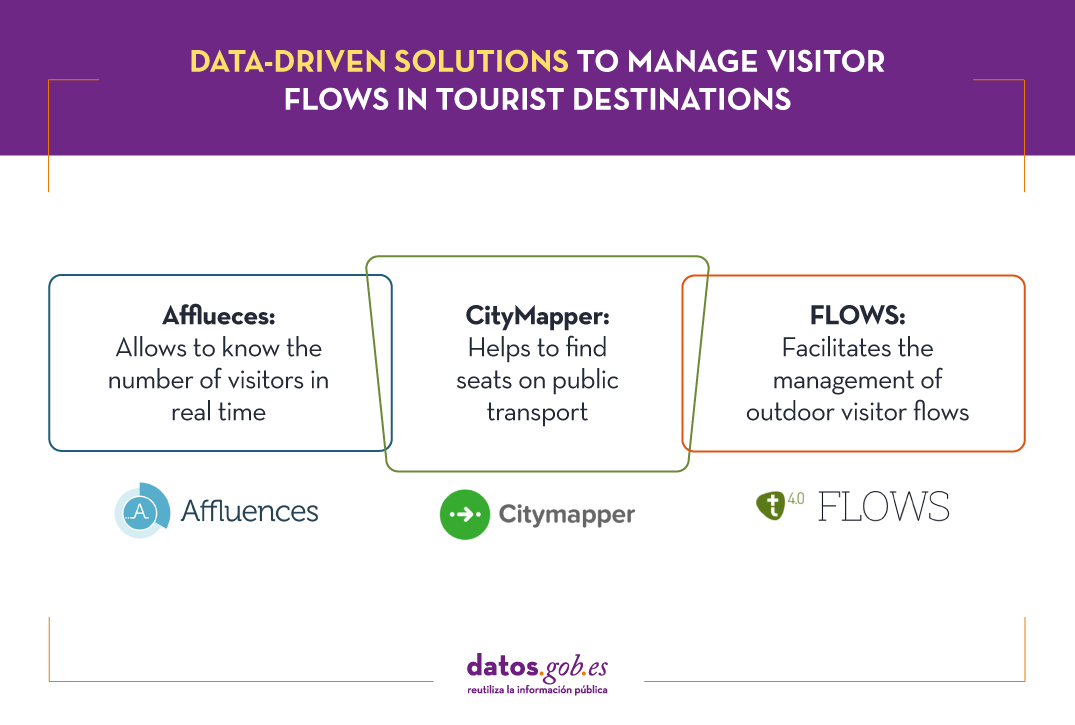
Know the number of visitors in real time with Afflueces
Among the occupancy management applications that help tourists avoid queues and crowds indoors is Affluences, a French-born solution that allows tourists to monitor the occupancy of museums, libraries, swimming pools and shops in real time.

The proposal of this solution consists of measuring the influx of visitors in closed spaces using people counting systems and then analysing and communicating it to the user, providing data such as waiting time and occupancy rate.
In some cases, Affluences installs sensors in the institutions or uses existing sensors to measure in real time the number of people present in the institution. In other cases, it uses the real-time occupancy data provided by the facilities as open data, as in the case of the swimming pools of the city of Strasbourg.
The data measured in real time are enriched with other sources of information such as attendance history, opening calendar, etc. and are processed by predictive analytics algorithms every 5 minutes. This approach makes it possible to provide the user with much more accurate information than can be obtained, for example, via Google Maps, based on the analysis of location data captured via mobile phones.
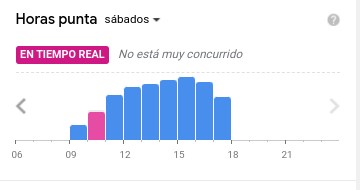
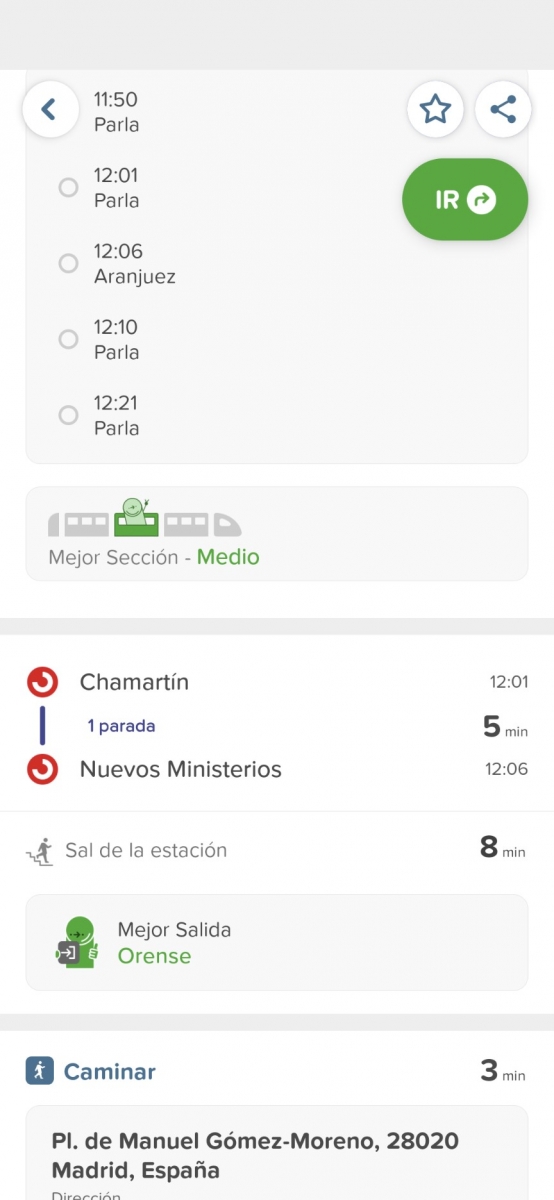
Find a seat on public transport with CityMapper
CityMapper is probably the best known urban mobility app in major European cities and one of the most popular worldwide. It was founded in London, but is already present in 71 European cities in 31 countries and aggregates 368 different modes of transport. Among these cities are of course Madrid and Barcelona, but also a number of large cities in Spain such as Valencia, Seville, Zaragoza or Malaga.
CityMapper allows you to calculate multimodal routes by combining a large number of modes of transport: metros and buses together with bicycles, scooters and even mopeds where available. If we choose, for example, the bicycle as a means of transport, the application provides the user with granular data such as how many bicycles are available at the pick-up point and how many empty parking spaces are available at the destination.
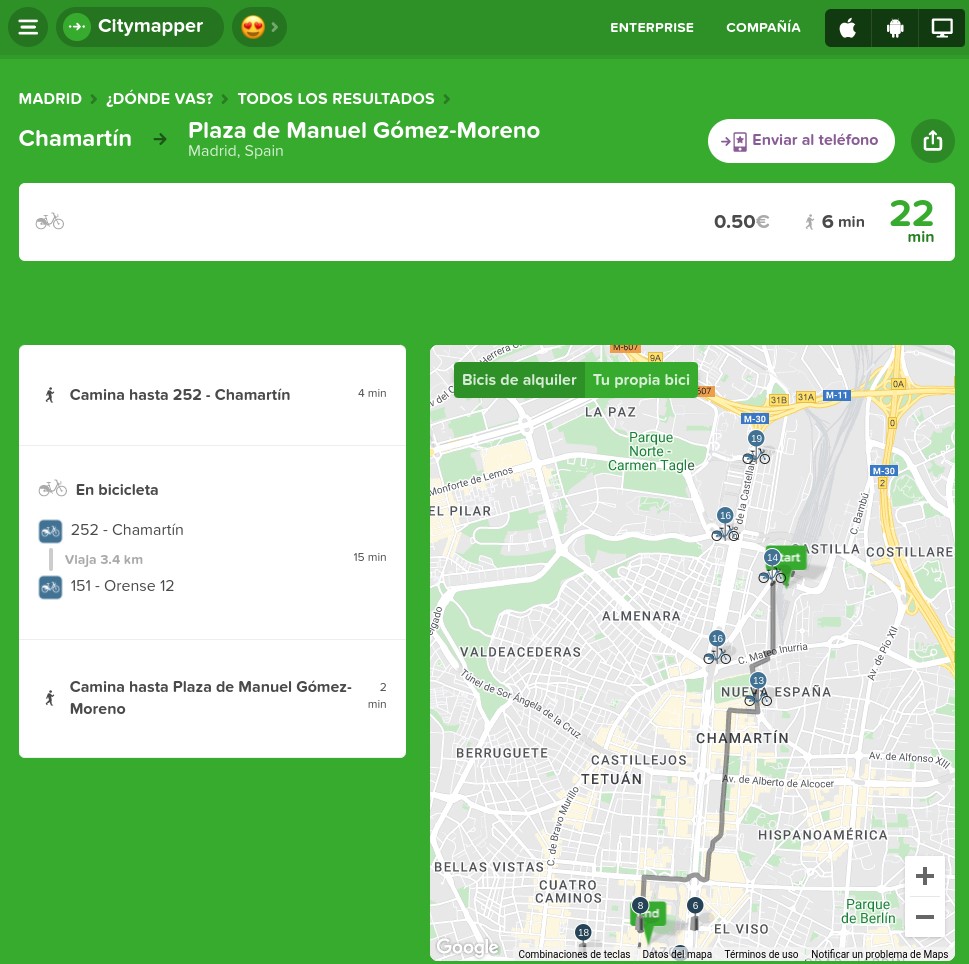
But the differentiating factor of CityMapper and probably the one that has had the greatest influence on its great success of adoption is the clever way in which it uses a combination of open and private data and artificial intelligence to provide users with highly accurate estimates of waiting times, journey times and even traffic disruptions.
For example, CityMapper is even able to provide information about the occupancy of some of the modes of transport it suggests on routes so that the user can for example choose the least congested carriage on the train they are waiting for. The application even suggests where the user should be positioned to optimise the journey by specifying which entrances and exits to use.
Outdoor visitor flows with FLOWS
The management of outdoor visitor flows introduces new elements of difficulty both in measuring occupancy and in establishing stable predictive models that are useful for visitors and for those responsible for planning security measures. This requires new data sources and special attention to the privacy of the users whose data is analysed.
FLOWS is a project that is working to help cities and tourism establishments prepare for peak tourism periods and redirect visitors to less congested areas. To achieve this ambitious goal, it combines anonymised data from various sources such as traffic control sensors, data from open Wi-Fi networks, data from mobile phone operators, data from tourist records or itinerary and reservation management systems, water and energy consumption data, waste collection or social media posts.
Through a simple user interface it will allow advanced analysis and forecasting of tourist movements showing traffic flows, traffic congestion, seasonal deviations, entries/exits to the destination, movement within the destination, etc. It will be possible to display the analyses in the selected time interval and make predictions based on historical data considering seasonal factors.

These are just a few examples of the many initiatives that are working to address a major challenge facing tourism during the green and digital transition - the management of traffic flows in both indoor and outdoor spaces. The coming years will undoubtedly see breakthroughs that will change the way we experience tourism and make the experience more enjoyable while minimising the impact we have on the environment and local communities.
Content prepared by Jose Luis Marín, Senior Consultant in Data, Strategy, Innovation & Digitalization.
The contents and points of view reflected in this publication are the sole responsibility of its author.
Blog
Spain was the second country in the world that received the most tourists during 2019, with 83.8 million visitors. That year, tourism activity represented 12.4% of GDP, employing more than 2.2 million people (12.7% of the total). It is therefore a fundamental sector for our economy.
These figures have been reduced due to the pandemic, but the sector is expected to recover in the coming months. Open data can help. Up-to-date information can bring benefits to all actors involved in this industry:
- Tourists: Open data helps tourists plan their trips, providing them with the information they need to choose where to stay or what activities to do. The up-to-date information that open data can provide is particularly important in times of COVID. There are several portals that collect information and visualisations of travel restrictions, such as the UN's Humanitarian Data Exchange. This website hosts a daily updated interactive map of travel restrictions by country and airline.
- Businesses. Businesses can generate various applications targeted at travellers, with useful information. In addition, by analysing the data, tourism establishments can detect untapped markets and destinations. They can also personalise their offers and even create recommendation systems that help to promote different activities, with a positive impact on the travellers' experience.
- Public administrations. More and more governments are implementing solutions to capture and analyse data from different sources in real time, in order to better understand the behaviour of their visitors. Examples include Segovia, Mallorca and Gran Canaria. Thanks to these tools, they will be able to define strategies and make informed decisions, for example, aimed at avoiding overcrowding. In this sense, tools such as Affluences allow them to report on the occupation of museums, swimming pools and shops in real time, and to obtain predictions for successive time slots.
The benefits of having quality tourism-related data are such that it is not surprising that the Spanish Government has chosen this sector as a priority when it comes to creating data spaces that allow voluntary data sharing between organisations. In this way, data from different sources can be cross-referenced, enriching the various use cases.
The data used in this field are very diverse: data on consumption, transport, cultural activities, economic trends or even weather forecasts. But in order to make good use of this highly dynamic data, it needs to be available to users in appropriate, up-to-date formats and access needs to be automated through application programming interfaces (APIs).
Many organisations already offer data through APIs. In this infographic you can see several examples linked to our country at national, regional and local level. But in addition to general data portals, we can also find APIs in open data platforms linked exclusively to the tourism sector. In the following infographic you can see several examples:
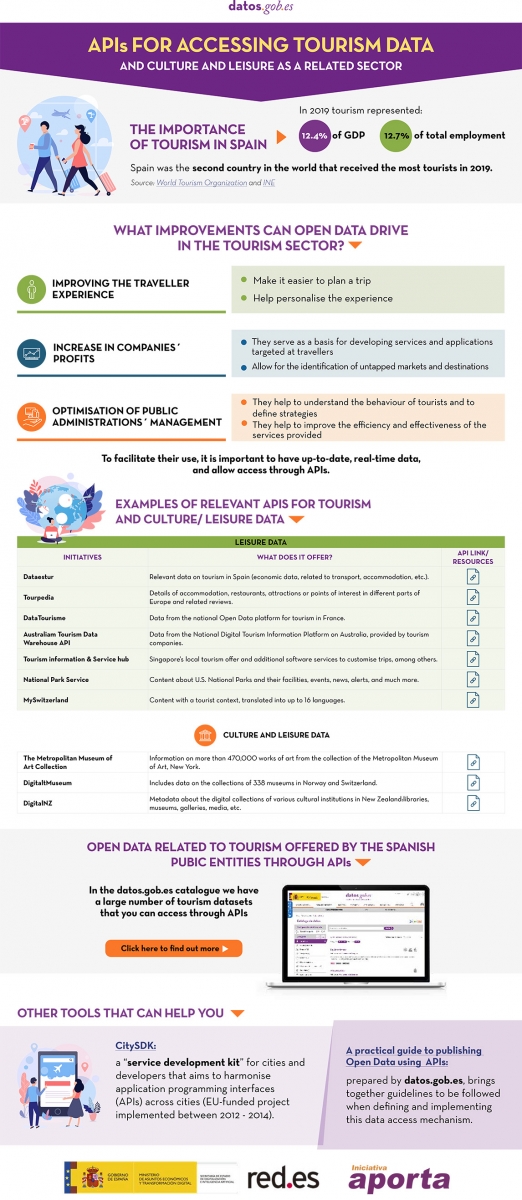
Click here to see the infographic in full size and in its accessible version.
Do you know more examples of APIs or other resources that facilitate access to tourism-related open data? Leave us a comment or write to datos.gob.es!
Content prepared by the datos.gob.es team.
Blog
As our lives become more and more digitized, activities as face-to-face as “tourism” are also being pushed towards a transformation as profound as that of other sectors and activities. In this digitization process, both the data and the technologies associated with artificial intelligence are essential and this was highlighted, for example, by the 2020 European Tourism Convention.
The importance of tourism for the Spanish economy is enormous (12.4% of GDP and 12.7% of employment in 2019). The number of visitors we receive in our country, even despite the break caused by the pandemic, is still among the highest in the world. Therefore, in all the strategies and plans that are developed in our country, the weight of the tourism industry is reflected. For example, with the deployment of the Spanish Hub of Gaia-X, whose objective is to make it easier for sectorial industries of all sizes to create community and promote innovation based on data and Artificial Intelligence, Spain aspires to become the first country to lead a data space in the tourism industry. Bearing in mind that the hubs must facilitate and support the creation of European data spaces and are representatives of the regional economy, significant efforts will be made in Spain to develop data spaces that are relevant or specific to the Spanish economy, as is the case of the tourism industry.
As visitors or tourists we all have the expectation of enjoying an increasingly personalized experience, not only during the pre-planning process, but also during the time we are traveling or carrying out the activity. In this sense, open data plays a central role, both to help us select activities or attractions and to obtain relevant recommendations in real time that help us enjoy the experience more. For this reason, a multitude of cities and regions have been betting on publishing data sets and, in some cases, applications specifically aimed at visitors. Serve as an example the almost 3,000 data sets that can be found in the tourism category of the datos.gob.es portal, and which come both from the state administration and from different local and regional administrations.
Construction of aggregate datasets
However, as in other sectors of activity, to develop more sophisticated use cases related to tourism, taking advantage of the advanced use of data and artificial intelligence, data sets that transcend local spheres are necessary. Open data on tourism, as it happens in other domains, is distributed through different websites and in different formats or data structures. In this sense, there are some examples of transnational projects such as Tourpedia what prentend to build and maintain open data sets of high potential value for the development of new use cases and that are now only within the reach of large tour operators.
Tourpedia, which has been developed within the framework of a European project in which Spain, France and Italy participate, lays the foundations for building a single access point for all Italian, French and Spanish open data on tourist accommodation, points of interest and attractions. It also offers a simple mechanism for the integration of new open data sources, with the aim of aggregating open data provided by the public sector from anywhere in the world.
The case of Tourpedia, although it has not reached its full potential, is frequently cited and has been the subject of some scientific articles such as “Open data for tourism: the case of Tourpedia”, where the high impact of creating useful aggregate data sets for tourism is highlighted.
In this sense, in France we find Data Tourism, a less ambitious initiative in terms of its geographical scope, but perhaps more consistent in terms of its implementation. The central idea of DataTourisme, the open data portal for tourism of the French government, is equivalent: to centralize the data collected by local and regional tourism authorities, standardize the formats and make the information freely available for reuse. Data producers gain visibility, while companies and public authorities can integrate data of different types and from different sources into applications and algorithms.
DataTourisme currently covers 96 French departments in 14 regions different that have published as open data more than 385,000 points of interest and events. For the aggregation and publication of data, the portal is committed to using linked data and proposes the DataTourism ontology.
In Spain we have Dataestur, a Segittur initiative that contains a selection of the most relevant data on tourism in Spain. The data added in Dataestur come from sources as diverse as INE, Renfe or Segittur itself and are grouped into five categories for download, consultation and study. It also highlights the fact of publishing an API for developers and reusers with a set of methods that allow automating the download of a large part of the portal's data.
Recommender systems
At present, there are not too many aggregate data sets on tourism and much less those published as linked open data, but there is abundant scientific literature that supports this line of action. In this sense, a meta-analysis of 126 scientific articles, selected for their impact, concludes that the use of linked open data to address location-based recommendation and react in real time to the needs of tourists is widespread in the field of tourism.
One of these scientific articles, a 2020 investigation demonstrates that combining a user's location with open data on TripAdvisor ratings, destination closing time, or traffic can greatly increase the quality and accuracy of recommendations. In total, we find six types of jobs, classified according to the use case they focus on:
- Independent Point Location Recommendations. Recommend to the user a point of interest around the current location based on their own preferences.
- Travel route recommendations. Provide the user with the recommended route and travel itinerary.
- Recommendations based on GPS track. They provide recommendations based on past behavior and travel patterns recorded in the form of GPS tracks.
- Recommendations based on geotagged media data. They generate recommendations based on the extraction of multimedia data from texts or photos to discover places, context information and user profiles.
- Recommendations based on ontologies. They collect datasets and create tourism ontologies for the different recommended purposes, such as a list of points of interest, popularity of locations, travel itinerary and route planning.
- Location-based friend recommendations. They aim to use the user's social connections to recommend places based on the preferences of friends.
It seems that we are beginning to see what could be a second great wave of innovation when it comes to the use of data in the tourism industry. Thanks to the generation of aggregate data sets, the use of linked data and the application of artificial intelligence and machine learning techniques, increasingly sophisticated use cases are being generated for the benefit of the tourist experience and the promotion and discovery of destinations Undoubtedly, the new initiatives that have arisen through the national digitization plans and the support of European funds will accelerate the adoption of many innovations that at the moment we see only in the scientific literature.
Content prepared by Jose Luis Marín, Senior Consultant in Data, Strategy, Innovation & Digitalization.
The contents and points of view reflected in this publication are the sole responsibility of its author.