Introduction
The National Institute of Statistics (INE) provides citizens with geographic data of social interest distributed by census sections. The use of these territorial units is, however, uncommon outside the statistical field. On the other hand, it is common to associate geographic data and variables with postal codes, since citizens are more familiar with their location and extent in their respective municipalities or provinces. For this reason, several public organizations, as well as private initiatives, collect and publish data associated with postal codes based on this familiarity.
This exercise details a method to establish a correspondence and extrapolate the associated data from census sections to their corresponding postal codes. This relationship is not direct, since the boundaries of both territorial units do not exactly coincide; that is, within the area of a postal code we find several complete census sections, and likewise, the same postal code can extend over more than one postal code. The lack of full match between both concepts requires methods to be able to extrapolate the information contained from one to the other with rigor and precision.
For this exercise, we will use INE data on average net income per person, originally available by census section, to estimate its value by postal code. Subsequently, these results will be related to the distribution of sports facilities in the province of Seville, distinguishing between Seville city and the rest of the province.
Based on this data, an exploratory analysis will be carried out aimed at identifying possible patterns related to:
The differences in the distribution of facilities by rent between Seville city and the rest of the province of Seville.
Differences in the distribution of basketball courts and gyms by rental.
The results will serve to identify territorial differences and formulate hypotheses that may help guide subsequent analyses of the coverage and distribution of these facilities, without establishing causal relationships between income level and their location.
Open geographic and statistical data from various public bodies will be used for them.
Definitions
In this exercise, we will cover the concepts of census section and postal code, which are defined below to facilitate understanding of the analysis.
Census section: it is a territorial unit used for collecting statistical information and organizing electoral processes. Generally, each census section has a size between 500 and 2000 inhabitants to facilitate the operation of pollsters and voters. Its boundaries are defined by easily identifiable elements, such as rivers or streets, which allows for clear geographic identification.
Figure 1: Census sections corresponding to the province of Seville and Seville city. Source: own elaboration based on data from the National Institute of Statistics (INE)
Postal code: this is a code that in Spain consists of five digits assigned to a specific area or geographic region to speed up the sorting, access, and delivery of postal shipments. The first two digits indicate the province in alphabetical order. The last three digits identify the municipality, postal zone, or delivery route.
Figure 2: Postal codes corresponding to the province of Seville. Source: own elaboration based on data from the National Geographic Institute (IGN).
Based on the previous definitions, Figure 3 shows the overlap of census sections and postal codes of Seville city and its surroundings, as well as the intersection zones that will be used later in the analysis.
Figure 3: Overlap of census sections and postal codes of Seville city and its surroundings. Source: own elaboration based on data from INE and IGN.
Datasets
Once the geographic units within which the study is framed are defined, we use open data from public organizations to carry out the exercise. Specifically, we will use the following data sets:
Geometry of the census tracts of the National Institute of Statistics for the year 2023..
Geometry of the postal codes in the province of Seville .
List of road sections of census sections by postal code,from the National Institute of Statistics.
Average net income per person by census section from the National Institute of Statistics.
Census of sport facilities in Andalusia, which includes information about their location - location by street, municipality, province, and postal code - and type of sports facility.
Development process
In this section, we will detail the steps to follow to associate the average net income per person of each census section with the location of sports facilities in Seville city and the rest of the province. Once we obtain the distribution of facilities by income, the analysis is deepened to study the differences between the two territories, as well as between the types of facilities depending on the sport practiced.
The analysis was developed in Python. Additionally, the Kepler.gl cartographic visualization software was used, which is easy and intuitive to use, and was already described in the execise on data visualization on earthquakes in the island of La Palma.
The Python code as well as the datasets already downloaded for processing are available in the Github repository:
Access the Github repository
The Google Colab notebook with all the commands needed to run the analysis in Python can be found at:
Access the GoogleColab notebook
1. Weight of census tracts in each postal code
The first step in this exercise is to calculate the weight of each census section in each postal code. To do this, we read the input file containing the road sections of each census section. In the reading, we first identify the codes for: province, municipality, district, and section
With these codes, we create the census section code by concatenation. A first example is found in the first entry of the file "List of road sections," where we observe the following values for the previously described fields: province: 41; municipality: 001; district: 01; section: 001
The resulting census section for that section of road is 4100101001, obtained by concatenating those fields according to the described order.
Once the census section is defined, we calculate how many times the unique combination census section and postal code appears. Next, we calculate the total number of road sections in each census section and, finally, the proportion of those sections corresponding to each postal code. In this way, we obtain the so-called weight matrix, where each combination of census section and postal code has an associated fraction or weight. Most census sections have a weight of 1 or fraction unit, which means that all their road sections are associated with a single postal code. Other census sections are divided into two or more postal codes.
In total, out of the 1,595 census tracts in the province of Seville, we obtain 1,207 census tracts whose tracts are entirely associated with a postal code, while 388 have tracts associated with more than one postal code.
Figure 4 shows the geographical distribution of census sections according to the weight of their road sections in postal codes, both in the province of Seville and in Seville city. It is observed that sections whose sections are associated with more than one postal code are located in both urban and rural areas.
Figure 4: Census sections of the province of Seville and Seville city according to the weight of their road sections in postal codes. Source: own elaboration.
Focusing on the city of Seville, it is clear how, once again, the disparity of pesos is distributed throughout the city's geography. The results highlight the need to apply these weights and to estimate the values corresponding to each postal code based on data available by census section.
2. Income association to each postal code
The next step in this exercise is to associate the average net income per person values with postal codes.
Below we can see how the INE data are structured regarding the average net income per person and the assigned census section. Specifically, Table 1 shows two census sections, belonging to different census districts of the municipality of Aguadulce, with different income values. Both sections are associated with a single postal code, and therefore, the estimated income for that postal code will result from the weighted average of the income values of the associated census sections, using the weights calculated in the previous section.
Table 1: Sample data on average net income per person and census section for the municipality of Aguadulce. Source: INE.
The result of weighting the contributions of the different census sections to estimate the average net income per person of a postal code can be seen in Table 2, following the previous example of the municipality of Aguadulce. The value obtained falls within the income values shown in Table 1.
Variable
Value
Municipality
41001
Postal code
41550
Averaged rent per person
10.539
Table 2: Estimate of the average net income per person for postal code 41550 corresponding to the Municipality with census code 41001. Source: own elaboration.
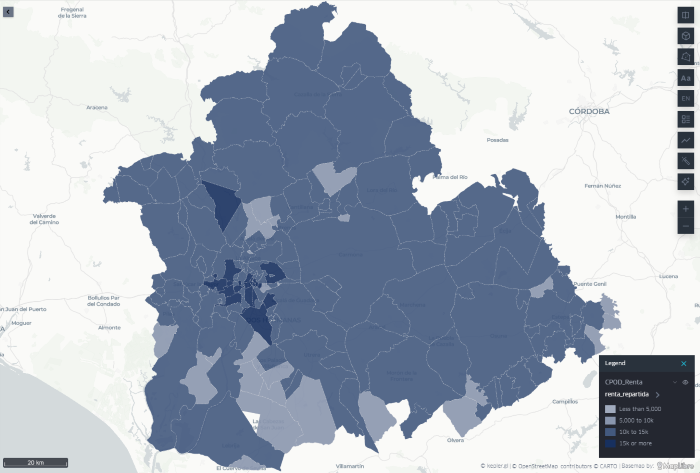
The geographical distribution of the estimated average income per person for each postal code of the province of Seville can be seen in Figure 5. It shows how the lowest incomes are located on the periphery of the province, while the highest incomes are located in urban centers, particularly in Seville city.
Figure 5: Distribution of the estimated average net income per person for each postal code of the province of Seville and Seville city. Source: own elaboration.
3. Association of sports facilities at the rental level
The next step is to establish the association of the location of sports facilities with the estimated income level for each postal code.
Table 3 shows the structure of the data set for sports facilities in Andalusia. It details the location of the facility, the municipality, the name of the road, and the postal code. It also includes the type of facility, determined by the sport practiced.
Variable
Value
IDA code
2
Facility name
PABELLON DEPORTIVO CUBIERTO
Province
Sevilla
Municipality
Castilblanco de los Arroyos
Street
CAMINO DEL TOLEDILLO
Postal code
41230
Type of facility
PISTA POLIDEPORTIVA
Table 3: Structure of the dataset of sports centers in Andalusia. Source: Junta de Andalucía.
Thanks to the correspondence obtained between estimated income values and postal codes in the previous step, we can expand the information associated with each sports facility by incorporating a new field: the estimated average net income per person for its postal code. Table 4 shows the new field included.
Variable
Value
IDA code
2
Facility name
PABELLON DEPORTIVO CUBIERTO
Province
Sevilla
Municipality
Castilblanco de los Arroyos
Street
CAMINO DEL TOLEDILLO
Postal code
41230
Type of facility
PISTA POLIDEPORTIVA
Rent per person
10.620
Table 4: Structure of the dataset of sports centers in Andalusia complemented by the estimated average net income per person. Source: own elaboration.
In this way, we have managed to relate the estimated average net income per person for each postal code with the sports facilities in Seville province or capital.
This result then allows us to develop a whole series of statistical analyses to identify possible patterns and describe the distribution of sports facilities, as presented in the following section.
4. Location of sports facilities relative to average income
By taking the average income per person both in the province of Seville and in Seville city, it is possible to identify how sports facilities are distributed relative to that average. In this way, we can observe whether facilities are located in postal codes with an estimated income lower or higher than the average of each territorial area.
At this point, we make a distinction between the province of Seville without capital and Seville as capital, as they are two very different environments. At the provincial level, we find a more dispersed population, postal codes covering a larger area, and a concentration of services in population centers.
On the other hand, in Seville city we generally find areas with smaller postal codes and a higher concentration of sports facilities outside the city center, commonly associated with sports such as football, gyms, padel courts, or swimming pools.
Figure 6 shows the number of sports facilities by average income per person estimated for their postal code in three areas: the province of Seville as a whole, the province without the capital, and the capital itself. In these three regions we observe:
Across the province, the highest concentration of facilities is found in postal codes with income values close to the provincial average, although the distribution is more frequent in some intervals slightly above it.
Compared to the province of Seville without the capital, the highest concentration of installations is also in postal codes with income values close to the average for this area. Likewise, a notable number of installations in postal codes is observed with an average net income per person below 5,000 euros per year.
In the case of Seville city, the distribution shows greater dispersion among the different income brackets. The facilities are distributed over a wider range of values, and there is not as pronounced a concentration in a single income bracket as in the rest of the province.
Figure 6: Number of sports facilities by estimated income per person for their postal code in the province of Seville, the province without capital, and Seville capital. The vertical lines indicate the estimated average income in each territorial area. Source: own elaboration
Considering the dispersion in income values, we see in Figure 7 how, despite sharing almost the same spectrum of possible incomes, at the provincial level the concentration is much greater around a low one around the average income, while in the case of Seville city sports facilities cover an interval almost twice as wide as in the province. This leads us to reflect on the homogenizing effect of cities, where a smaller space coexists with a broader income spectrum than in the province.
5. Distribution of sports facilities by type of sport
The last analysis addressed the variability associated with the type of sport practiced and, therefore, the type of sports facility. Different sports have different space needs and may be associated with different user profiles. In this preliminary analysis, we distinguish between two types of facilities, basketball courts and gyms, to perform the same calculation as in the previous section.
By filtering the data using the keywords "baloncesto" and "gimnasio" in the free text field corresponding to the sports area, we can generate a histogram for the case of Seville city and analyze the distribution of sports facilities in relation to the average income per person for each postal code. Figure 7 and Figure 8 show the results by sport, where we find:
In the case of basketball courts, the histogram distribution in Seville city shifts slightly towards income values below the average. In total, 67% of basketball courts are in postal codes with estimated average income per person below the average for Seville city.
Gyms, on the other hand, shift the histogram to the right compared to basketball courts, toward a balanced distribution according to income level. 55% of gyms are in postal codes whose estimated average income per person is below the city's average income.
a {
text-decoration: none;
color: #464feb;
}
tr th, tr td {
border: 1px solid #e6e6e6;
}
tr th {
background-color: #f5f5f5;
}
Figura 7: Distribution of basketball courts according to the estimated average net income per person for its postal code in Seville city. Source: own elaboration.
Figure 8: Distribution of basketball courts according to the estimated average net income per person for its postal code in Seville city. Source: own elaboration.
These results reveal differences in the territorial distribution of both types of facilities regarding the estimated income of the postal codes where they are located. However, additional variables would be necessary to analyze the causes that may explain these differences.
Lessons learned
Throughout this analysis exercise, we have learned to handle INE data by census sections, to estimate values originally available by census section by postal code, to apply this procedure to a real case linked to a data set from the Catalog, and to carry out a brief exploratory statistical analysis that allows us to identify patterns and formulate hypotheses for later analysis. Specifically, we have learned to:
Differentiate between census section and postal code, from its most basic definition to real examples of both units in a specific province.
Reading INE files with information grouped by census sections and detailed by provinces, municipalities, and districts, as well as creating the census section code.
Calculate the relative weight of each census section in different postal codes, delving into their complexity and taking into account the correspondence differences between both territorial units
Apply filters in Python to select data by postal code or specific text fields, such as the selected sports, thus focusing the analysis on specific cases.
Create visualizations in Python to perform basic statistical analysis, such as the histogram.
Use Kepler.gl to create maps easily and intuitively to accompany georeferenced data exercises.
Conclusions
This exercise has allowed us to become familiar with the concept of a census section, from accessing, reading, and manipulating the original INE files to a real application with data from the Junta de Andalucía.
Likewise, it has allowed us to verify how a simple and relatively short Python script is sufficient for reading and analyzing INE data, as well as for exploratory statistical analysis of that and other related datasets, demonstrating the potential of programming.
Finally, this exercise invites the formulation of a whole series of hypotheses about the distribution of public resources by income level, as well as reflection on how the city structures that distribution and with what criteria, which go beyond the focus of this simple exercise.
Next steps
From this exercise, the analysis could be expanded by incorporating new variables, such as the population of each postal code, ownership and capacity of the facilities, or their degree of utilization. This would allow calculating comparable indicators, such as the number of facilities per 10,000 inhabitants, and deepening the study of their territorial distribution. The same procedure could also be applied to other services and facilities, such as educational, health, or cultural centers.