27 documents found
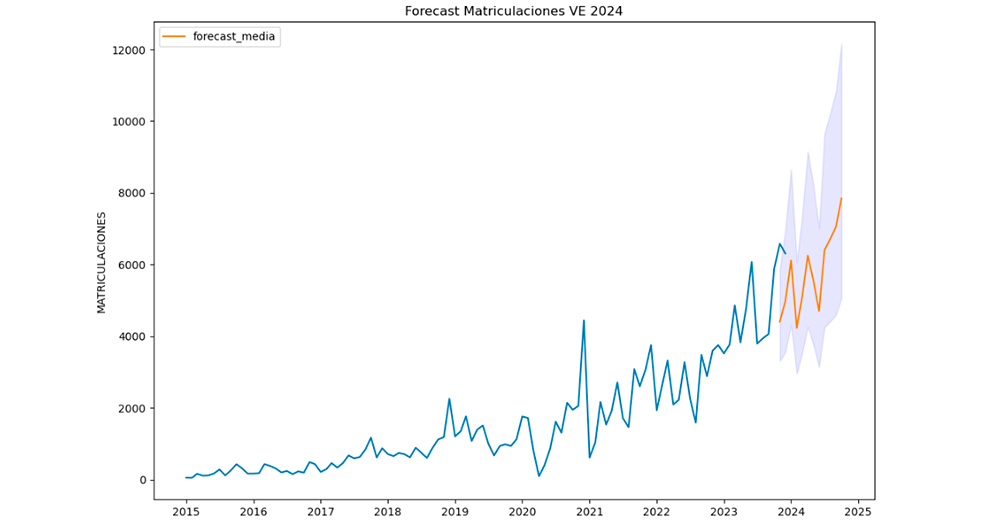
Road to electrification: Deciphering electric vehicle growth in Spain through data analytics
1. Introduction
Visualisations are graphical representations of data that allow to communicate, in a simple and effective way, the information linked to the data. The visualisation possibilities are very wide ranging, from basic representations such as line graphs, bar charts or relevant metrics,…
- Data exercises
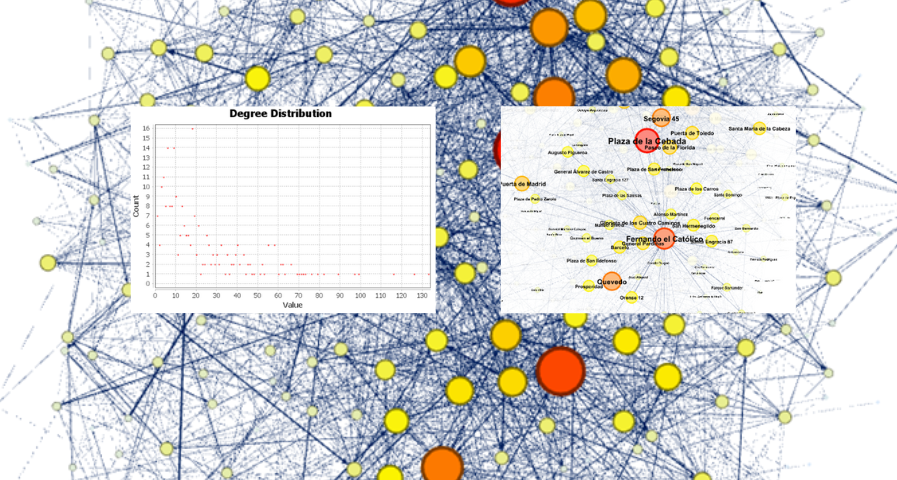
Analysis of travel networks in BICIMAD
1. Introduction
Visualizations are graphical representations of data that allow the information linked to them to be communicated in a simple and effective way. The visualization possibilities are very wide, from basic representations, such as line, bar or sector graphs, to visualizations…
- Data exercises
Analysis of toxicological findings in road traffic accidents
1. Introduction
Visualizations are graphical representations of data that allows comunication in a simple and effective way the information linked to it. The visualization possibilities are very wide, from basic representations, such as a graph of lines, bars or sectors, to visualizations…
- Data exercises

Infographics: Aporta Challenges
The Aporta Challenges are awards for new ideas and prototypes that, making use of open data, lead to efficiency improvements in a specific sector of activity. In this section you will find infographics with information about the different editions carried out.
I Aporta challenge: The value of the…
- Infographics

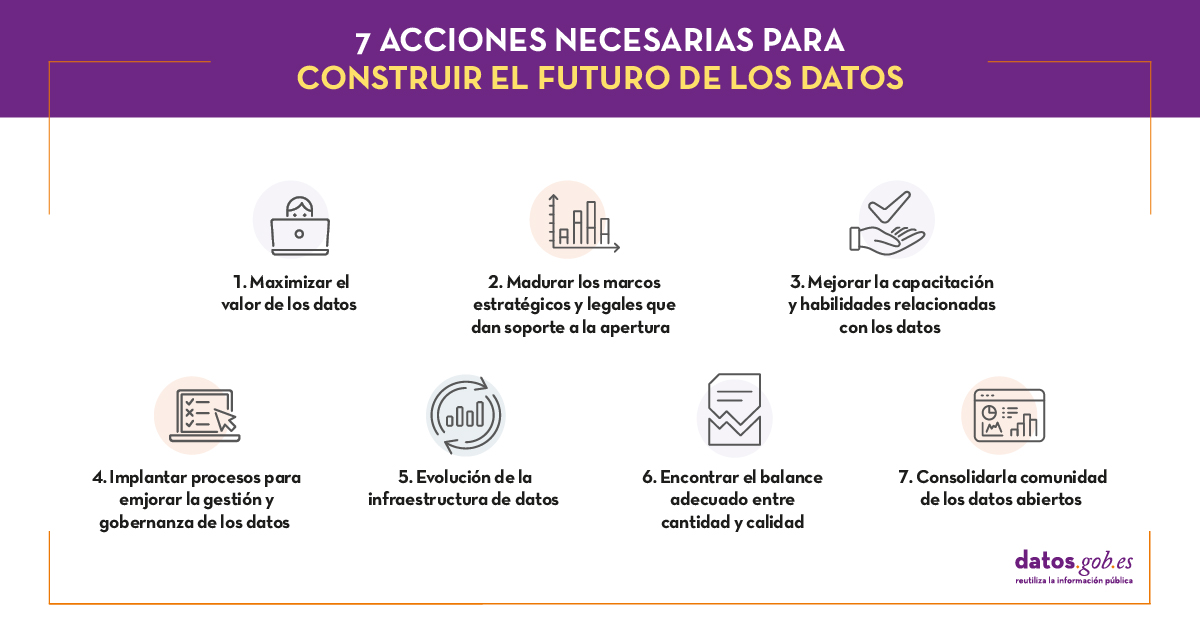
The future of open data
"Information and data are more valuable when they are shared and the opening of government data could allow [...] to examine and use public information in a more transparent, collaborative, efficient and productive way". This was, in general terms, the idea that revolutionized more than ten years…
- Reports and studies
Data-driven education technology to improve learning in the classroom and at home
The pandemic that originated last year has brought about a significant change in the way we see the world and how we relate to it. As far as the education sector is concerned, students and teachers at all levels have been forced to change the face-to-face teaching and learning methodology for a…
- Reports and studies

From the Infomediary Sector to the Data Economy. Study of Characterization of the Infomediate Sector. Edition 2020.
Infomediary activity is not classified as such in the CNAE. Therefore, the census of companies must be updated through indirect and ad hoc actions. Periodically, the National Observatory of Telecommunications and the Information Society (ONTSI) analyzes the state of this sector and collects the…
- Reports and studies

Open data beyond the public sector
From its origins, the open data movement has been focused on opening up public sector data, and even the original statement of open data principles itself refers only to data from public administrations (open government data - OGD). However, this perception has evolved and today it is more common…
- Reports and studies

Guide to accelerate data-based businesses
The data economy in the European Union exceeded € 375,000 M in 2018, with a growth close to 12% compared to 2017, and it is expected to continue growing to € 555,000 M in 2025. Then, it will reach 4% of the GDP of the EU27.
Given this situation, it is not surprising that an increasing number of…
- Guides

Open data in real time: use cases for smart cities
Open data is one of the key elements of smart cities. The collection of information, its analysis and its use make possible to address many of the challenges facing cities today, such as the creation of public services that respond to a growing population.
Among all the open datasets that are…
- Reports and studies
