Blog
In a world where immediacy is becoming increasingly important, predictive commerce has become a key tool for anticipating consumer behaviors, optimizing decisions, and offering personalized experiences. It's no longer just about reacting to the customer's needs, it's about predicting what they want before they even know it.
In this article we are going to explain what predictive commerce is and the importance of open data in it, including real examples.
What is predictive commerce?
Predictive commerce is a strategy based on data analysis to anticipate consumers' purchasing decisions. It uses artificial intelligence algorithms and statistical models to identify patterns of behavior, preferences, and key moments in the consumption cycle. Thanks to this, companies can know relevant information about which products will be most in demand, when and where a purchase will be made or which customers are most likely to purchase a certain brand.
This is of great importance in a market like the current one, where there is a saturation of products and competition. Predictive commerce allows companies to adjust inventories, prices, marketing campaigns or logistics in real time, becoming a great competitive advantage.
The role of open data in predictive commerce
These models are fed by large volumes of data: purchase history, web browsing, location or comments on social networks, among others. But the more accurate and diverse the data, the more fine-tuned the predictions will be. This is where open data plays a fundamental role, as it allows new variables to be taken into account when defining consumer behavior. Among other things, open data can help us:
- Enrich prediction models with external information such as demographic data, urban mobility or economic indicators.
- Detect regional patterns that influence consumption, such as the impact of climate on the sale of certain seasonal products.
- Design more inclusive strategies by incorporating public data on the habits and needs of different social groups.
The following table shows examples of datasets available in datos.gob.es that can be used for these tasks, at a national level, although many autonomous communities and city councils also publish this type of data along with others also of interest.
| Dataset | Example | Possible use |
|---|---|---|
| Municipal register by age and sex | National Institute of Statistics (INE) | Segment populations by territory, age, and gender. It is useful for customizing campaigns based on the majority population of each municipality or forecasting demand by demographic profile. |
| Household Budget Survey | National Institute of Statistics (INE) | It offers information on the average expenditure per household in different categories. It can help anticipate consumption patterns by socioeconomic level. |
| Consumer Price Index (CPI) | National Institute of Statistics (INE) | It disaggregates the CPI by territory, measuring how the prices of goods and services vary in each Spanish province. It is useful for adjusting prices and market penetration strategies. |
| Real-time weather warnings | Ministry for the Ecological Transition and Demographic Challenge | Alert of adverse weather phenomena. It allows correlating weather with product sales (clothing, beverages, heating, etc.). |
| Education and Digital Literacy Statistics | National Institute of Statistics (INE) | Provides information on internet usage in the last 3 months. It allows digital gaps to be identified and communication or training strategies to be adapted. |
| Facts about tourist stays | National Institute of Statistics (INE) | It reports on the average stay of tourists by autonomous community. It helps to anticipate demand in areas with high seasonal influx, such as local products or tourist services. |
| Number of prescriptions and pharmaceutical expenditure | General Mutual Society for Civil Servants of the State (MUFACE) | It offers information on the consumption of medicines by province and age subgroups. It facilitates the estimation of sales of other related medical and parapharmacy products by estimating how many users will go to the pharmacy. |
Real-world use cases
For years, we have already found companies that are using this type of data to optimize their business strategies. Let's look at some examples:
- Using weather data to optimize stock in large supermarkets
Walmart department stores use AI algorithms that incorporate weather data (such as heat waves, storms, or temperature changes) along with historical sales data, events, and digital trends, to forecast demand at a granular level and optimize inventories. This allows the replenishment of critical products to be automatically adjusted according to anticipated weather patterns. In addition, Walmart mentions that its system considers "future data" such as macroweather weather patterns, economic trends, and local demographics to anticipate demand and potential supply chain disruptions.
Tesco also uses public weather data in its predictive models. This allows you to anticipate buying patterns, such as that for every 10°C increase in temperature, barbecue sales increase by up to 300%. In addition, Tesco receives local weather forecasts up to three times a day, connecting them with data on 18 million products and the type of customers in each store. This information is shared with your suppliers to adjust shipments and improve logistics efficiency.
- Using demographic data to decide the location of premises
For years, Starbucks has turned to predictive analytics to plan its expansion. The company uses geospatial intelligence platforms, developed with GIS technology, to combine multiple sources of information – including open demographic and socioeconomic data such as population density, income level, mobility patterns, public transport or the type of nearby businesses – along with its own sales history. Thanks to this integration, you can predict which locations have the greatest potential for success, avoiding competition between stores and ensuring that each new store is located in the most suitable environment.
Domino's Pizza also used similar models to analyse whether opening a new location in one London neighbourhood would be successful and how it would affect other nearby locations, considering buying patterns and local demographics.
This approach makes it possible to predict customer flows and maximize profitability through more informed location decisions.
- Socioeconomic data for pricing based on demographics
An interesting example can be found in SDG Group, an international consulting firm specialising in advanced analytics for retail. The company has developed solutions that allow prices and promotions to be adjusted taking into account the demographic and socioeconomic characteristics of each area – such as the consumer base, location or the size of the point of sale. Thanks to these models, it is possible to estimate the elasticity of demand and design dynamic pricing strategies adapted to the real context of each area, optimizing both profitability and the shopping experience.
The future of predictive commerce
The rise of predictive commerce has been fueled by the advancement of artificial intelligence and the availability of data, both open and private. From choosing the ideal place to open a store to efficiently managing inventory, public data combined with advanced analytics allows you to anticipate consumer behaviors and needs with increasing accuracy.
However, there are still important challenges to be faced: the heterogeneity of data sources, which in many cases lack common standards; the need for robust technologies and infrastructures that allow open information to be integrated with companies' internal systems; and, finally, the challenge of ensuring ethical and transparent use, which respects people's privacy and avoids the generation of bias in models.
Overcoming these challenges will be key for predictive commerce to unfold its full potential and become a strategic tool for companies of all sizes. On this path, open data will play a fundamental role as a driver of innovation, transparency and competitiveness in the trade of the future..
Blog
Access to financial and banking data is revolutionising the sector, promoting transparency, financial inclusion and innovation in economic services. However, the management of this data faces regulatory challenges in balancing openness with security and privacy.
For this reason, there are different ways of accessing this type of data, as we will see below.
Open Banking and Open Finance versus Open Data.
These terms, although related, have important differences.
The term Open Banking refers to a system that allows banks and other financial institutions to securely and digitally share customer financial data with third parties. This requires the customers' express approval of the data sharing conditions . This consent can be cancelled at any time according to the customer's wishes.
Open Finance, on the other hand, is an evolution of Open Banking which embraces a broader range of financial products and services. When we talk about Open Finance, in addition to banking data, data on insurance, pensions, investments and other financial services are included.
In both Open Banking and Open Finance, the data is not open (Open Data), but can only be accessed by those previously authorised by the customer. The exchange of data is done through an application programming interface or API , which guarantees the agility and security of the process. All of this is regulated by the European directive on payment services in the internal market (known as PSD2), although the European Commission is working on updating the regulatory framework.
-
Applications of Open Banking and Open Finance:
The purpose of these activities is to provide access to new services based on information sharing. For example, they facilitate the creation of apps that unify access to all the bank accounts of a customer, even if they are from different providers. This improves the management and control of income and expenditure by providing an overview in a single environment.
Another example of use is that they allow providers to cross-check information more quickly. For example, by allowing access to a customer's financial data, a dealer could provide information on financing options more quickly.
Open data platforms on banking
While private banking data, like all types of personal data, is strictly regulated and cannot be openly published due to privacy protection regulations, there are sets of financial data that can be freely shared. For example, aggregate information on interest rates, economic indicators, historical stock market data, investment trends and macroeconomic statistics, which are accessible through open sources.
This data, in addition to boosting transparency and confidence in markets, can be used to monitor economic trends, prevent fraud and improve risk management globally. In addition, fintechcompanies, developers and entrepreneurs can take advantage of them to create solutions such as financial analysis tools, digital payment systems or automated advice.
Let's look at some examples of places where open data on the banking and financial sector can be obtained.
International sources
Some of the most popular international sources are:
-
European Central Bank: provides statistics and data on euro area financial markets, through various platforms. Among other information, users can download datasets on inflation, bank interest rates, balance of payments, public finances, etc.
-
World Bank: provides access to global economic data on financial development, poverty and economic growth.
-
International Monetary Fund: provides simplified access to macroeconomic and financial data, such as the outlook for the global or regional economy. It also provides open data from reports such as its Fiscal Monitor, which analyses the latest developments in public finances.
- Federal Reserve Economic Data (FRED): focuses on US economic data, including market indicators and interest rates. This repository is created and maintained by the Research Department of the Federal Reserve Bank of St. Louis.
National sources
Through the National Open Data Catalogue of datos.gob.es a large number of datasets related to the economy can be accessed. One of the most prominent publishers is the Instituto Nacional de Estadística (INE), which provides data on defaults by financial institution, mortgages, etc.
In addition, the Banco de España offers various products for those interested in the country's economic data:
- Statistics: the Banco de España collects, compiles and publishes a wide range of economic and financial statistics. It includes information on interest and exchange rates, financial accounts of the institutional sectors, balances of payments and even household financial surveys, among others.
- Dashboard: the Banco de España has also made available to the public an interactive viewer that allows quarterly and annual data on external statistics to be consumed in a more user-friendly way.
In addition, Banco de España has set up asecure room for researchers to access data that is valuable but cannot be opened to the general public due to its nature. In this sense we find:
- BELab: the secure data laboratory managed by the Banco de España, offering on-site (Madrid) and remote access. These data have been used in various projects.
- ES_DataLab: restricted microdata laboratory for researchers developing projects for scientific and public interest purposes. In this case, it brings together micro-data from various organisations, including the Bank of Spain.
Data spaces: an opportunity for secure and controlled exchange of financial data
As we have just seen, there are also options to facilitate access to financial and banking data in a controlled and secure manner. This is where data spaces come into play, an ecosystem where different actors share data in a voluntary and secure manner, following common governance, regulatory and technical mechanisms.
In this respect, Europe is pushing for a European Financial Data Facility (EEDF), a key initiative within the European Data Strategy. The EEDF consists of three main pillars:
- Public reporting data ("public disclosures"): collects financial reporting data (balance sheets, revenues, income statements), which financial firms are required by law to disclose on a regular basis. In this area is the European Single Access Point (ESAP)initiative, a centralised platform for accessing data from over 200 public reports from more than 150,000 companies.
- Private customer data of financial service providers: encompasses those data held by financial service providers such as banks. In this area is the framework for access to financial data, which covers data such as investments, insurance, pensions, loans and savings.
- Data from supervisory reports: for this type of data, the supervisory strategy, which covers data from different sectors (banks, insurance, pension funds...) has to be taken into account in order to promote digital transformation in the financial sector.
In conclusion, access to financial and banking data is evolving significantly thanks to various initiatives that have enabled greater transparency and that will encourage the development of new services, while ensuring the security and privacy of shared data. The future of the financial sector will be shaped by the ability of institutions and regulators to foster data ecosystems that drive innovation and trust in the market.
Noticia
Data reuse continues to grow in Spain, as confirmed by the last report of the Multisectorial Association of Information (ASEDIE), which analyses and describes the situation of the infomediary sector in the country. The document, now in its 13th edition, was presented last Friday, 4 April, at an event highlighting the rise of the data economy in the current landscape.
The following are the main key points of the report.
An overall profit of 146 million euros in 2023
Since 2013, ASEDIE's Infomediary sector report has been continuously monitoring this sector, made up of companies and organisations that reuse data - generally from the public sector, but also from private sources - to generate value-added products or services. Under the title "Data Economy in its infomediary scope", this year's report underlines the importance of public-private partnerships in driving the data economy and presents relevant data on the current state of the sector.
It should be noted that the financial information used for sales and employees corresponds to the financial year 2023, as financial information for the year 2024 was not yet available at the time of reporting. The main conclusions are:
- Since the first edition of the report, the number of infomediaries identified has risen from 444 to 757, an increase of 70%. This growth reflects its dynamism, with annual peaks and troughs, showing a positive evolution that consolidates its recovery after the pandemic, although there is still room for development.
- The sector is present in all the country's Autonomous Communities, including the Autonomous City of Melilla. The Community of Madrid leads the ranking with 38% of infomediaries, followed by Catalonia, Andalusia and the Community of Valencia, which represent 15%, 11% and 9%, respectively. The remaining 27% is distributed among the other autonomous communities.
- 75% of infomediary companies operate in the sub-sectors of geographic information, market, economic and financial studies, and infomediation informatics (focused on the development of technological solutions for the management, analysis, processing and visualisation of data).
- The infomediary sector shows a growth and consolidation trend, with 66% of companies operating for less than 20 years. Of this group, 32% are between 11 and 20 years old, while 34% are less than a decade old. Furthermore, the increase in companies between 11 and 40 years old indicates that more companies have managed to sustain themselves over time.
- In terms of sales, the estimated volume amounts to 2,646 million euros and the evolution of average sales increases by 10.4%. The average turnover per company is over 4.4 million euros, while the median is 442,000 euros. Compared to the previous year, the average has increased by 200,000 euros, while the median has decreased by 30,000 euros.
- It is estimated that the infomediary sector employs some 24,620 people, 64% of whom are concentrated in three sub-sectors. These figures represent a growth of 6% over the previous year. Although the overall average is 39 employees per company, the median per sub-sector is no more than 6, indicating that much of the employment is concentrated in a small number of large companies. The average turnover per employee was 108,000 euros this year, an increase of 8% compared to the previous year.
- The subscribed capital of the sector amounts to EUR 252 million. This represents an increase of 6%, which breaks the negative trend of recent years.
- 74% of the companies have reported profits. The aggregate net profit of the 539 companies for which data is available exceeded 145 million euros.
The following visual summarises some of this data:

Figure 1. Source: Asedie Infomediary Sector Report. "Data Economy in its infomediary scope" (2025).
Significant advances in the ASEDIE Top 10
The Asedie Top 10 aims to identify and promote the openness of selected datasets for reuse. This initiative seeks to foster collaboration between the public and private sectors, facilitating access to information that can generate significant economic and social benefits. Its development has taken place in three phases, each focusing on different datasets, the evolution of which has been analysed in this report:.
- Phase 1 (2019), which promoted the opening of databases of associations, cooperatives and foundations. Currently, 16 Autonomous Communities allow access to the three databases and 11 already offer NIF data. There is a lack of access to cooperatives in a community.
- Phase 2 (2020), focusing on datasets related to energy efficiency certificates, SAT registers and industrial estates. All communities have made energy efficiency data available to citizens, but one is missing in industrial parks and three in SAT registers.
- Phase 3 (2023), focusing on datasets of economic agents, education centres, health centres and ERES-ERTES (Expediente de Regulación de Empleo y Expediente de Regulación Temporal de Empleo). Progress has been made compared to last year, but work is ongoing to achieve greater uniformity of information.
New success stories and best practices
The report concludes with a section compiling several success stories of products and services developed with public information and contributing to the growth of our economy, for example:
- Energy Efficiency Improvement Calculator: allows to identify the necessary interventions and estimate the associated costs and the impact on the energy efficiency certification (EEC).
- GEOPUBLIC: is a tool designed to help Public Administrations better understand their territory. It allows for an analysis of strengths, opportunities and challenges in comparison with other similar regions, provinces or municipalities. Thanks to its ability to segment business and socio-demographic data at different scales, it facilitates the monitoring of the life cycle of enterprises and their influence on the local economy.
- New website of the DBK sectoral observatory: improves the search for sectoral information, thanks to the continuous monitoring of some 600 Spanish and Portuguese sectors. Every year it publishes more than 300 in-depth reports and 1,000 sectoral information sheets.
- Data assignment and repair service: facilitates the updating of information on the customers of electricity retailers by allowing this information to be enriched with the cadastral reference associated with the supply point. This complies with a requirement of the State Tax Administration Agency (AEAT).
The report also includes good practices of public administrations such as:
- The Callejero Digital de Andalucía Unificado (CDAU), which centralises, standardises and keeps the region's geographical and postal data up to date.
- The Geoportal of the Madrid City Council, which integrates metadata, OGC map services, a map viewer and a geolocator that respect the INSPIRE and LISIGE directives. It is easy to use for both professionals and citizens thanks to its intuitive and accessible interface.
- The Canary Statistics Institute (ISTAC), which has made an innovative technological ecosystem available to society. It features eDatos, an open source infrastructure for statistical data management ensuring transparency and interoperability.
- The Spanish National Forest Inventory (IFN) and its web application Download IFN, a basic resource for forest management, research and education. Allows easy filtering of plots for downloading.
- The Statistical Interoperability Node, which provides legal, organisational, semantic and technical coverage for the integration of the different information systems of the different levels of administrative management.
- The Open Cohesion School, an innovative educational programme of the Generalitat de Catalunya aimed at secondary school students. Students investigate publicly funded projects to analyse their impact, while developing digital skills, critical thinking and civic engagement.
- The National Publicity System for Public Subsidies and Grants, which has unveiled a completely redesigned website. It has improved its functionality with API-REST queries and downloads. More information here.
In conclusion, the infomediary sector in Spain consolidifies itself as a key driver for the economy, showing a solid evolution and steady growth. With a record number of companies and a turnover exceeding 2.6 billion euros in 2023, the sector not only generates employment, but also positions itself as a benchmark for innovation. Information as a strategic resource drives a more efficient and connected economic future. Its proper use, always from an ethical perspective, promises to continue to be a source of progress both nationally and internationally.
Noticia
Today, transparency, innovation and economic development are key to the progress of public institutions. In this context, the Cabildo of Tenerife has undertaken an ambitious open data project that goes beyond the mere publication of information. The aim of this strategy is to ffacilitate access to information, encourage the reuse of data and generate social and economic value for the island.
Through its open data portal, the Cabildo not only promotes transparency and accountability, but also drives innovation in areas as diverse as tourism, transport and the rural environment.
Scope and objectives of the project
The open data portal of the Cabildo de Tenerife publishes datasets of the entire public sector of the island, including all the local councils of the island. In particular, this includes municipalities with less than 20,000 inhabitants, as established in Law 8/2015 on Island Councils. The main objectives of this project are:
- Strengthen the internal and external culture of data use.
- Increase transparency and accountability through data.
- Generate wealth in society through the reuse of information.
In this website you can find open datasets on tourism, transport, culture and leisure and rural environment, among others. In order to offer this information the Cabildo of Tenerife benefits from the collaboration of various bodies such as:
- Transportes Interurbanos de Tenerife (TITSA)
- Tenerife Island Water Board (CIATF)
- Metropolitan of Tenerife
- SINPROMI (Insular Society for the Promotion of People with Disabilities)
- ITER (Technological Institute of Renewable Energies)
- IASS (Insular Institute for Social and Socio-sanitary Care)
- Agrocabildo
Most downloaded and significant datasets
Some of the portal's most downloaded and significant datasets include:
- Network of weather stations, with updates every 10 minutes.
- Influx of recreational areas, such as Punta Teno and Barranco de Masca, with information on the number of vehicles and people, and the itineraries of trails or routes on the island.
- Indicators of economic development and tourist occupancy, including the number of tourists accommodated by category and area.
- Prices of fruit and vegetable products in Mercatenerife.
- Public transport Origin Destination Matrix, which shows the relationships between the places of origin and destination of journeys made on the island.
The Cabildo's open data project is clearly oriented towards compliance with the Technical Interoperability Standard (NTI) for the Reuse of Information Resources and the DCAT-AP model, areas in which it continues to make progress.
Use cases and applications to incentivise reuse
Beyond publishing open datasets, the Cabildo de Tenerife actively promotes their use through the development of use cases and applications. Examples of this work include:
- Development of a urban development plan in the municipality of Santiago del Teide through the reuse of various datasets.
- Project on meteorological data forecasting.
- Tourist places and traffic scorecards. Specifically:
- On tourism: tourist accommodation places by municipality and type, and the occupancy rate by type of accommodation from 1978 to 2023.
- About traffic: dashboard from Power BI showing the average daily traffic intensity at a station on the island for the years 2021, 2022 and 2023.
On the other hand, in order to promote the reuse of the data on its portal, the Cabildo of Tenerife organises various activities, such as the I Ideas Reuse Competition, in which 25 proposals were received. This competition will be followed by a second edition that will reward the development of applications.
In addition, there are talks and webinars, such as the one organised in collaboration with the Chair of Big Data, Open Data and Blockchain of the University of La Laguna on how to use open data from Tenerife to drive innovation , which you can see again here.
Next steps AI and community building
In order to measure the impact of open data, the Cabildo de Tenerife uses tools such as Google Analytics which allows the analysis of user interaction with the available data. The next big step, as reported by the organisation, will be to implement a virtual assistant with generative AI that will allow:
- Analysing data with natural language.
- Discover trends and correlations.
- Bringing information closer to any citizen.
In parallel, the Cabildo of Tenerife will also continue working on new avenues of collaboration with the island's municipalities and other entities, with the aim of expanding the amount and variety of open data available to citizens.
From datos.gob.es, we encourage development and research professionals, students and citizens to explore, reuse and create value with Tenerife's data.
Noticia
Promoting the data culture is a key objective at the national level that is also shared by the regional administrations. One of the ways to achieve this purpose is to award those solutions that have been developed with open datasets, an initiative that enhances their reuse and impact on society.
On this mission, the Junta de Castilla y León and the Basque Government have been organising open data competitions for years, a subject we talked about in our first episode of the datos.gob.es podcast that you can listen to here.
In this post, we take a look at the winning projects in the latest editions of the open data competitions in the Basque Country and Castilla y León.
Winners of the 8th Castile and Leon Open Data Competition
In the eighth edition of this annual competition, which usually opens at the end of summer, 35 entries were submitted, from which 8 winners were chosen in different categories.
Ideas category: participants had to describe an idea to create studies, services, websites or applications for mobile devices. A first prize of 1,500€ and a second prize of 500€ were awarded.
- First prize: Green Guardians of Castilla y León presented by Sergio José Ruiz Sainz. This is a proposal to develop a mobile application to guide visitors to the natural parks of Castilla y León. Users can access information (such as interactive maps with points of interest) as well as contribute useful data from their visit, which enriches the application.
- Second prize: ParkNature: intelligent parking management system in natural spaces presented by Víctor Manuel Gutiérrez Martín. It consists of an idea to create an application that optimises the experience of visitors to the natural areas of Castilla y León, by integrating real-time data on parking and connecting with nearby cultural and tourist events.
Products and Services Category: Awarded studies, services, websites or applications for mobile devices, which must be accessible to all citizens via the web through a URL. In this category, first, second and third prizes of €2,500, €1,500 and €500 respectively were awarded, as well as a specific prize of €1,500 for students.
- First prize: AquaCyL from Pablo Varela Vázquez. It is an application that provides information about the bathing areas in the autonomous community.
- Second prize: ConquistaCyL presented by Markel Juaristi Mendarozketa and Maite del Corte Sanz. It is an interactive game designed for tourism in Castilla y León and learning through a gamified process.
- Third prize: All the sport of Castilla y León presented by Laura Folgado Galache. It is an app that presents all the information of interest associated with a sport according to the province.
- Student prize: Otto Wunderlich en Segovia by Jorge Martín Arévalo. It is a photographic repository sorted according to type of monuments and location of Otto Wunderlich's photographs.
Didactic Resource Category: consisted of the creation of new and innovative open didactic resources to support classroom teaching. These resources were to be published under Creative Commons licences. A single first prize of €1,500 was awarded in this category.
- First prize: StartUp CyL: Business creation through Artificial Intelligence and Open Data presented by José María Pérez Ramos. It is a chatbot that uses the ChatGPT API to assist in setting up a business using open data.
Data Journalism category: awarded for published or updated (in a relevant way) journalistic pieces, both in written and audiovisual media, and offered a prize of €1,500.
- First prize: Codorniz, perdiz y paloma torcaz son las especies más cazadas en Burgos, presented by Sara Sendino Cantera, which analyses data on hunting in Burgos.
Winners of the 5th edition of the Open Data Euskadi Open Data Competition
As in previous editions, the Basque open data portal opened two prize categories: an ideas competition and an applications competition, each of which was divided into several categories. On this occasion, 41 applications were submitted for the ideas competition and 30 for the applications competition.
Idea competition: In this category, two prizes of €3,000 and €1,500 have been awarded in each category.
Health and Social Category
- First prize: Development of a Model for Predicting the Volume of Patients attending the Emergency Department of Osakidetza by Miren Bacete Martínez. It proposes the development of a predictive model using time series capable of anticipating both the volume of people attending the emergency department and the level of severity of cases.
- Second prize: Euskoeduca by Sandra García Arias. It is a proposed digital solution designed to provide personalised academic and career guidance to students, parents and guardians.
Category Environment and Sustainability
- First prize: Baratzapp by Leire Zubizarreta Barrenetxea. The idea consists of the development of a software that facilitates and assists in the planning of a vegetable garden by means of algorithms that seek to enhance the knowledge related to the self-consumption vegetable garden, while integrating, among others, climatological, environmental and plot information in a personalised way for the user.
- Second prize: Euskal Advice by Javier Carpintero Ordoñez. The aim of this proposal is to define a tourism recommender based on artificial intelligence.
General Category
- First prize: Lanbila by Hodei Gonçalves Barkaiztegi. It is a proposed app that uses generative AI and open data to match curriculum vitae with job offers in a semantic way.. It provides personalised recommendations, proactive employment and training alerts, and enables informed decisions through labour and territorial indicators.
- Second prize: Development of an LLM for the interactive consultation of Open Data of the Basque Government by Ibai Alberdi Martín. The proposal consists in the development of a Large Scale Language Model (LLM) similar to ChatGPT, specifically trained with open data, focused on providing a conversational and graphical interface that allows users to get accurate answers and dynamic visualisations.
Applications competition: this modality has selected one project in the web services category, awarded with €8,000, and two more in the General Category, which have received a first prize of €8,000 and a second prize of €5,000.
Category Web Services
- First prize: Bizidata: Plataforma de visualización del uso de bicicletas en Vitoria-Gasteiz by Igor Díaz de Guereñu de los Ríos. It is a platform that visualises, analyses and downloads data on bicycle use in Vitoria-Gasteiz, and explores how external factors, such as the weather and traffic, influence bicycle use.
General Category
- First prize: Garbiñe AI by Beatriz Arenal Redondo. It is an intelligent assistant that combines Artificial Intelligence (AI) with open data from Open Data Euskadi to promote the circular economy and improve recycling rates in the Basque Country.
- Second prize: Vitoria-Gasteiz Businessmap by Zaira Gil Ozaeta. It is an interactive visualisation tool based on open data, designed to improve strategic decisions in the field of entrepreneurship and economic activity in Vitoria-Gasteiz.
All these award-winning solutions reuse open datasets from the regional portal of Castilla y León or Euskadi, as the case may be. We encourage you to take a look at the proposals that may inspire you to participate in the next edition of these competitions. Follow us on social media so you don't miss out on this year's calls!
Entrevista
In this episode we will delve into the importance of three related categories of high-value datasets. These are Earth observation and environmental data, geospatial data and mobility data. To tell us about them, we have interviewed two experts in the field:
- Paloma Abad Power, deputy director of the National Centre for Geographic Information (CNIG).
- Rafael Martínez Cebolla, geographer of the Government of Aragón.
With them we have explored how these high-value datasets are transforming our environment, contributing to sustainable development and technological innovation.
Listen to the full podcast (only available in Spanish)
Summary / Transcript of the interview
1. What are high-value datasets and why are their important?
Paloma Abad Power: According to the regulation, high-value datasets are those that ensure highest socio-economic potential and, for this, they must be easy to find, i.e. they must be accessible, interoperable and usable. And what does this mean? That means that the datasets must have their descriptions, i.e. the online metadata, which report the statistics and their properties, and which can be easily downloaded or used.
In many cases, these data are often reference data, i.e. data that serve to generate other types of data, such as thematic data, or can generate added value.
Rafael Martínez Cebolla: They could be defined as those datasets that represent phenomena that are useful for decision making, for any public policy or for any action that a natural or legal person may undertake.
In this sense, there are already some directives, which are not so recent, such as the Water Framework Directive or the INSPIRE Directive, which motivated this need to provide shared data under standards that drive the sustainable development of our society.
2. These high-value data are defined by a European Directive and an Implementing Regulation which dictated six categories of high-value datasets. On this occasion we will focus on three of them: Earth observation and environmental data, geospatial data and mobility data. What do these three categories of data have in common and what specific datasets do they cover?
Paloma Abad Power: In my opinion, these data have in common the geographical component, i.e. they are data located on the ground and therefore serve to solve problems of different nature and linked to society.
Thus, for example, we have, with national coverage, the National Aerial Orthophotography Plan (PNOA), which are the aerial images, the System of Land Occupation Information (SIOSE), cadastral parcels, boundary lines, geographical names, roads, postal addresses, protected sites - which can be both environmental and also castles, i.e. historical heritage- etc. And these categories cover almost all the themes defined by the annexes of the INSPIRE directive.
Rafael Martínez Cebolla: It is necessary to know what is pure geographic information, with a direct geographic reference, as opposed to other types of phenomena that have indirect geographic references. In today's world, 90% of information can be located, either directly or indirectly. Today more than ever, geographic tagging is mandatory for any corporation that wants to implement a certain activity, be it social, cultural, environmental or economic: the implementation of renewable energies, where I am going to eat today, etc. These high-value datasets enhance these geographical references, especially of an indirect nature, which help us to make a decision.
3. Which agencies publish these high-value datasets? In other words, where could a user locate datasets in these categories?
Paloma Abad Power: It is necessary to highlight the role of the National Cartographic System, which is an action model in which the organisations of the NSA (National State Administration) and the autonomous communities participate. It is coordinating the co-production of many unique products, funded by these organisations.
These products are published through interoperable web services. They are published, in this case, by the National Center for Geographic Information (CNIG), which is also responsible for much of the metadata for these products.
They could be located through the Catalogues of the IDEE (Spatial Data Infrastructure of Spain) or the Official Catalogue of INSPIRE Data and Services, which is also included in datos.gob.es and the European Data Portal.
And who can publish? All bodies that have a legal mandate for a product classified under the Regulation. Examples: all the mapping bodies of the Autonomous Communities, the General Directorate of Cadastre, Historical Heritage, the National Statistics Institute, the Geological and Mining Institute (IGME), the Hydrographic Institute of the Navy, the Ministry of Agriculture, Fisheries and Food (MAPA), the Ministry for Ecological Transition and the Demographic Challenge, etc. There are a multitude of organisations and many of them, as I have mentioned, participate in the National Cartographic System, provide the data and generate a single service for the citizen.
Rafael Martínez Cebolla: The National Cartographic System defines very well the degree of competences assumed by the administrations. In other words, the public administration at all levels provides official data, assisted by private enterprise, sometimes through public procurement.
The General State Administration goes up to scales of 1:25,000 in the case of the National Geographic Institute (IGN) and then the distribution of competencies for the rest of the scales is for the autonomous or local administrations. In addition, there are a number of actors, such as hydrographic confederations, state departments or the Cadastre, which have under their competences the legal obligation to generate these datasets.
For me it is an example of how it should be distributed, although it is true that it is then necessary to coordinate very well, through collegiate bodies, so that the cartographic production is well integrated.
Paloma Abad Power: There are also collaborative projects, such as, for example, a citizen map, technically known as an X, Y, Z map, which consists of capturing the mapping of all organisations at national and local level. That is, from small scales 1:1,000,000 or 1:50,000,000 to very large scales, such as 1:1000, to provide the citizen with a single multi-scale map that can be served through interoperable and standardised web services.
4. Do you have any other examples of direct application of this type of data?
Rafael Martínez Cebolla: A clear example was seen with the pandemic, with the mobility data published by the National Institute of Statistics. These were very useful data for the administration, for decision making, and from which we have to learn much more for the management of future pandemics and crises, including economic crises. We need to learn and develop our early warning systems.
I believe that this is the line of work: data that is useful for the general public. That is why I say that mobility has been a clear example, because it was the citizen himself who was informing the administration about how he was moving.
Paloma Abad Power: I am going to contribute some data. For example, according to statistics from the National Cartographic System services, the most demanded data are aerial images and digital terrain models. In 2022 there were 8 million requests and in 2023 there were 19 million requests for orthoimages alone.
Rafael Martínez Cebolla: I would like to add that this increase is also because things are being done well. On the one hand, discovery systems are improved. My general feeling is that there are many successful example projects, both from the administration itself and from companies that need this basic information to generate their products.
There was an application that was generated very quickly with de-escalation - you went to a website and it told you how far you could walk through your municipality - because people wanted to get out and walk. This example arises from spatial data that have moved out of the public administration. I believe that this is the importance of successful examples, which come from people who see a compelling need.
5. And how do you incentivise such re-use?
Rafael Martínez Cebolla: I have countless examples. Incentivisation also involves promotion and marketing, something that has sometimes failed us in the public administration. You stick to certain competences and it seems that just putting it on a website is enough. And that is not all.
We are incentivising re-use in two ways. On the one hand, internally, within the administration itself, teaching them that geographic information is useful for planning and evaluating public policies. And I give you the example of the Public Health Atlas of the Government of Aragon, awarded by an Iberian society of epidemiology the year before the pandemic. It was useful for them to know what the health of the Aragonese was like and what preventive measures they had to take.
As for the external incentives, in the case of the Geographic Institute of Aragon, it was seen that the profile entering the geoportal was very technical. The formats used were also very technical, which meant that the general public was not reached. To solve this problem, we promoted portals such as the IDE didactica, a portal for teaching geography, which reaches any citizen who wants to learn about the territory of Aragon.
Paloma Abad Power: I would like to highlight the economic benefit of this, as was shown, for example, in the economic study carried out by the National Centre for Graphic Information with the University of Leuven to measure the economic benefit of the Spatial Data Infrastructure of Spain. It measure the benefit of private companies using free and open services, rather than using, for example, Google Maps or other non-open sources..
Rafael Martínez Cebolla: For better and for worse, because the quality of the official data sometimes we wish it were better. Both Paloma in the General State Administration and I in the regional administration sometimes know that there are official data where more money needs to be invested so that the quality of the data would be better and could be reusable.
But it is true that these studies are key to know in which dimension high-value datasets move. That is to say, having studies that report on the real benefit of having a spatial data infrastructure at state or regional level is, for me, key for two things: for the citizen to understand its importance and, above all, for the politician who arrives every N years to understand the evolution of these platforms and the revolution in geospatial information that we have experienced in the last 20 years.
6. The Geographic Institute of Aragon has also produced a report on the advantages of reusing this type of data, is that right?
Rafael Martínez Cebolla: Yes, it was published earlier this year. We have been doing this report internally for three or four years, because we knew we were going to make the leap to a spatial knowledge infrastructure and we wanted to see the impact of implementing a knowledge graph within the data infrastructure. The Geographic Institute of Aragon has made an effort in recent years to analyse the economic benefit of having this infrastructure available for the citizens themselves, not for the administration. In other words, how much money Aragonese citizens save in their taxes by having this infrastructure. Today we know that having a geographic information platform saves approximately 2 million euros a year for the citizens of Aragon.
I would like to see the report for the next January or February, because I think the leap will be significant. The knowledge graph was implemented in April last year and this gap will be felt in the year ahead. We have noticed a significant increase in requests, both for viewing and downloading.
Basically from one year to the next, we have almost doubled both the number of accesses and downloads. This affects the technological component: you have to redesign it. More people are discovering you, more people are accessing your data and, therefore, you have to dedicate more investment to the technological component, because it is being the bottleneck.
7. What do you see as the challenges to be faced in the coming years?
Paloma Abad Power: In my opinion, the first challenge is to get to know the user in order to provide a better service. The technical user, the university students, the users on the street, etc. We are thinking of doing a survey when the user is going to use our geographic information. But of course, such surveys sometimes slow down the use of geographic information. That is the great challenge: to know the user in order to make services more user-friendly, applications, etc. and to know how to get to what they want and give it to them better.
There is also another technical challenge. When the spatial infrastructures began, the technical level was very high, you had to know what a visualisation service was, the metadata, know the parameters, etc. This has to be eliminated, the user can simply say I want, for example, to consult and visualise the length of the Ebro river, in a more user-friendly way. Or for example the word LiDAR, which was the Italian digital model with high accuracy. All these terms need to be made much more user-friendly.
Rafael Martínez Cebolla: Above all, let them be discovered. My perception is that we must continue to promote the discovery of spatial data without having to explain to the untrained user, or even to some technicians, that we must have a data, a metadata, a service..... No, no. Basically it is that generalist search engines know how to find high-value datasets without knowing that there is such a thing as spatial data infrastructure.
It is a matter of publishing the data under friendly standards, under accessible versions and, above all, publishing them in permanent URIs, which are not going to change. In other words, the data will improve in quality, but will never change.
And above all, from a technical point of view, both spatial data infrastructures and geoportals and knowledge infrastructures have to ensure that high-value information nodes are related to each other from a semantic and geographical point of view. I understand that knowledge networks will help in this regard. In other words, mobility has to be related to the observation of the territory, to public health data or to statistical data, which also have a geographical component. This geographical semantic relationship is key for me.
Interview clips
1. What are high-value datasets and why are their important?
2. Where can a user locate geographic data?
3. How is the reuse of data with a geographic component being encouraged?
Blog
In today's digital age, data sharing and opendatahave emerged as key pillars for innovation, transparency and economic development. A number of companies and organisations around the world are adopting these approaches to foster open access to information and enhance data-driven decision making. Below, we explore some international and national examples of how these practices are being implemented.
Global success stories
One of the global leaders in data sharing is LinkedIn with its Data for Impactprogramme. This programme provides governments and organisations with access to aggregated and anonymised economic data, based on LinkedIn's Economic Graph, which represents global professional activity. It is important to clarify that the data may only be used for research and development purposes. Access must be requested via email, attaching a proposal for evaluation, and priority is given to proposals from governments and multilateral organisations. These data have been used by organisations such as the World Bank and the European Central Bank to inform key economic policies and decisions. LinkedIn's focus on privacy and data quality ensures that these collaborations benefit both organisations and citizens, promoting inclusive, green and digitally aligned economic growth.
On the other hand, the Registry of Open Data on AWS (RODA) is an Amazon Web Services (AWS) managed repository that hosts public datasets. The datasets are not provided directly by AWS, but are maintained by government organisations, researchers, companies and individuals. We can find, at the time of writing this post, more than 550 datasets published by different organisations, including some such as the Allen Institute for Artificial Intelligence (AI2) or NASAitself. This platform makes it easy for users to leverage AWS cloud computing services for analytics.
In the field of data journalism, FiveThirtyEight, owned by ABC News, has taken a radical transparency approach by publicly sharing the data and code behind its articles and visualisations. These are accessible via GitHub in easily reusable formats such as CSV. This practice not only allows for independent verification of their work, but also encourages the creation of new stories and analysis by other researchers and journalists. FiveThirtyEight has become a role model for how open data can improve the quality and credibility of journalism.
Success stories in Spain
Spain is not lagging behind in terms of data sharing and open data initiatives by private companies. Several Spanish companies are leading initiatives that promote data accessibility and transparency in different sectors. Let us look at some examples.
Idealista, one of the most important real estate portals in the country, has published an open data set that includes detailed information on more than 180,000 homes in Madrid, Barcelona and Valencia. This dataset provides the geographical coordinates and sales prices of each property, together with its internal characteristics and official information from the Spanish cadastre. This dataset is available for access through GitHub as an R package and has become a great tool for real estate market analysis, allowing researchers and practitioners to develop automatic valuation models and conduct detailed studies on market segmentation. It should be noted that Idealista also reuses public data from organisations such as the land registry or the INE to offer data services that support decisions in the real estate market, such as contracting mortgages, market studies, portfolio valuation, etc. For its part, BBVA, through its Foundation, offers access to an extensive statistical collection with databases that include tables, charts and dynamic graphs. These databases, which are free to download, cover topics such as productivity, competitiveness, human capital and inequality in Spain, among others. They also provide historical series on the Spanish economy, investments, cultural activities and public spending. These tools are designed to complement printed publications and provide an in-depth insight into the country's economic and social developments.
In addition, Esri Spain enables its Open Data Portal, which provides users with a wide variety of content that can be consulted, analysed and downloaded. This portal includes data managed by Esri Spain, together with a collection of other open data portals developed with Esritechnology. This significantly expands the possibilities for researchers, developers and practitioners looking to leverage geospatial data in their projects. Datasets can be found in the categories of health, science and technology or economics, among others.
In the area of public companies, Spain also has outstanding examples of commitment to open data. Renfe, the main railway operator, and Red Eléctrica Española (REE), the entity responsible for the operation of the electricity system ,have developed open data programmes that facilitate access to relevant information for citizens and for the development of applications and services that improve efficiency and sustainability. In the case of REE, it is worth highlighting the possibility of consuming the available data through RESTAPIs, which facilitate the integration of applications on data sets that receive continuous updates on the state of the electricity markets.
Conclusion
Data sharing and open data represent a crucial evolution in the way organisations manage and exploit information. From international tech giants such as LinkedIn and AWS to national innovators such as Idealista and BBVA, they are providing open access to data in order to drive significant change in how decisions are made, policy development and the creation of new economic opportunities. In Spain, both private and public companies are showing a strong commitment to these practices, positioning the country as a leader in the adoption of open data and data sharing models that benefit society as a whole.
Content prepared by Juan Benavente, senior industrial engineer and expert in technologies linked to the data economy. The contents and points of view reflected in this publication are the sole responsibility of the author.
Noticia
Digital transformation has become a fundamental pillar for the economic and social development of countries in the 21st century. In Spain, this process has become particularly relevant in recent years, driven by the need to adapt to an increasingly digitalised and competitive global environment. The COVID-19 pandemic acted as a catalyst, accelerating the adoption of digital technologies in all sectors of the economy and society.
However, digital transformation involves not only the incorporation of new technologies, but also a profound change in the way organisations operate and relate to their customers, employees and partners. In this context, Spain has made significant progress, positioning itself as one of the leading countries in Europe in several aspects of digitisation.
The following are some of the most prominent reports analysing this phenomenon and its implications.
State of the Digital Decade 2024 report
The State of the Digital Decade 2024 report examines the evolution of European policies aimed at achieving the agreed objectives and targets for successful digital transformation. It assesses the degree of compliance on the basis of various indicators, which fall into four groups: digital infrastructure, digital business transformation, digital skills and digital public services.

Figure 1. Taking stock of progress towards the Digital Decade goals set for 2030, “State of the Digital Decade 2024 Report”, European Commission.
In recent years, the European Union (EU) has significantly improved its performance by adopting regulatory measures - with 23 new legislative developments, including, among others, the Data Governance Regulation and the Data Regulation- to provide itself with a comprehensive governance framework: the Digital Decade Policy Agenda 2030.
The document includes an assessment of the strategic roadmaps of the various EU countries. In the case of Spain, two main strengths stand out:
- Progress in the use of artificial intelligence by companies (9.2% compared to 8.0% in Europe), where Spain's annual growth rate (9.3%) is four times higher than the EU (2.6%).
- The large number of citizens with basic digital skills (66.2%), compared to the European average (55.6%).
On the other hand, the main challenges to overcome are the adoption of cloud services ( 27.2% versus 38.9% in the EU) and the number of ICT specialists ( 4.4% versus 4.8% in Europe).
The following image shows the forecast evolution in Spain of the key indicators analysed for 2024, compared to the targets set by the EU for 2030.

Figure 2. Key performance indicators for Spain, “Report on the State of the Digital Decade 2024”, European Commission.
Spain is expected to reach 100% on virtually all indicators by 2030. 26.7 billion (1.8 % of GDP), without taking into account private investments. This roadmap demonstrates the commitment to achieving the goals and targets of the Digital Decade.
In addition to investment, to achieve the objective, the report recommends focusing efforts in three areas: the adoption of advanced technologies (AI, data analytics, cloud) by SMEs; the digitisation and promotion of the use of public services; and the attraction and retention of ICT specialists through the design of incentive schemes.
European Innovation Scoreboard 2024
The European Innovation Scoreboard carries out an annual benchmarking of research and innovation developments in a number of countries, not only in Europe. The report classifies regions into four innovation groups, ranging from the most innovative to the least innovative: Innovation Leaders, Strong Innovators, Moderate Innovators and Emerging Innovators.
Spain is leading the group of moderate innovators, with a performance of 89.9% of the EU average. This represents an improvement compared to previous years and exceeds the average of other countries in the same category, which is 84.8%. Our country is above the EU average in three indicators: digitisation, human capital and financing and support. On the other hand, the areas in which it needs to improve the most are employment in innovation, business investment and innovation in SMEs. All this is shown in the following graph:
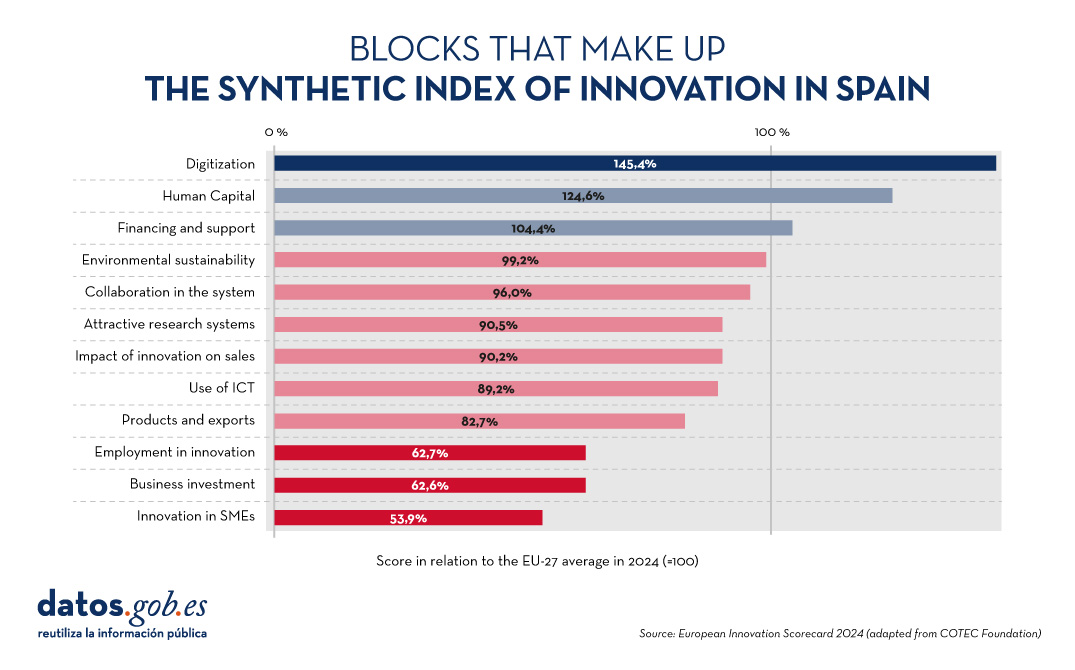
Figure 3. Blocks that make up the synthetic index of innovation in Spain, European Innovation Scorecard 2024 (adapted from the COTEC Foundation).
Spain's Digital Society Report 2023
The Telefónica Foundation also periodically publishes a report which analyses the main changes and trends that our country is experiencing as a result of the technological revolution.
The edition currently available is the 2023 edition. It highlights that "Spain continues to deepen its digital transformation process at a good pace and occupies a prominent position in this aspect among European countries", highlighting above all the area of connectivity. However, digital divides remain, mainly due to age.
Progress is also being made in the relationship between citizens and digital administrations: 79.7% of people aged 16-74 used websites or mobile applications of an administration in 2022. On the other hand, the Spanish business fabric is advancing in its digitalisation, incorporating digital tools, especially in the field of marketing. However, there is still room for improvement in aspects of big data analysis and the application of artificial intelligence, activities that are currently implemented, in general, only by large companies.
Artificial Intelligence and Data Talent Report
IndesIA, an association that promotes the use of artificial intelligence and Big Data in Spain, has carried out a quantitative and qualitative analysis of the data and artificial intelligence talent market in 2024 in our country.
According to the report, the data and artificial intelligence talent market represents almost 19% of the total number of ICT professionals in our country. In total, there are 145,000 professionals (+2.8% from 2023), of which only 32% are women. Even so, there is a gap between supply and demand, especially for natural language processing engineers. To address this situation, the report analyses six areas for improvement: workforce strategy and planning, talent identification, talent activation, engagement, training and development, and data-driven culture .
Other reports of interest
The COTEC Foundation also regularly produces various reports on the subject. On its website we can find documents on the budget execution of R&D in the public sector, the social perception of innovation or the regional talent map.
For their part, the Orange Foundation in Spain and the consultancy firm Nae have produced a report to analyse digital evolution over the last 25 years, the same period that the Foundation has been operating in Spain. The report highlights that, between 2013 and 2018, the digital sector has contributed around €7.5 billion annually to the country's GDP.
In short, all of them highlight Spain's position among the European leaders in terms of digital transformation, but with the need to make progress in innovation. This requires not only boosting economic investment, but also promoting a cultural change that fosters creativity. A more open and collaborative mindset will allow companies, administrations and society in general to adapt quickly to technological changes and take advantage of the opportunities they bring to ensure a prosperous future for Spain.
Do you know of any other reports on the subject? Leave us a comment or write to us at dinamizacion@datos.gos.es.
Application
ELISA: The Plan in figures is a tool launched by the Spanish government to visualise updated data on the implementation of the investments of the Recovery, Transformation and Resilience Plan (PRTR). Through intuitive visualisations, this tool provides information on the number of companies and households that have received funding, the size of the beneficiary companies and the investments made in the different levers of action defined in the Plan.
The tool also provides details of the funds managed and executed in each Autonomous Community. In this way, the territorial distribution of the projects can be seen. In addition, the tool is accompanied by territorial sheets, which show a more qualitative detail of the impact of the Recovery Plan in each Autonomous Community.