Blog
Artificial intelligence (AI) has revolutionised various aspects of society and our environment. With ever faster technological advances, AI is transforming the way daily tasks are performed in different sectors of the economy.
As such, employment is one of the sectors where it is having the greatest impact. Among the main developments, this technology is introducing new professional profiles and modifying or transforming existing jobs. Against this backdrop, questions are being asked about the future of employment and how it will affect workers in the labour market.
What are the key figures for AI in employment?
The International Monetary Fund has recently pointed out: Artificial Intelligence will affect 40% of jobs worldwide, both replacing some and complementing and creating new ones.
The irruption of AI in the world of work has made it easier for some tasks that previously required human intervention to be carried out more automatically. Moreover, as the same international organisation warns, compared to other automation processes experienced in past decades, the AI era is also transforming highly skilled jobs.
The document also states that the impact of AI on the workplace will differ according to the country's level of development. It will be greater in the case of advanced economies, where up to 6 out of 10 jobs are expected to be conditioned by this technology. In the case of emerging economies, it will reach up to 40% and, in low-income countries, it will be reflected in 26% of jobs. For its part, the International Labour Organisation (ILO) also warns in its report ‘Generative AI and Jobs: A global analysis of potential effects on job quantity and quality’ that the effects of the arrival of AI in administrative positions will particularly affect women, due to the high rate of female employment in this labour sector.
In the Spanish case, according to figures from last year, not only is the influence of AI on jobs observed, but also the difficulty of finding people with specialised training. According to the report on talent in artificial intelligence prepared by Indesia, last year 20% of job offers related to data and Artificial Intelligence were not filled due to a lack of professionals with specialisation.
Future projections
Although there are no reliable figures yet to see what the next few years will look like, some organisations, such as the OECD, say that we are still at an early stage in the development of AI in the labour market, but on the verge of a large-scale breakthrough. According to its ‘Employment Outlook 2023’ report, ‘business adoption of AI remains relatively low’, although it warns that ‘rapid advances, including in generative AI (e.g. ChatGPT), falling costs and the growing availability of AI-skilled workers suggest that OECD countries may be on the verge of an AI revolution’. It is worth noting that generative AI is one of the fields where open data is having a major impact.
And what will happen in Spain? Perhaps it is still too early to point to very precise figures, but the report produced last year by Indesia already warned that Spanish industry will require more than 90,000 data and AI professionals by 2025. This same document also points out the challenges that Spanish companies will have to face, as globalisation and the intensification of remote work means that national companies are competing with international companies that also offer 100% remote employment, ‘with better salary conditions, more attractive and innovative projects and more challenging career plans’, says the report.
What jobs is AI changing?
Although one of the greatest fears of the arrival of this technology in the world of work is the destruction of jobs, the latest figures published by the International Labour Organisation (ILO) point to a much more promising scenario. Specifically, the ILO predicts that AI will complement jobs rather than destroy them.
There is not much unanimity on which sectors will be most affected. In its report ‘The impact of AI on the workplace: Main findings from the OECD AI surveys of employers and workers', the OECD points out that manufacturing and finance are two of the areas most affected by the irruption of Artificial Intelligence.
On the other hand, Randstad has recently published a report on the evolution of the last two years with a vision of the future until 2033. The document points out that the most affected sectors will be jobs linked to commerce, hospitality and transport. Among those jobs that will remain largely unaffected are agriculture, livestock and fishing, associative activities, extractive industries and construction. Finally, there is a third group, which includes employment sectors in which new profiles will be created. In this case, we find programming and consultancy companies, scientific and technical companies, telecommunications and the media and publications.
Beyond software developers, the new jobs that artificial intelligence is bringing will include everything from natural language processing experts or AI Prompt engineers (experts in asking the questions needed to get generative AI applications to deliver a specific result) to algorithm auditors or even artists.
Ultimately, while it is too early to say exactly which types of jobs are most affected, organisations point to one thing: the greater the likelihood of automation of job-related processes, the greater the impact of AI in transforming or modifying that job profile.
The challenges of AI in the labour market
One of the bodies that has done most research on the challenges and impacts of AI on employment is the ILO. At the level of needs, the ILO points to the need to design policies that support an orderly, just and consultative transition. To this end, it notes that workers' voice, training and adequate social protection will be key to managing the transition. ‘Otherwise, there is a risk that only a few countries and well-prepared market participants will benefit from the new technology,’ it warns.
For its part, the OECD outlines a series of recommendations for governments to accommodate this new employment reality, including the need to:
-
Establish concrete policies to ensure the implementation of key principles for the reliable use of AI. Through the implementation of these mechanisms, the OECD believes that the benefits that AI can bring to the workplace are harnessed, while at the same time addressing potential risks to fundamental rights and workers' well-being.
-
Create new skills, while others will change or become obsolete. To this end, he points to training, which is needed ‘both for the low-skilled and older workers, but also for the high-skilled’. Therefore, ‘governments should encourage business to provide more training, integrate AI skills into education and support diversity in the AI workforce’.
In summary, although the figures do not yet allow us to see the full picture, several international organisations do agree that the AI revolution is coming. They also point to the need to adapt to this new scenario through internal training in companies to be able to cope with the needs posed by the technology. Finally, in governmental matters, organisations such as the ILO point out that it is necessary to ensure that the transition in the technological revolution is fair and within the margins of reliable uses of Artificial Intelligence.
Blog
Geographic data allow us to learn about the world around us. From locating optimal travel routes to monitoring natural ecosystems, from urban planning and development to emergency management, geographic data has great potential to drive development and efficiency in multiple economic and social areas. They are therefore considered high-value datasets by the European Commission, and have a specific obligations to make their publication accessible and interoperable.
In order to understand the real impact of this type of data, several reports and studies have been carried out. The following are several of them, which address the challenge of measuring the impact of geographic information.
Geospatial data in the Ministry of Transport and Sustainable Mobility. Impact of information co-produced by IGN and CNIG (2024)
- You can read the full report here.
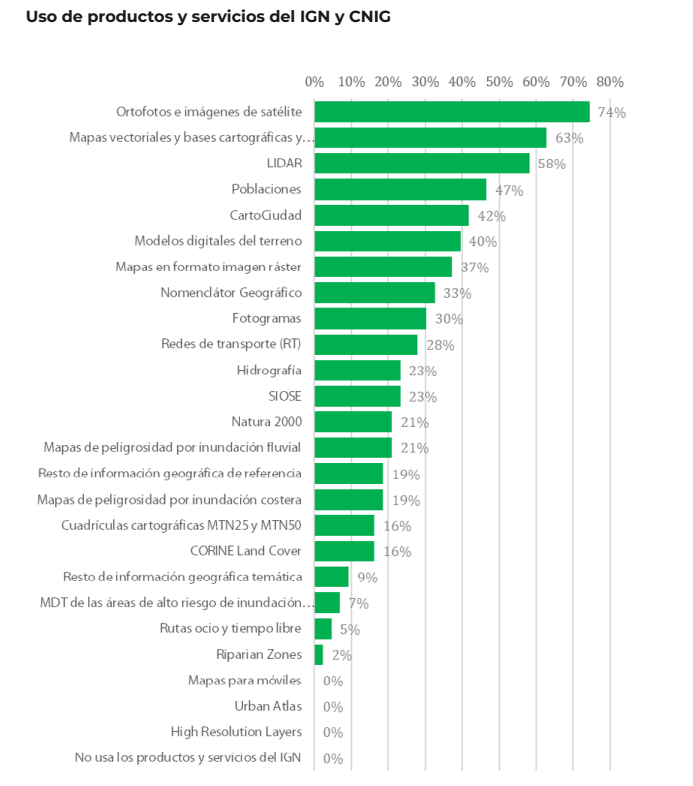
This report, produced by ASEDIE and CNIG, aims to draw conclusions about the use and perception of the services co-produced by National Geographic Institute (IGN) and National Centre for Geographic Information (CNIG) in order to understand the benefit they bring to the daily activity of the companies that use them and to society. For this purpose, a survey was carried out among companies using geospatial data, thanks to which a classification of companies reusing geographic data could be drawn up.
Of the 170 companies considered, 70.0% are self-employed and micro-enterprises (less than 10 employees). These companies are mainly located in the Community of Madrid (25.6%), Catalonia (16.3%), Andalusia (14%), Valencia (11.6%) and Castilla y León (11.6%). 53.3% claim to reuse data from Spatial Data Infrastructures (SDI) and 51% open data from INE, among others. The most used products are orthophotos and satellite images (74%), followed by vector maps and cartographic and topographic databases (63%), and LiDAR (58%).
In terms of economic impact, the report estimates an average impact of 35.7% on the sales of the companies surveyed. Specifically, open geographic information from the IGN and CNIG account for an impact of 12.4% of sales.
The report also includes the analysis of collected use cases, as well as in-depth interviews with companies in the sector as examples of best practices and, on the other hand, updates the information from Asedie's annual report on the Data Economy in its 2023 infomediary scope with respect to the economic data of the geographic subsector.
Economic benefits of the SDI central node by CNIG and University of Leuven (2021)
- You can read the full report here.
This document develops and tests a methodology for estimating the economic benefits generated by the Spanish Spatial Data Infrastructure (IDEE), which establishes the publication and accessibility of spatial data through free geographic web services for viewing and downloading produced by cartographic, environmental, cadastral and land observation organisations at national, regional and local level since 2004, in accordance with norms, standards and recommendations that guarantee their interoperability.
The study was to answer the question of what would happen if the NSDI were to disappear. For the study, only the central node of the NSDIE was considered, understanding as such the geographic services and data co-produced among the partners of the National Cartographic System, and focusing on web map services (WMS) and map tiles (WMTS). The nodes of ministries, autonomous communities and local entities were not part of its scope.
Two investigation paths were used to carry out the calculation:
- Comparison with the costs of using Google Maps. The application of the different scenarios led to a profit/value of the 6 WMTS and 13 WMS of minimum 355,646 and maximum 891,144 euros.
- Comparison with other countries' charges for the use of their data and services. Despite the difficulties in calculating the rate per application, due to the existence of different approaches in each country, the total value of the FDIE was estimated at between 34,000 and 14 million euros.
This report joins others produced by the NSDI, such as these documents to estimate the average cost of metadata generation or the implementation of visualisation and download services for Inspire-compliant datasets, both carried out in 2019.
In order to allow other organisations to adapt the study to their particularities, an Excel file has been created, as a calculator, with the following calculation template.
ICEARAGON and ARAGEA Performance Report by the Government of Aragon (2024)
- You can read the full report here.
Regional governments are also interested in knowing the impact of their geographic information services. This is the case of the Government of Aragon, which recently presented a report on the performance of the Spatial Knowledge Infrastructure of Aragon (ICEARAGON) and the Active Geodesy Network of Aragon (AREAGA).
In total, these services are estimated to have saved almost two million euros for all Aragonese citizens by 2023. According to the report, ICEARAGÓN received almost 5 million visits in 2023, an increase of 58.6% over 2022. These users made 1.7 million downloads. Most of the information downloaded (47.8%) refers to environmental layers. Information on administrative boundaries (13.8%) and maps of Aragon (13.4%) were also very successful. Regarding the user profile, 71% are from the surveying field and 27% belong to the agricultural sector.
These reports serve as a basis for the work of the European Commission on a regular basis, compiling progress in the different areas of INSPIRE implementation. As a result of this work, annual reports are generated for each country, including a section on costs and benefits.
All this work on measuring and estimating benefits highlights the economic value of providing geographic data and services to society. As a result, new products and services can be created that boost the economy of the whole country and provide benefits to all its citizens.
Noticia
The Multisectoral Information Partnership (ASEDIE) has published the twelfth edition of its "Report on the Infomediary Sector", that reviews the initiatives to boost the data economy in the country. In addition, this edition commemorates the 25th anniversary of the association in the sector.
In the 12th Report on the Data Economy in the infomediary sphere, ASEDIE provides accurate figures on the sector in Spain to continue its annual work of highlighting and conveying its size and importance. The presentation of this edition took place at Madrid International Lab's auditorium on 20 March.
The main findings of the study are summarised below.
More than 23,000 people work in the infomediary sector in Spain
In the document, ASEDIE measures the health of the sector of the 756 public data reuse companies that have been identified as active. These companies employ almost 23,300 people in Spain, which translates into an increase of 3.6% compared to the figures in the previous report. The re-using companies analysed in the report take advantage of both public and private information to create value-added products for other companies and all society.
In addition, the study notes "the continued growth of the infomediary sector, with new players joining year after year, improving the information exchanges inherent in the sector and increasing user confidence". Reflecting this positive trend, the sector generated an overall turnover of 2,331 million euros, an increase of 2.4% over the previous year.
In order to identify these results, ASEDIE carries out an analysis methodology also described in its report that subdivides the sectors involved. Among the companies analysed, the majority belong to the Geographic Information sector (22%), Market Research (19%), Financial Economics (19%) and IT Infomediation (17%). In total, these three sectors account for 76% of the companies.
Of all the companies analysed, 63% were created more than 10 years ago, although 51 companies have been created in the last year. And half of the infomediaries have a turnover of more than 473,000 euros, according to the report. A second group of two sub-sectors (Technical Consultancy and Publishing) contribute 14% more, leaving the remaining sub-sectors (Culture, Directorial, Meteorological and Tourism), with a representation of 9%.

Results of the survey carried out among the Autonomous Regions and the academic sector
Other revealing content included in the 12th ASEDIE Report is a summary of the first steps taken by the newly created ASEDIE TOP 10, as well as the analysis of a survey of two main groups: those responsible for transparency and open data issues in the 17 Autonomous Communities and the academic sector.
The TOP ASEDIE is a public-private collaboration initiative, supported by the 17 Autonomous Communities, which seeks to promote the opening of certain datasets and which has been carried out periodically. The initiative was launched in 2019 with the TOP 3, which prompted the opening of the databases of Associations, Cooperatives and Foundations. Two years later, a second Top 3 ASEDIE (Energy Efficiency Certificates, SAT Registers and Industrial Estates) was launched, which is now a TOP 10 with four new databases: economic agents, education centres, health centres and ERES-ERTES.
The survey also drew a number of conclusions :
- 75% of respondents indicate that they are satisfied with the technological capacity they have with regard to data openness.
- 63% of respondents are not aware of the socio-economic impact of opening their databases.
- 50% of respondents do not know the profile of their users and customers. However, 75% have systems in place to measure access, downloads and visits to the datasets they publish.
- 89% of academic institutions say that public data enables them to develop useful solutions.
Success stories: exemplary infomediary companies
In addition to offering results on the state of the infomediary sector in Spain and the conclusions of the surveys carried out in the Autonomous Regions and the academic sphere, the report highlights some use cases that stand out as successful in the task of obtaining value from the reuse of data. Some of these are summarised below:
- API connector with Salesforce and Microsoft Dynamics: a solution that automatically integrates the data of 7.6 million companies and freelancers in Spain and Portugal into Salesforce and Microsoft Dynamics, the two main CRMs on the market.
- GEOCODE Fraud from CTI Solutions: a data validation and alert management solution for the detection of irregular transactions.
- InAtlas Geomarketing Worldwide: a tool based on advanced Location Analytics and Geodata Visualisation technologies, to search for customers and optimal locations to expand business.
In summary, through its report, ASEDIE reveals the growing importance of the data economy and clearly reflects Spain's transition towards a more informed and transparent society, evidencing the fundamental role played by the infomediary sector. We see the need to overcome existing challenges through greater collaboration between all stakeholders to ensure a future where data is managed in a more open, accessible, effective and secure manner.
Documentación
1. Introduction
Visualisations are graphical representations of data that allow to communicate, in a simple and effective way, the information linked to the data. The visualisation possibilities are very wide ranging, from basic representations such as line graphs, bar charts or relevant metrics, to interactive dashboards.
In this section of "Step-by-Step Visualisations we are regularly presenting practical exercises making use of open data available at datos.gob.es or other similar catalogues. They address and describe in a simple way the steps necessary to obtain the data, carry out the relevant transformations and analyses, and finally draw conclusions, summarizing the information.
Documented code developments and free-to-use tools are used in each practical exercise. All the material generated is available for reuse in the GitHub repository of datos.gob.es.
In this particular exercise, we will explore the current state of electric vehicle penetration in Spain and the future prospects for this disruptive technology in transport.
Access the data lab repository on Github
Run the data pre-processing code on Google Colab
In this video (available with English subtitles), the author explains what you will find both on Github and Google Colab.
2. Context: why is the electric vehicle important?
The transition towards more sustainable mobility has become a global priority, placing the electric vehicle (EV) at the centre of many discussions on the future of transport. In Spain, this trend towards the electrification of the car fleet not only responds to a growing consumer interest in cleaner and more efficient technologies, but also to a regulatory and incentive framework designed to accelerate the adoption of these vehicles. With a growing range of electric models available on the market, electric vehicles represent a key part of the country's strategy to reduce greenhouse gas emissions, improve urban air quality and foster technological innovation in the automotive sector.
However, the penetration of EVs in the Spanish market faces a number of challenges, from charging infrastructure to consumer perception and knowledge of EVs. Expansion of the freight network, together with supportive policies and fiscal incentives, are key to overcoming existing barriers and stimulating demand. As Spain moves towards its sustainability and energy transition goals, analysing the evolution of the electric vehicle market becomes an essential tool to understand the progress made and the obstacles that still need to be overcome.
3. Objective
This exercise focuses on showing the reader techniques for the processing, visualisation and advanced analysis of open data using Python. We will adopt a "learning-by-doing" approach so that the reader can understand the use of these tools in the context of solving a real and topical challenge such as the study of EV penetration in Spain. This hands-on approach not only enhances understanding of data science tools, but also prepares readers to apply this knowledge to solve real problems, providing a rich learning experience that is directly applicable to their own projects.
The questions we will try to answer through our analysis are:
- Which vehicle brands led the market in 2023?
- Which vehicle models were the best-selling in 2023?
- What market share will electric vehicles absorb in 2023?
- Which electric vehicle models were the best-selling in 2023?
- How have vehicle registrations evolved over time?
- Are we seeing any trends in electric vehicle registrations?
- How do we expect electric vehicle registrations to develop next year?
- How much CO2 emission reduction can we expect from the registrations achieved over the next year?
4. Resources
To complete the development of this exercise we will require the use of two categories of resources: Analytical Tools and Datasets.
4.1. Dataset
To complete this exercise we will use a dataset provided by the Dirección General de Tráfico (DGT) through its statistical portal, also available from the National Open Data catalogue (datos.gob.es). The DGT statistical portal is an online platform aimed at providing public access to a wide range of data and statistics related to traffic and road safety. This portal includes information on traffic accidents, offences, vehicle registrations, driving licences and other relevant data that can be useful for researchers, industry professionals and the general public.
In our case, we will use their dataset of vehicle registrations in Spain available via:
- Open Data Catalogue of the Spanish Government.
- Statistical portal of the DGT.
Although during the development of the exercise we will show the reader the necessary mechanisms for downloading and processing, we include pre-processed data
in the associated GitHub repository, so that the reader can proceed directly to the analysis of the data if desired.
*The data used in this exercise were downloaded on 04 March 2024. The licence applicable to this dataset can be found at https://datos.gob.es/avisolegal.
4.2. Analytical tools
- Programming language: Python - a programming language widely used in data analysis due to its versatility and the wide range of libraries available. These tools allow users to clean, analyse and visualise large datasets efficiently, making Python a popular choice among data scientists and analysts.
- Platform: Jupyter Notebooks - ia web application that allows you to create and share documents containing live code, equations, visualisations and narrative text. It is widely used for data science, data analytics, machine learning and interactive programming education.
-
Main libraries and modules:
- Data manipulation: Pandas - an open source library that provides high-performance, easy-to-use data structures and data analysis tools.
- Data visualisation:
- Matplotlib: a library for creating static, animated and interactive visualisations in Python..
- Seaborn: a library based on Matplotlib. It provides a high-level interface for drawing attractive and informative statistical graphs.
- Statistics and algorithms:
- Statsmodels: a library that provides classes and functions for estimating many different statistical models, as well as for testing and exploring statistical data.
- Pmdarima: a library specialised in automatic time series modelling, facilitating the identification, fitting and validation of models for complex forecasts.
5. Exercise development
It is advisable to run the Notebook with the code at the same time as reading the post, as both didactic resources are complementary in future explanations
The proposed exercise is divided into three main phases.
5.1 Initial configuration
This section can be found in point 1 of the Notebook.
In this short first section, we will configure our Jupyter Notebook and our working environment to be able to work with the selected dataset. We will import the necessary Python libraries and create some directories where we will store the downloaded data.
5.2 Data preparation
This section can be found in point 2 of the Notebookk.
All data analysis requires a phase of accessing and processing to obtain the appropriate data in the desired format. In this phase, we will download the data from the statistical portal and transform it into the format Apache Parquet format before proceeding with the analysis.
Those users who want to go deeper into this task, please read this guide Practical Introductory Guide to Exploratory Data Analysis.
5.3 Data analysis
This section can be found in point 3 of the Notebook.
5.3.1 Análisis descriptivo
In this third phase, we will begin our data analysis. To do so,we will answer the first questions using datavisualisation tools to familiarise ourselves with the data. Some examples of the analysis are shown below:
- Top 10 Vehicles registered in 2023: In this visualisation we show the ten vehicle models with the highest number of registrations in 2023, also indicating their combustion type. The main conclusions are:
- The only European-made vehicles in the Top 10 are the Arona and the Ibiza from Spanish brand SEAT. The rest are Asians.
- Nine of the ten vehicles are powered by gasoline.
- The only vehicle in the Top 10 with a different type of propulsion is the DACIA Sandero LPG (Liquefied Petroleum Gas).
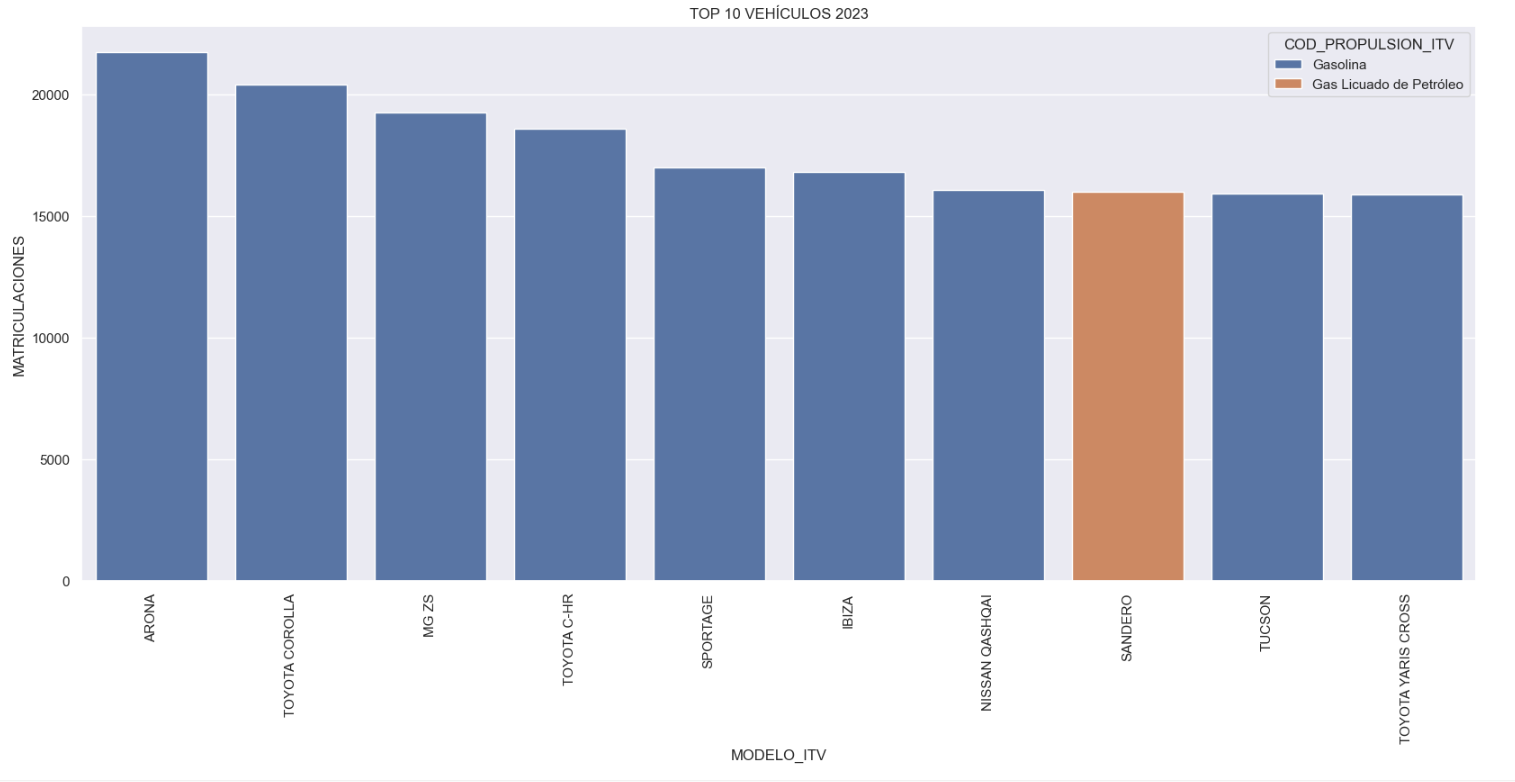
Figure 1. Graph "Top 10 vehicles registered in 2023"
- Market share by propulsion type: In this visualisation we represent the percentage of vehicles registered by each type of propulsion (petrol, diesel, electric or other). We see how the vast majority of the market (>70%) was taken up by petrol vehicles, with diesel being the second choice, and how electric vehicles reached 5.5%.
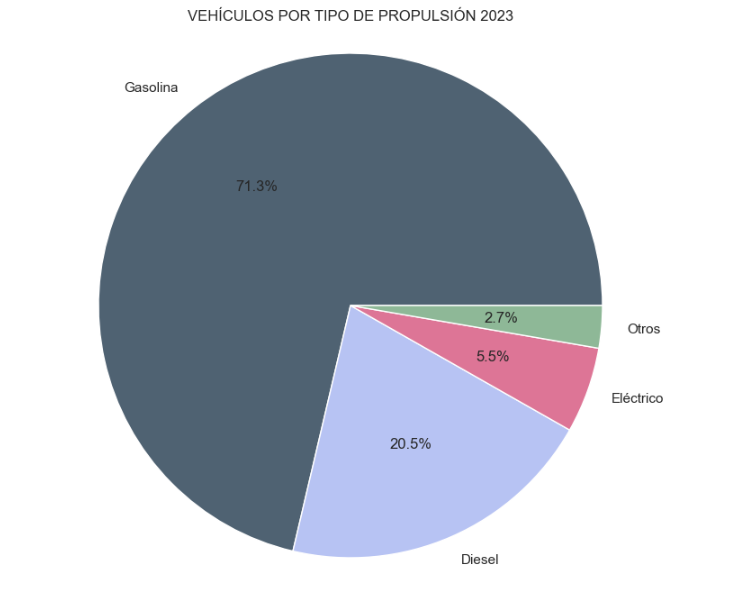
Figure 2. Graph "Market share by propulsion type".
- Historical development of registrations: This visualisation represents the evolution of vehicle registrations over time. It shows the monthly number of registrations between January 2015 and December 2023 distinguishing between the propulsion types of the registered vehicles, and there are several interesting aspects of this graph:
- We observe an annual seasonal behaviour, i.e. we observe patterns or variations that are repeated at regular time intervals. We see recurring high levels of enrolment in June/July, while in August/September they decrease drastically. This is very relevant, as the analysis of time series with a seasonal factor has certain particularities.
- The huge drop in registrations during the first months of COVID is also very remarkable.
- We also see that post-covid enrolment levels are lower than before.
- Finally, we can see how between 2015 and 2023 the registration of electric vehicles is gradually increasing.
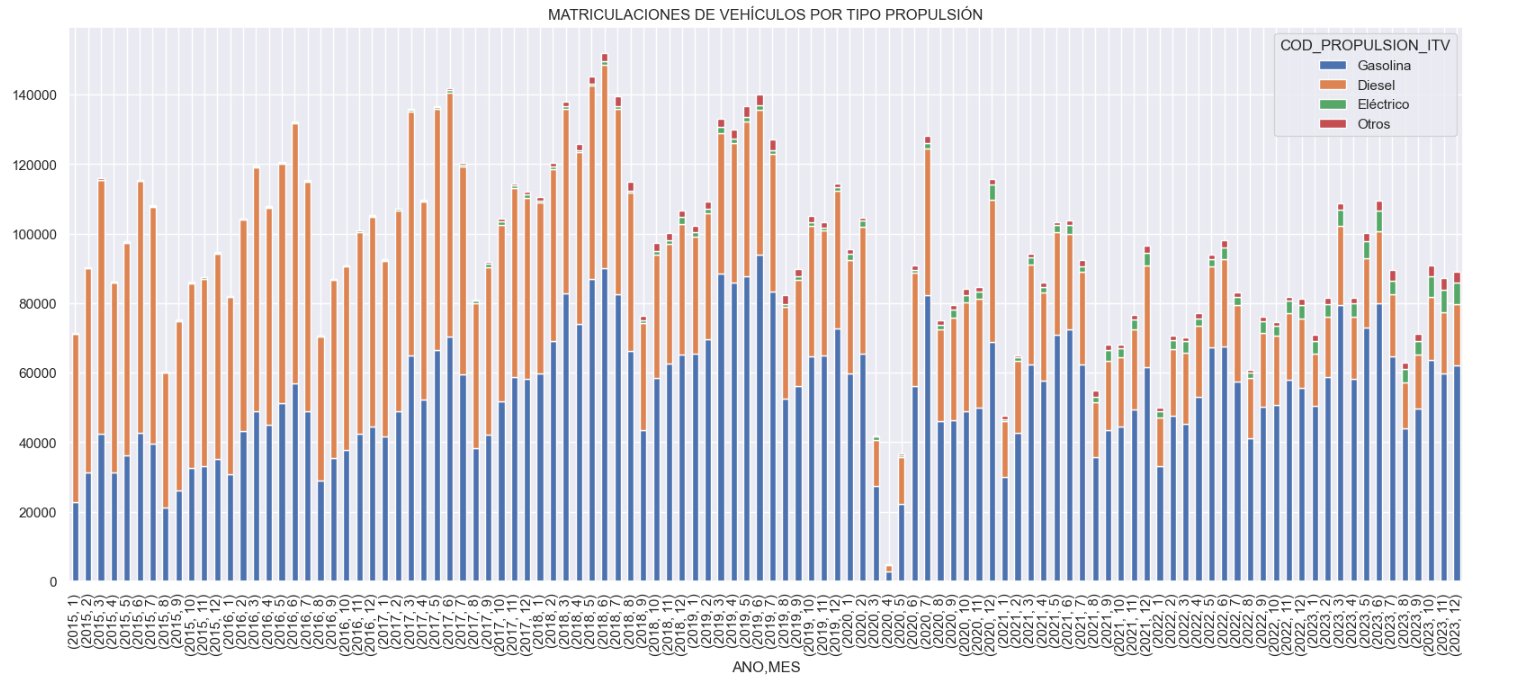
Figure 3. Graph "Vehicle registrations by propulsion type".
- Trend in the registration of electric vehicles: We now analyse the evolution of electric and non-electric vehicles separately using heat maps as a visual tool. We can observe very different behaviours between the two graphs. We observe how the electric vehicle shows a trend of increasing registrations year by year and, despite the COVID being a halt in the registration of vehicles, subsequent years have maintained the upward trend.
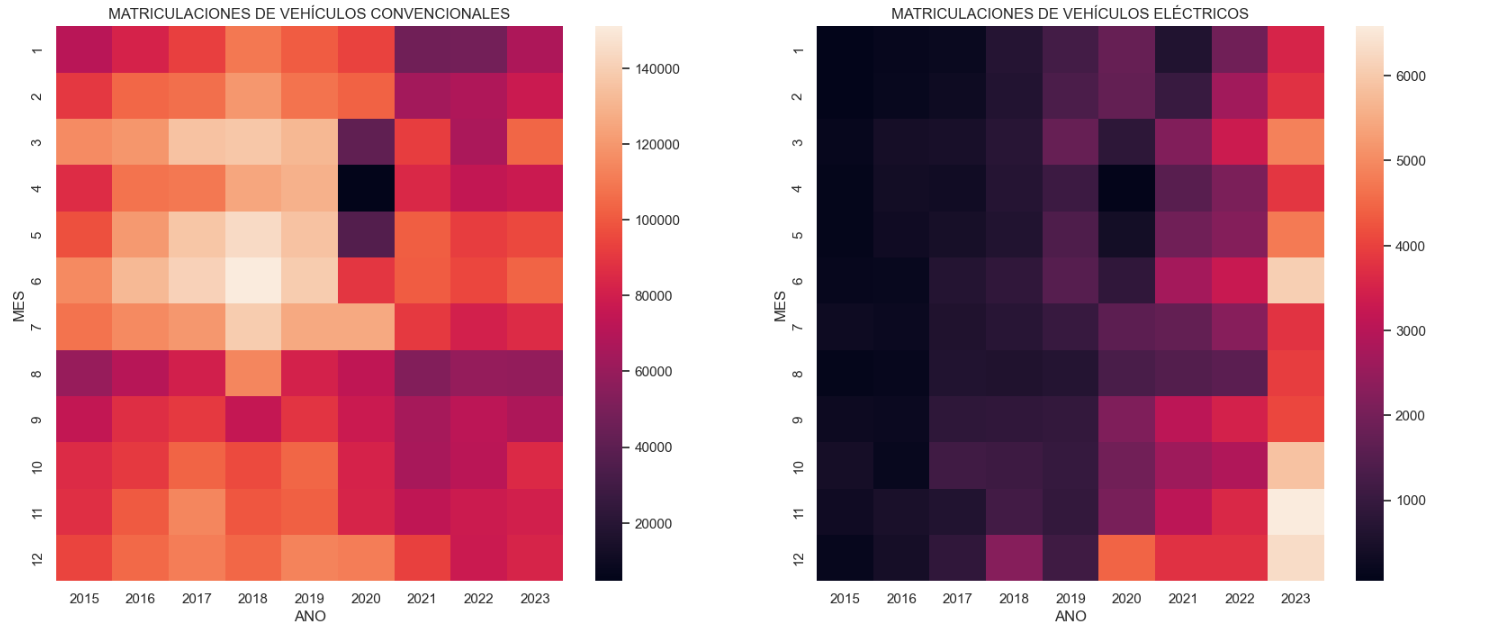
Figure 4. Graph "Trend in registration of conventional vs. electric vehicles".
5.3.2. Predictive analytics
To answer the last question objectively, we will use predictive models that allow us to make estimates regarding the evolution of electric vehicles in Spain. As we can see, the model constructed proposes a continuation of the expected growth in registrations throughout the year of 70,000, reaching values close to 8,000 registrations in the month of December 2024 alone.
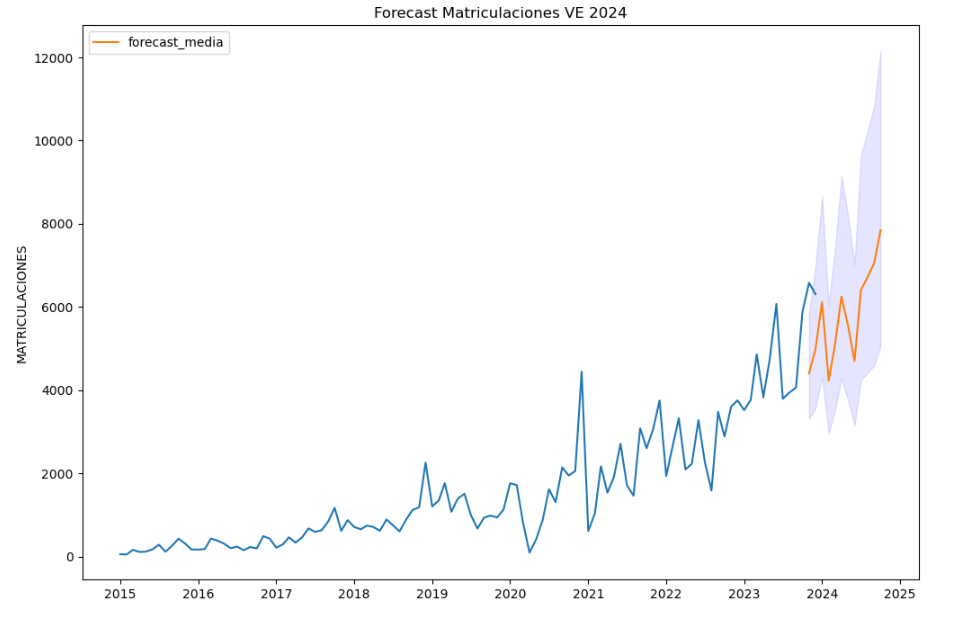
Figure 5. Graph "Predicted electric vehicle registrations".
5. Conclusions
As a conclusion of the exercise, we can observe, thanks to the analysis techniques used, how the electric vehicle is penetrating the Spanish vehicle fleet at an increasing speed, although it is still at a great distance from other alternatives such as diesel or petrol, for now led by the manufacturer Tesla. We will see in the coming years whether the pace grows at the level needed to meet the sustainability targets set and whether Tesla remains the leader despite the strong entry of Asian competitors.
6. Do you want to do the exercise?
If you want to learn more about the Electric Vehicle and test your analytical skills, go to this code repository where you can develop this exercise step by step.
Also, remember that you have at your disposal more exercises in the section "Step by step visualisations" "Step-by-step visualisations" section.
Content elaborated by Juan Benavente, industrial engineer and expert in technologies linked to the data economy. The contents and points of view reflected in this publication are the sole responsibility of the author.
Blog
The year 2023 was undoubtedly the year of artificial intelligence. This has brought data, and therefore open data, back to the forefront, as it is the raw material that fuels this technology, which is key to value creation in our increasingly digital economy.
Perhaps that is why 2023 has also left us a number of new developments in terms of the drive to open data, many of which could lead to the creation of significant economic and social value through re-use. One of these developments is the obligation for public sector bodies to open in the first half of 2024 a number of high-value datasets, already specified in a regulation that was published in the last few days of 2022 in order to implement the provisions of open data directive (2019). Specifically, there are six high-value thematic categories: geospatial, earth observation and environmental, meteorology, statistics, companies and company ownership and mobility.
In order to comply with this obligation and with the rest of the obligations set out in Directive 2019/1024, in 2023, Spain has amended the Law 37/2007 on the re-use of public sector information has been amended in Spain in 2023. This amendment emphasises the duty to encourage the openness of high-value data published under an open data attribution licence (CC BY 4.0 or equivalent), in machine-readable format and accompanied by metadata describing the characteristics of the datasets.
The European Statistical System and the National Statistical Plan 2021-2024
Of the six thematic categories, number four, Statistics, is dedicated to statistical datasets, characterised by their broad definition and specification. It is based on the European Statistical System which ensures that European statistics produced in all Member States are reliable, following common criteria and definitions and treating data in an appropriate way, so that they are always comparable between EU countries. Specifically, the regulation defines 21 statistical datasets as high-value (it actually includes 22, but one of them is redundant as it is broken down into three components: population, fertility and mortality).
The National Statistical Institute] is part of the European Statistical System and is in charge of the production of the harmonised national statistics that Eurostat then compiles and analyses to provide comparable figures, so that Community policies can be defined, implemented and analysed.
In Spain, the National Statistical Plan is the main instrument that organises the statistical activity of the General State Administration, the backbone of statistics for state purposes. The current plan was published at the end of 2020, covering the 2021-2024 period.
The National Statistical Plan 2021-2024 includes new strategic lines such as the use of new sources of information, including, for example, Big Data and massive databases. It also promotes new production models, such as experimental statistics, and incorporates a special focus on the inclusion of gender, disability, age and nationality perspectives, as well as improvements in real estate market information, especially on rentals.
High-value statistical datasets
In these strategic lines, the plan does not yet contain any mention of high-value datasets. However, as the plan is developed and implemented through specific annual programmes detailing the statistical operations to be carried out, their objectives, the bodies involved, and the budget appropriations statistical operations to be carried out, their objectives, the bodies involved and the budget appropriations needed to finance them, it is possible to get an idea of which of these statistical operations are aligned with the 21 categories of high value Ssatistical datasets regulation.
The following table shows the possible equivalences:
| High-value statistical datasets | Equivalence in the Inventory of Statistical Operations (IOE) |
|---|---|
| Industrial production | IOE 30050 data sheet, Industrial Production Indices |
| Industrial producer price index breakdowns by activity | IOE 30051 data sheet , Industrial Price Indices |
| Volume of sales by activity | Partially covered by IOE 32092 data sheet Statistics on Sales, Employment and Wages in Large enterprises and SMEs and 32096 data sheet, Daily Domestic Sales. |
| EU International trade in goods statistics | There does not seem to be a clear correspondence in the plan, as the planned statistical operations on international trade are focused on services, while trade in goods is worked out in terms of trade between EU Member States. However, part of the specified data could be found in the IOE 30029 data sheet, Annual National Accounts of Spain: Main Aggregates, although perhaps at a higher level of aggregation than required. |
| Tourism flows in Europe | Many similarities with what is defined in the IOE 16028 data sheet, Statistics on Tourist Movements at Borders (FRONTUR) and 16023, Residents' Tourism Survey (ETR/FAMILITUR). |
| Harmonised Indices of consumer prices | IOE 30180 data sheet, Harmonised Index of Consumer Prices (HICP). |
| National Accounts - key indicators on GDP | IOE 30029 data sheet, Annual National Accounts of Spain: Main Aggregates. |
| National accounts - key indicators on corporations | |
| National accounts- key indicators on households | |
| Government expenditure and revenue | It is reflected in the three IOE data sheets on the settlement of budgets of the different levels of public administration: 31125 data sheet, Budget Settlement Statistics of the State and its Public Bodies, Companies and Foundations; 31030 datasheet Budgets Settlement of the Autonomous Communities (MHAC); and 31026 Budgets Settlement of Local Entities (MHAC). |
| Consolidated government gross debt | |
| Environmental accounts and statistics | It is reflected in the eight data sheet (from 30084 to 30095) of the inventory of statistical operations regarding Environmental Accounts. View listing here. |
| Population | IOE 30264 data sheet, Basic Demographic Indicators. |
| Fertility | |
| Mortality | IOE 30271 data sheet, Mortality Tables. |
| Current healthcare expenditure | IOE 54012 data sheet, Satellite Accounts of Public Health Expenditure |
| Poverty | IOE 30453 data sheet, Living Conditions Survey (LCS). |
| Inequality | |
| Employment | There are quite a few statistical operations that study the labor market, of which the IOE 0308 Labor Force Survey stands out. |
| Unemployment | |
| Potential labour force | IOE 30308 data sheet, Labor force Survey, which also contains worksheet 30309 data sheet, Community Labour Force Survey (CLFS). |
En definitiva, parece que la mayor parte de las variables clave que el reglamento europeo ha previsto para los conjuntos estadísticos de alto valor están ya produciéndose de acuerdo con el plan estadístico nacional vigente. El plan estadístico nacional, que sucederá al actualmente vigente, comenzará en 2025 y a buen seguro se publicará a lo largo de este 2024. Este año veremos en Europa un intenso trabajo para cumplir con las obligaciones del reglamento, ya que, además, la Comisión Europea ha publicado recientemente el informe "Identification of data themes for the extensions of public sector High-Value Datasets" donde se incluyen siete nuevas categorías que se estudia considerar como datos de alto valor y que previsiblemente acabarán siendo incluidas en el reglamento.
All in all, it seems that most of the key variables that the European regulation has foreseen for high value statistical datasets are already being produced according to the existing national statistical plan. The national statistical plan, which will succeed the current one, will start in 2025 and will most likely be published in the course of 2024. This year will see intense work in Europe to comply with the obligations of the regulation, as the European Commission has also recently published the report "Identification of data themes for the extensions of public sector High-Value Datasets" which includes seven new categories that are being considered as high-value datasets and are expected to be included in the regulation and which will foreseeably end up being included in the regulation.
Content prepared by Jose Luis Marín, Senior Consultant in Data, Strategy, Innovation & Digitalization. The contents and views reflected in this publication are the sole responsibility of the author.
Blog
Open data provides relevant information on the state and evolution of different sectors, including employment. Employment data typically includes labour force statistics and information on employees, as well as economic, demographic or benefits-related data, interviews, salaries, vacancies, etc.
This information can provide a clear picture of a country's economic health and the well-being of its citizens, encouraging informed decision-making. In addition, they can also serve as a basis for the creation of innovative solutions to assist in a variety of tasks.
In this article we will review some sources of open data on job quality, as well as examples of use to show the potential benefits of re-use.
Where to find employment data?
In datos.gob.es a large number of data sets on employment are available, with the National Statistics Institute (INE) standing out as the national publisher. Thanks to the INE data, we can find out who is employed by sector of activity, type of studies or working day, as well as the reasons for having a part-time job. The data provided by this entity also allows us to know the employment situation of people with disabilities or by sex.
Other sources of data where you can find information of interest is the State Public Employment Service (sepe.es), where you can find statistical data on job seekers, jobs and placements, from May 2005 to the present day. To this must be added the regional bodies, many of which have launched their own open employment data portal. This is the case of the Junta de Andalucía.
If we are interested in making a comparison between countries, we can also turn to data from the OECD, Eurostat or the World Bank.
All these data can be of great interest to:
- Policy makers, to better understand and react to labour market dynamics.
- Employers, to optimise their recruitment activities.
- Job seekers, to make better career choices.
- Education and training institutions, to adapt curricula to the needs of the labour market.
Use cases of open data in the employment sector
It is just as important to have sources of open employment data as it is to know how to interpret the information they offer about the sector. This is where reusers come in, taking advantage of this raw material to create data products that can respond to different needs. Let's look at some examples:
- Decision-making and implementation of active policies. Active labour market policies are tools that governments use to intervene directly in the labour market, through training, guidance, incentives to hiring, etc. To do so, they need to be aware of market trends and needs. This has led many public bodies to set up observatories, such as the SEPE or the Principality of Asturias. There are also specific observatories for each area, such as the one for Equality and Employment. At the European level, Eurostat's proposal stands out: to establish requirements to create a pan-European system for the production of official statistics and specific policy analyses using open data on online job vacancies. This project has been carried out using the BDTI platform. But this field is not limited to the public sector; other actors can also submit proposals. This is the case of Iseak, a non-profit organisation that promotes a research and transfer centre in economics. Among other questions, Iseak seeks to answer questions such as: does the increase in the minimum wage lead to job destruction or why is there a gender gap in the market?
- Accountability. All this information is not only useful for public bodies, but also for citizens to assess whether their government's employment policies are working. For this reason, many governments, such as Castilla y León, make this data available to citizens through easy-to-understand visualisations. Data journalism also plays a leading role in this field, with pieces that bring information closer to the general public, such as these examples of salaries or the level of unemployment by area. If you want to know how to make this type of visualisations, we explain them in this step-by-step exercise that characterises the demand for employment and hiring registered in Spain.
- Boosting job opportunities. In order to bring information of interest to citizens who are actively seeking employment or new job opportunities, there are tools, such as this app for public employment calls or grants, based on open data. There are also town councils that create solutions to boost employment and the economy in their locality, such as the APP Paterna Empléate. These apps are a much simpler and more user-friendly way of consuming data than traditional job search portals. Barcelona Provincial Council has gone a step further. This tool uses AI applied to open data to, among other purposes, offer personalised services for individuals, companies and rural sectors, as well as access to job offers. The information it offers comes from notice boards, as well as from the Profile of the contracting party and various municipal websites.
- Development of advanced solutions. Employment data can also be used to power a wide variety of machine learning use cases. One example is this US platform for financial analytics that provides data and information to investors and companies. It uses US unemployment rate data, combined with other data such as postcodes, demographics or weather data.
In short, thanks to this type of data we can not only learn more about the employment situation in our environment, but also feed solutions that help boost the economy or facilitate access to job opportunities. It is therefore a category of data whose publication should be promoted by public bodies at all levels.
Noticia
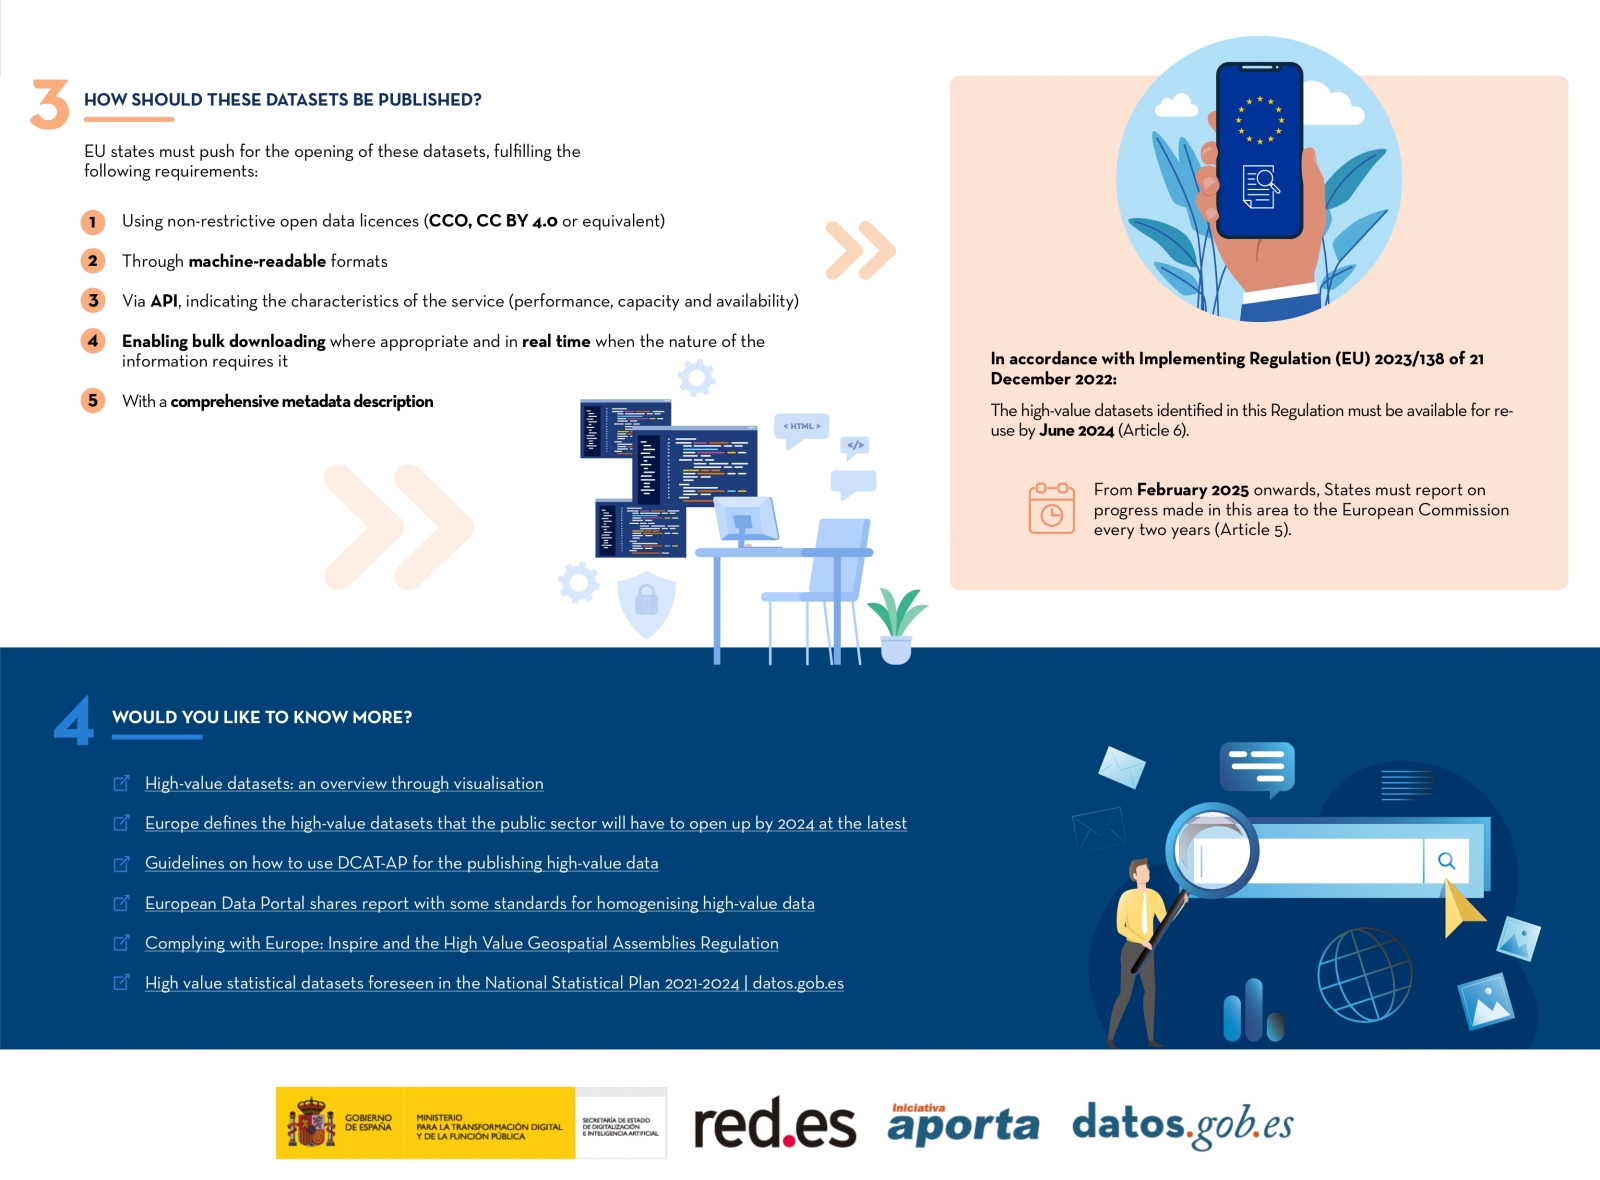
The concept of High-Value data (High-Value datasets) was introduced by the European Parliament and the Council of the European Union 4 years ago, in Directive (EU) 2019/1024. In it, they were defined as a series of datasets with a high potential to generate "benefits for society, the environment and the economy". Therefore, member states were to push for their openness for free, in machine-readable formats, via APIs, in the form of bulk download and comprehensively described by metadata.
Initially, the directive proposed in its annex six thematic categories to be considered as high value: geospatial, earth observation and environmental, meteorological, statistical, business records and transport network data. These categories were subsequently detailed in an implementing regulation published in December 2022. In addition, to facilitate their openness, a document with guidelines on how to use DCAT-AP for publication was published in June 2023.
New categories of data to be considered of high value
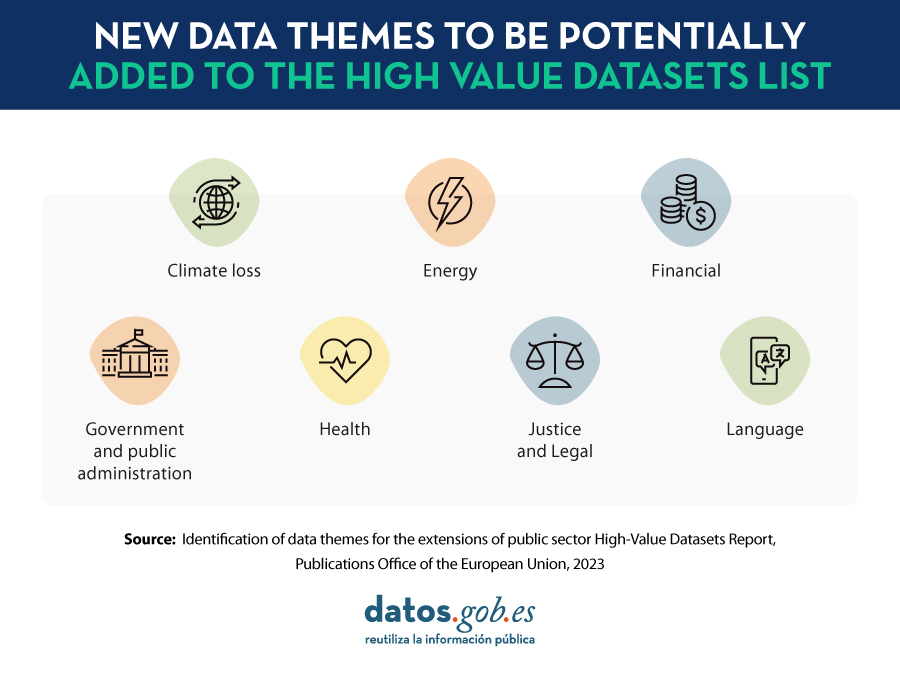
These initial categories were always open to extension. In this sense, the European Commission has just published the report "Identification of data themes for the extensions of public sector High-Value Datasets" which includes seven new categories to be considered as high-value data
-
Climate loss: This refers to data related to approaches and actions needed to avoid, minimize and address damages associated with climate change. Examples of datasets in this category are economic and non-economic losses from extreme weather events or slow-onset changes such as sea level rise or desertification. It also includes data related to early warning systems for natural disasters, the impact of mitigation measures, or research data on the attribution of extreme events to climate change.
-
Energy: This category includes comprehensive statistics on the production, transport, trade and final consumption of primary and secondary energy sources, both renewable and non-renewable. Examples of data sets to consider are price and consumption indicators or information on energy security.
-
Finance: This is information on the situation of private companies and public administrations, which can be used to assess business performance or economic sustainability, as well as to define spending and investment strategies. It includes datasets on company registers, financial statements, mergers and acquisitions, as well as annual financial reports.
-
Government and public administration: This theme includes data that public services and companies collect to inform and improve the governance and administration of a specific territorial unit, be it a state, a region or a municipality. It includes data relating to government (e.g. minutes of meetings), citizens (census or registration in public services) and government infrastructures. These data are then reused to inform policy development, deliver public services, optimize resources and budget allocation, and provide actionable and transparent information to citizens and businesses.
-
Health: This concept identifies data sets covering the physical and mental well-being of the population, referring to both objective and subjective aspects of people's health. It also includes key indicators on the functioning of health care systems and occupational safety. Examples include data relating to Covid-19, health equity or the list of services provided by health centers.
-
Justice and legal affairs: Identifies datasets to strengthen the responsiveness, accountability and interoperability of EU justice systems, covering areas such as the application of justice, the legal system or public security, i.e. that which ensures the protection of citizens. The data sets on justice and legal matters include documentation of national or international jurisprudence, decisions of courts and prosecutors general, as well as legal acts and their content.
-
Linguistic data: Refers to written or spoken expressions that are at the basis of artificial intelligence, natural language processing and the development of related services. The Commission provides a fairly broad definition of this category of data, all of which are grouped under the term "multimodal linguistic data". They may include repositories of text collections, corpora of spoken languages, audio resources, or video recordings.
To make this selection, the authors of the report conducted desk research as well as consultations with public administrations, data experts and private companies through a series of workshops and surveys. In addition to this assessment, the study team mapped and analyzed the regulatory ecosystem around each category, as well as policy initiatives related to their harmonization and sharing, especially in relation to the creation of European Common Data Spaces.
Potential for SMEs and digital platforms
In addition to defining these categories, the study also provides a high-level estimate of the impact of the new categories on small and medium-sized companies, as well as on large digital platforms. One of the conclusions of the study is that the cost-benefit ratio of data openness is similar across all new topics, with those relating to the categories "Finance" and "Government and public administration" standing out in particular.
Based on the publicly available datasets, an estimate was also made of the current degree of maturity of the data belonging to the new categories, according to their territorial coverage and their degree of openness (taking into account whether they were open in machine-readable formats, with adequate metadata, etc.). To maximize the overall cost-benefit ratio, the study suggests selecting a different approach for each thematic category: based on their level of maturity, it is recommended to indicate a higher or lower number of mandatory criteria for publication, thus ensuring to avoid overlaps between new topics and existing high-value data.
You can read the full study at this link.
Blog
Trust, as a key factor in unlocking the potential of data in the digital economy, is an increasingly central element in all data regulations. The European General Data Protection Regulation, in 2016 already recognised that if individuals have more control over their own personal data, this will improve trust and contribute to the positive impact on the development of the digital economy. The European Commission's European Data Law 2022 European Commission proposal puts even greater emphasis on the targets themselves, stating that "low trust prevents the full potential of data-driven innovation from being realised".
Among the findings of the World Data Regulation Survey published by the World Bank in 2021, highlights the need to strengthen regulatory frameworks around the world to build greater citizen trust. This would contribute to more effective effectiveness of government initiatives that use data and that aim, in many cases, to generate value forsociety. As an example, he cites the limited impact of contact-tracking applications around the world during the COVID-19 pandemic, largely due to a lack of public confidence in the potential use of the data provided.
If we really believe that trust in data is so critical to creating value for society and the economy, we need to pay close attention both to the mechanisms we have at our disposal to enhance that trustworthiness, and to the strategies for building and maintaining that trust, beyond the regulatory frameworks themselves.
Quality and transparency
Trust in data starts with quality and transparency. When users understand how data are collected, processed and maintained, they are more likely to trust them to use them use it, and even be more willing to contribute their own data.
A fundamental mechanism for ensuring quality and transparency is the implementation of rigorous standards, such as the UNE specifications for Data Governance UNE 0077:2023, Data Management UNE 0078:2023, and Data Quality Management UNE 0079:2023 at each stage of the data lifecycle. On the one hand, quality is enhanced through the deployment of robust validation and verification practices that ensure the accuracy and integrity of the data, and on the other hand, transparency is improved through, for example, descriptive metadata that provide detailed information about the data, including its origin, collection methodology and any transformation it has undergone.
European Data Spaces
The European Data Spaces is an ambitious EU initiative aimed at building trust and facilitating the exchange and use of data between countries and sectors in a secure and regulated environment. The central idea behind the European Data Spaces is to create environments in which the availability, accessibility and interoperability of data are maximised, while the risks associated with data handling are minimised. Initially the European data strategy initially envisaged 10 data spaces in strategic areas such as health, energy or public administration. Since then this number has grown and other data spaces have been launched in important areas such as media and cultural heritage, or in strategic sectors for Spain such as tourism.
In order to bet on the leadership in data spaces in strategic sectors for Spain, the government is promoting the Gaia-X Spanish Hub the Spanish government is promoting a new initiative, comprised of companies of all sizes, aimed at deploying a solid ecosystem in the field of industrial data sharing
Improving cyber security
The increasing number of cyber security incidents media headlines, some of which have even brought private companies and public bodies to a standstill, has made cyber security a primary concern for users and organisations in the digital age.
Robust cyber security involves organisations deploying advanced technologies and best practices to protect systems and data from unauthorised access and malicious manipulation through measures such as firewalls, two-factor authentication, and real-time threat monitoring and detection, encryption two-factor authentication, and real-time threat monitoring and detection. However, improving users' education and cybersecurity awareness is also vital to help them recognise and avoid potential threats.
European digital identity
The European Digital Identity is being developed in the framework of the European Union with the aim of providing citizens and businesses with a secure and unified way of accessing services, public and private, online and offline, across the EU. The idea is that, with a European digital identity, people would be able to identify themselves or confirm data in services such as banking, education or health, among others, in a secure and frictionless way, providing a high level of security and privacy protection.
This deepens the framework of trust and confidence created by the EIDAS Regulation on electronic identification and trust services for electronic transactions in the internal market, which already contributes significantly to increasing consumer confidence phishing or improving confidence in the origin of documents.
Building a culture of trust and responsibility in the handling of data and digital infrastructures is the focus of the actions of EU governments, including Spain. In this context, the intersection between data quality and transparency, robust cybersecurity that reduces cybercrime, European Data Spaces, and European digital identity stand out as key mechanisms to cultivate this trust and propose a route towards greater innovation that ultimately generates social and economic value through data.
Contenido elaborado por Jose Luis Marín, Senior Consultant in Data, Strategy, Innovation & Digitalization. Los contenidos y los puntos de vista reflejados en esta publicación son responsabilidad exclusiva de su autor.
Noticia
The Asociación Multisectorial de la Información (ASEDIE) has published the eleventh edition of its Report on the Infomediary Sector, in which it reviews the health of companies that generate applications, products and/or services based on information from the public sector, taking into account that it is the holder of the most valuable data.
Many of the datasets that enable the infomediary sector to develop solutions are included in the lists of High Value Datasets (HVDS) recently published by the European Union. An initiative that recognises the potential of public information and adds to the aim of boosting the data economy in line with the European Parliament's proposed Data Law.
ASEDIE brings together companies from different sectors that promote the data economy, which are mainly nourished by the data provided by the public sector. Among its objectives is to promote the sector and contribute to raising society's awareness of its benefits and impact. It is estimated that the data economy will generate €270 billion of additional GDP for EU Member States by 2028.
The presentation of this edition of the report, entitled 'The Data Economy in the infomediary field', took place on 22 March in Red.es's Enredadera room. In this year's edition of the report, 710 active companies have been identified, with a turnover of more than 2,278 million euros. It should be noted that the first report in 2013 counted 444 companies. Therefore, the sector has grown by 60% in a decade.
Main conclusions of the report
- The infomediary sector has grown by 12.1%, a figure above the national GDP growth of 7.6%. These data are drawn from the analysis of the 472 companies (66% of the sample) that submitted their accounts for the previous years.
- The number of employees is 22,663. Workers are highly concentrated in a few companies: 62% of them have less than 10 workers. The subsector with the highest number of professionals is Geographic information, with 30% of the total. Together with the sub-sectors Financial economics, Technical consultancy and Market research, they account for 75% of the employees.
- Employment in the companies of the Infomediary Sector grew by 1.7%, compared to a fall of 1.1% in the previous year. All sub-sectors have grown, except for Tourism and Culture, which have remained the same, and Technical Consultancy and Market Research, which have decreased.
- The average turnover per employee exceeded 100,000 euros, an increase of 6.6% compared to the previous year. On the other hand, the average expenditure per employee was 45,000 euros.
- The aggregate turnover was 2,279,613,288 euros. The Geographical Information and Economic and Financial subsectors account for 46% of sales.
- The aggregate subscribed capital is 250,115,989 euros. The three most capitalised subsectors are Market Research, Economic and Financial and Geographic Information, which account for 66% of capitalisation.
- The net result exceeds 180 million euros, 70 million more than last year. The Economic and Financial subsector accounted for 66% of total profits.
- The sub-sectors of Geographical Information, Market Research, Financial Economics and Computer Infomediaries account for 76% of the infomediary companies, with a total of 540 companies out of the 710 active companies.
- The Community of Madrid is home to the largest number of companies in the sector, with 39%, followed by Catalonia (13%), Andalusia (11%) and the Community of Valencia (9%).
As the report shows, the arrival of new companies is driving the development of a sector that already has a turnover of around 2,300 million euros per year, and which is growing at a higher rate than other macroeconomic indicators in the country. These data show not only that the Infomediary Sector is in good health, but also its resilience and growth potential.
Progress of the Study on the impact of open data in Spain
The report also includes the results of a survey of the different actors that make up the data ecosystem, in collaboration with the Faculty of Information Sciences of the Complutense University of Madrid. This survey is presented as the first exercise of a more ambitious study that aims to know the impact of open data in Spain and to identify the main barriers to its access and availability. To this end, a questionnaire has been sent to members of the public, private and academic sectors. Among the main conclusions of this first survey, we can highlight the following:
- As main barriers to publishing information, 65% of respondents from the public sector mentioned lack of human resources, 39% lack of political leadership and 38% poor data quality.
- The biggest obstacle in accessing public data for re-use is for public sector respondents that the information provided in the data is not homogeneous (41.9%). Respondents from the academic sector point to the lack of quality of the data (43%) and from the private sector it is believed that the main barrier is the lack of updating (49%).
- In terms of the frequency of use of public data, 63% of respondents say that they use the data every day or at least once a week.
- 61% of respondents use the data published on the datos.gob.es portal.
- Respondents overwhelmingly believe that the impact of data openness on the private sector is positive. Thus, 77% of private sector respondents indicate that accessing public data is economically viable and 89% of them say that public data enables them to develop useful solutions.
- 95% of respondents call for a compendium of regulations affecting the access, publication and re-use of public sector data.
- 27% of public sector respondents say they are not aware of the six categories of high-value data set out in Commission Implementing Regulation (EU) 20137138 .
This shows that most respondents are aware of the potential of the sector and the impact of public sector data, although they indicate that some obstacles to re-use need to be overcome and believe that a compendium of the different existing regulations would facilitate their implementation and help the development of the sector.
Top 3 ASEDIE
As in previous editions, the report includes the status of the Top 3 ASEDIE, an initiative that aims for all Autonomous Communities to fully open three sets of data, following unified criteria that facilitate their reuse, and which is included in the IV Open Government Plan. In 2019, the opening of the Cooperatives, Associations and Foundations databases was proposed, and there are currently 16 Autonomous Communities in which they can be accessed in full. Moreover, in eight of them, it is possible to access the NIF with a unique identifier, which improves transparency and makes the information more accurate.
Taking into account the good results of the first proposal, in 2020 a new request for opening data was launched, the Second Top 3 ASEDIE, in this case of Energy Efficiency Certificates, SAT Registries (Agricultural Transformation Companies) and Industrial Estates, whose evolution has also been very positive. The following map shows the opening situation of these three new databases in 2023.
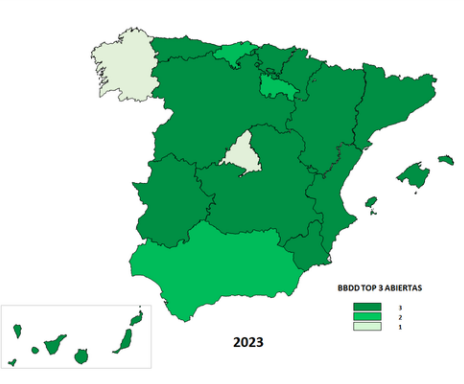
The Top 3 ASEDIE initiative has been a success and has become a reference in the sector, promoting the opening of databases in a joint manner and demonstrating that it is possible to harmonise public data sources to put them at the service of society.
The next steps in this sense will be to monitor the databases already open and to disseminate them at all levels, including the identification of good practices of the Administration and the selection of examples to encourage public-private collaboration in open data. In addition, a new top 3 will be identified to advance in the opening of new databases, and a new initiative will be launched to reach the bodies of the General State Administration, with the identification of a new Top 3 AGE.
Success stories
The report also includes a series of success stories of products and services developed with public sector data, such as Iberinform's API Market, which facilitates access to and integration of 52 sets of company and self-employed data in company management systems. Another successful case is Geocode, a solution focused on standardisation, validation, correction, codification and geolocation processes for postal addresses in Spain and Portugal.
Geomarketing makes it possible to increase the speed of calculating geospatial data and Infoempresa.com has improved its activity reports on Spanish companies, making them more visual, complete and intuitive. Finally, Pyramid Data makes it possible to access the Energy Efficiency Certificates (EEC) of a given property portfolio.
As examples of good practices in the public sector, the ASEDIE report highlights the open statistical data as a driver of the Data Economy of the Canary Islands Statistics Institute (ISTAC) and the technology for the opening of data of the Open Data Portal of the Andalusian Regional Government (Junta de Andalucía).
As a novelty, the category of examples of good practices in the academic sector has been incorporated, which recognises the work carried out by the Geospatial Code and the Report on the state of open data in Spain III, by the Rey Juan Carlos University and FIWARE Foundation.
The 11th ASEDIE Report on the Data Economy in the infomediary field can be downloaded from the ASEDIE website in Spanish. The presentations of the economic indicators and the Top 3 and the Data Ecosystem are also available.
In summary, the report shows the good health of the industry that confirms its recovery after the pandemic, its resilience and growth potential and, in addition, the good results of public-private collaboration and its impact on the data economy are observed.
Noticia
Updated: 21/03/2024
On January 2023, the European Commission published a list of high-value datasets that public sector bodies must make available to the public within a maximum of 16 months. The main objective of establishing the list of high-value datasets was to ensure that public data with the highest socio-economic potential are made available for re-use with minimal legal and technical restriction, and at no cost. Among these public sector datasets, some, such as meteorological or air quality data, are particularly interesting for developers and creators of services such as apps or websites, which bring added value and important benefits for society, the environment or the economy.
The publication of the Regulation has been accompanied by frequently asked questions to help public bodies understand the benefit of HVDS (High Value Datasets) for society and the economy, as well as to explain some aspects of the obligatory nature of HVDS (High Value Datasets) and the support for publication.
In line with this proposal, Executive Vice-President for a Digitally Ready Europe, Margrethe Vestager, stated the following in the press release issued by the European Commission:
"Making high-value datasets available to the public will benefit both the economy and society, for example by helping to combat climate change, reducing urban air pollution and improving transport infrastructure. This is a practical step towards the success of the Digital Decade and building a more prosperous digital future".
In parallel, Internal Market Commissioner Thierry Breton also added the following words on the announcement of the list of high-value data: "Data is a cornerstone of our industrial competitiveness in the EU. With the new list of high-value datasets we are unlocking a wealth of public data for the benefit of all”. Start-ups and SMEs will be able to use this to develop new innovative products and solutions to improve the lives of citizens in the EU and around the world.
Six categories to bring together new high-value datasets
The regulation is thus created under the umbrella of the European Open Data Directive, which defines six categories to differentiate the new high-value datasets requested:
- Geospatial
- Earth observation and environmental
- Meteorological
- Statistical
- Business
- Mobility
However, as stated in the European Commission's press release, this thematic range could be extended at a later stage depending on technological and market developments. Thus, the datasets will be available in machine-readable format, via an application programming interface (API) and, if relevant, also with a bulk download option.
In addition, the reuse of datasets such as mobility or building geolocation data can expand the business opportunities available for sectors such as logistics or transport. In parallel, weather observation, radar, air quality or soil pollution data can also support research and digital innovation, as well as policy making in the fight against climate change.
Ultimately, greater availability of data, especially high-value data, has the potential to boost entrepreneurship as these datasets can be an important resource for SMEs to develop new digital products and services, which in turn can also attract new investors.
Find out more in this infographic: