A practical introductory guide to exploratory data analysis


Fecha del documento: 22-09-2021

Before performing data analysis, for statistical or predictive purposes, for example through machine learning techniques, it is necessary to understand the raw material with which we are going to work. It is necessary to understand and evaluate the quality of the data in order to, among other aspects, detect and treat atypical or incorrect data, avoiding possible errors that could have an impact on the results of the analysis.
One way to carry out this pre-processing is through exploratory data analysis (EDA).
What is exploratory data analysis?
EDA consists of applying a set of statistical techniques aimed at exploring, describing and summarising the nature of the data, in such a way that we can guarantee its objectivity and interoperability.
This allows us to identify possible errors, reveal the presence of outliers, check the relationship between variables (correlations) and their possible redundancy, and perform a descriptive analysis of the data by means of graphical representations and summaries of the most significant aspects.
On many occasions, this exploration of the data is neglected and is not carried out correctly. For this reason, at datos.gob.es we have prepared an introductory guide that includes a series of minimum tasks to carry out a correct exploratory data analysis, a prior and necessary step before carrying out any type of statistical or predictive analysis linked to machine learning techniques.
What does the guide include?
The guide explains in a simple way the steps to be taken to ensure consistent and accurate data. It is based on the exploratory data analysis described in the freely available book R for Data Science by Wickman and Grolemund (2017). These steps are:
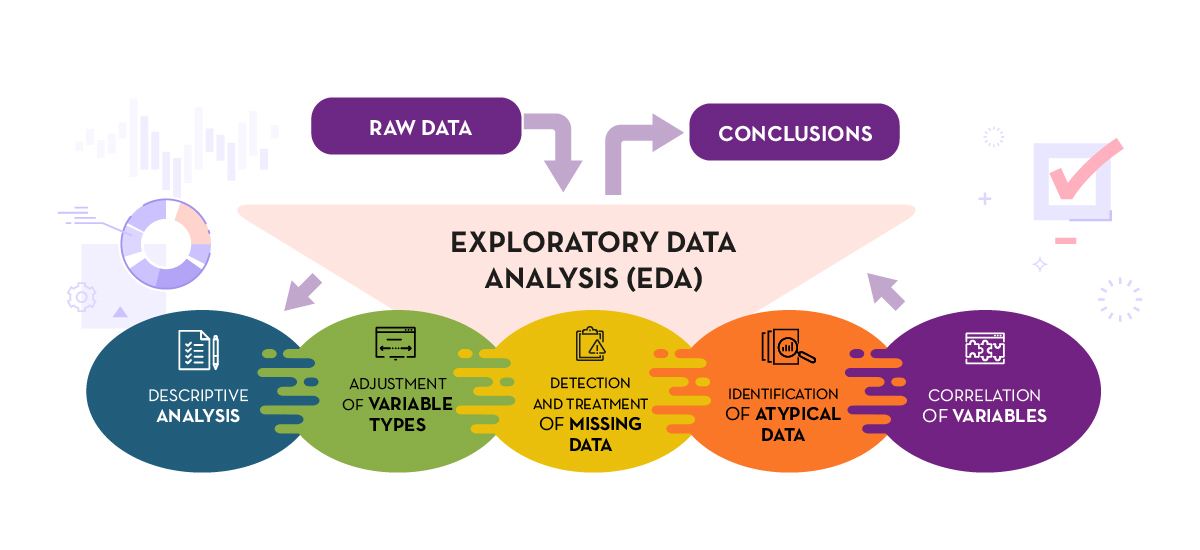
Figure 1. Phases of exploratory data analysis. Source: own elaboration.
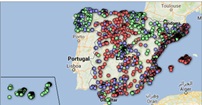
The guide explains each of these steps and why they are necessary. They are also illustrated in a practical way through an example. For this case study, we have used the dataset relating to the air quality register in the Autonomous Community of Castilla y León included in our open data catalogue. The processing has been carried out with Open Source and free technological tools. The guide includes the code so that users can replicate it in a self-taught way following the indicated steps.
The guide ends with a section of additional resources for those who want to further explore the subject.
Who is the target audience?
The target audience of the guide is users who reuse open data. In other words, developers, entrepreneurs or even data journalists who want to extract as much value as possible from the information they work with in order to obtain reliable results.
It is advisable that the user has a basic knowledge of the R programming language, chosen to illustrate the examples. However, the bibliography section includes resources for acquiring greater skills in this field.
Below, in the documentation section, you can download the guide, as well as an infographic-summary that illustrates the main steps of exploratory data analysis. The source code of the practical example is also available in our Github.
Click to see the full infographic, in accessible version
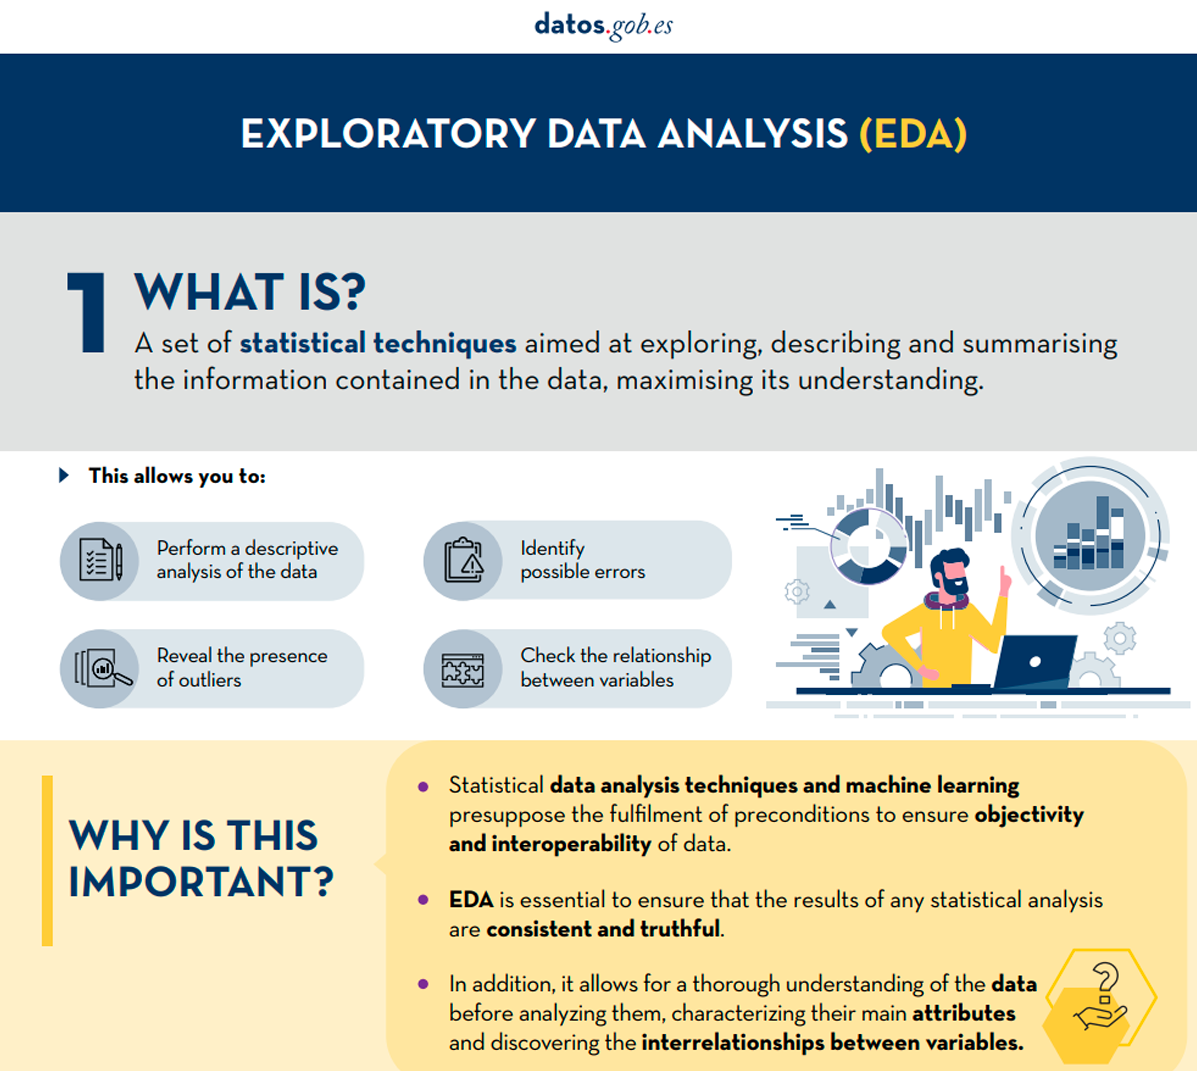
Figure 2. Capture of the infographic. Source: own elaboration.
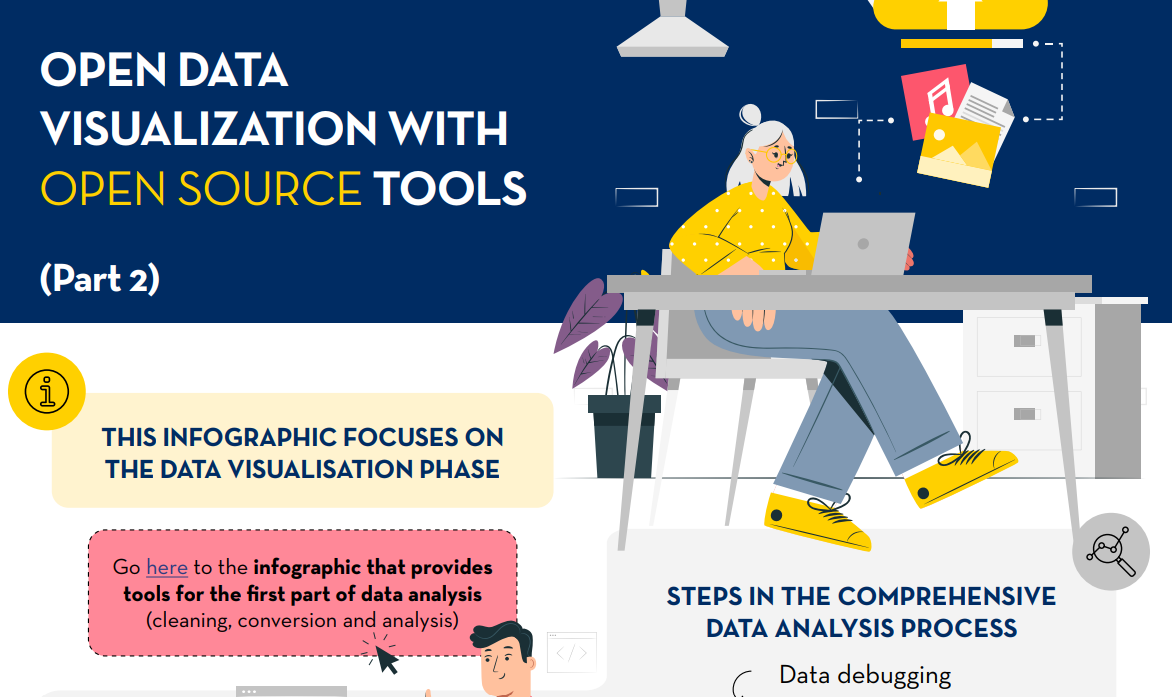
Open data visualization with open source tools (infographic part 2)