Economy
Economic data is similarly vital within sectors such as finance and banking, facilitating risk management, enhancing competitiveness, driving innovation, strengthening confidence in markets, and improving decision-making for financial institutions, citizens, and businesses alike.


Discover the most notable datasets
Imagen Media

P.I.B. a precios de mercado y valor añadido bruto a precios básicos por ramas de actividad: Variaciones de volumen: por comunidades y ciudades autónomas, magnitud y periodo
Descripción
Tabla de INEbase
Imagen Media

Precios Medios en el mercado de bienes urbanos 2024 de uso Comercial
Descripción
Precios medios de mercado de bienes urbanos 2024 de uso Comercial en virtud a lo establecido en la Orden de 22 de diciembre de 2023, de la Consejer
Imagen Media

Índices nacionales: general y por sectores. ICNE
Descripción
Tabla de INEbase
Índices nacionales: general y por sectores. Mensual. Índice de Cifra de Negocios Empresarial
Imagen Media

Deuda pública de la C. A. de Euskadi y de los países de la Unión Europea (% del PIB).
Descripción
El objetivo de esta operación es ofrecer una perspectiva de la situación de la C. A.
Imagen Media

Presupuestos. Presupuesto General 2026
Descripción
Este conjunto de datos ofrece información sobre el proyecto del Presupuesto General del Ayuntamiento de Madrid del ejercicio 2025, el cual fue apro
Imagen Media
Mostrar más…
Descripción
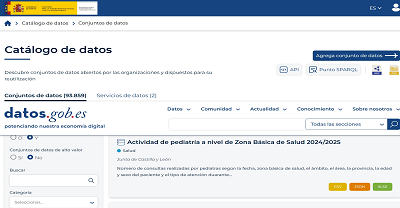
Búsqueda en el catálogo de datos.gob.es por la categoría Economía
Featured current topics

Current news
The 14th edition of the ASEDIE Infomediary Sector Report is now available
The Multisectoral Information Association (ASEDIE) has published the fourteenth edition of the report on the data economy in the infomediary field, consolidating a historical series that offers a broad perspective on the evolution of the sector. Analysis over the years reveals that the infomediary sector has grown by 79% since 2013, with 796 companies identified compared to the initial 444. The report was presented on 21 April in Madrid at an event highlighting the crucial role played by the infomediary sector in the Spanish economy.
Below, we collect the main keys of the report.
A turnover of 2,870 million euros and employment that grows above the national average
Since 2013, the report has been analysing the situation of the infomediary sector, made up of companies and organisations that reuse data from mostly public bodies, complementing it with private sources, to generate value-added products or services. The latest edition underlines that the sector is booming, consolidating itself as a structural component of the data ecosystem in Spain with sustained growth.
The study analyses 796 active companies as of 31 December 2024, of which 623 have financial data available. For the study, the data for the year 2024 have been taken since at the time of the report those relating to the year 2025 were not yet available. The results of the study set the following values for the main indicators of the sector:
Aggregate turnover reached 2,870 million euros, with a growth of 5.8% year-on-year. The geographic information subsector is consolidated as the main one, exceeding 795 million euros and concentrating 28.4% of total sales. The culture subsector also stands out, doubling its turnover (+120.5%). On the other hand, directorial and market studies registered decreases of 9.8% and 3.9% respectively.
The sector generates 26,538 jobs, with a growth of 7.6% compared to the previous year, almost five points above the national average. The average employment in the sector also increased compared to the previous period and stands at around 40 employees per company, which reaffirms its ability to generate stable jobs. The boost from the geographic information subsector generated more than 1,000 new jobs in a single year (+12.2%), now accounting for almost 40% of total employment. The average turnover per employee stood at 108,164 euros.
The subscribed capital amounts to 252 million euros, and the aggregate net profit exceeds 158 million euros, 13 million more than the previous year. The economic and financial, geographic information and infomediation subsectors account for 80% of the profit. 75% of companies ended the year with a profit.
75% of the companies carry out their activity in four subsectors of the total ten: geographic information, market, economic and financial research and computer intermediation.
The business structure of the sector is still dominated by small companies: more than half are mycropymes with less than five employees and around 70% do not reach one million euros in annual turnover. Only 3% exceed 25 million euros in revenue.
From the point of view of geographical distribution, Madrid concentrates 38% of companies, followed by Catalonia (15%), Andalusia (11%) and the Valencian Community (8%). The sector is present in all the autonomous communities and in the Autonomous City of Melilla, which accounts for its global implementation.
The temporary analysis shows that the volume of companies has grown by 79% since 2013. In the last decade, 249 companies have been created. In absolute terms, the autonomous communities that have registered the highest growth in companies are Madrid (111), Andalusia (66) and the Valencian Community (58). In relative terms, the ones where the number of companies has increased the most are Cantabria (600%), Murcia (350%) and Extremadura (350%).
2024, the last year analysed, registers a slight decrease in the average sales figure, after more than a decade of sustained growth. This adjustment does not modify the consolidation trend and is associated with a stage of greater maturity of the sector after years of sustained growth.
The following visual summarizes some of these data:
Figure 1. Source: Report of the Infomediary Sector of ASEDIE. "Data Economics in its Infomediary Field" (2026).
Significant advances in the ASEDIE Top 10
ASEDIE's Top 10, launched in 2019 with the support of the 17 autonomous communities, aims to promote public-private collaboration and focus resources on opening up high-value datasets. Seven years later, the balance is positive, as six of the ten datasets – associations, foundations, industrial estates, health centres, educational centres and energy efficiency certificates – are accessible in the 17 autonomous communities.
The most outstanding milestone of this edition is that the Balearic Islands become the first autonomous community to offer access to all ten datasets. The Community of Madrid has also published the ten, although without NIF in the bases of economic agents and ERE/ERTE, which limits the impact of their opening.
The development of the Top 10 has taken place in three phases, each focused on different datasets. The evolution is analysed in the report:
Phase 1 (2019), where the opening of databases of associations, cooperatives and foundations was promoted. Currently, 12 autonomous communities allow access to the three databases with NIF. In the specific case of cooperatives, 15 of the 16 autonomous communities that offer this information also include the NIF, although there is still one autonomous community to publish this data.
Phase 2 (2020), focusing on datasets on energy performance certificates, SAT ( Agricultural Transformation Societies) registers and industrial estates. There has been progress in industrial estates, which are now accessible in all communities. There are now 14 communities with the six sets of the first two phases available, leaving only La Rioja, Cantabria and Andalusia in the SAT register.
Phase 3 (2023), focused on datasets of economic agents, educational centres, health centres and ERES-ERTES (Employment Regulation File and Temporary Employment Regulation File). It is the most incipient phase. Progress has been made, but more work is needed. So far, only three communities offer data on economic agents with NIF (Navarra, the Balearic Islands and Madrid). In the case of the ERE/ERTE, 11 although only the Balearic Islands include the NIF or company name of the company, which limits the real impact of this opening.
New success stories and good practices
The report includes a selection of products and services that illustrate how the sector transforms public data into valuable solutions:
GeoMarketing Xpert®: Advanced analytics solution that integrates AI and machine learning models to optimize business location strategies, combining consumer, sales potential, and competition data.
Climate risk data and energy certifications: This database centralizes and updates in real time more than 9 million real certificates, combined with climate risk data organized by temperature, wind, water and soil, differentiating between chronic and acute risks.
GeoCRM: This CRM shows the commercial portfolio on a map, with business and financial data, allowing you to prioritise prospecting and optimise commercial routes.
Informa IA Chat: Generates dynamic reports on the situation of a company in natural language from a business database with the possibility of extending the query to all the information available on the internet.
Artificial Intelligence comes to Insight View: This interactive tool that incorporates artificial intelligence to answer questions and contextualize data automatically, allowing each company to be better understood, risks to be identified and decision-making to be streamlined.
Open Data Technical Office: A solution from the Government of Catalonia that combines governance and a technological platform to publish accessible and interoperable data. The portal also functions as an internal hub for sharing between departments.
Credit insurance claims management support platform: Solution that automates claims verification through a single repository, intelligent data extraction with AI and automated reconciliation.
The report also includes good practices from public administrations and the academic sector such as:
AI dataset analyzer: This tool allows anyone without technical knowledge to consult datasets in natural language, eliminating format barriers, thus promoting autonomous analysis of public information.
GeoEditPro and Emergency Registry Portal: The Association of Property Registrars has promoted these two initiatives. GeoEditPro facilitates the validation of graphic registry documentation publicly and without authentication. For its part, the Emergency Registry Portal, created after the eruption of the Cumbre Vieja volcano in 2021, allows those affected by natural disasters to request a simple note of their properties free of charge.
Madrid City Council's open data portal: In February 2026 it launched a platform, reaching 670 datasets from 60 municipal units and more than 489,000 visits.
Navarre Data Federator Project: Winner of the 2024 Audaz Award, it allows entities of any size to publish data in a common space in a simple and automated way. It stands out for the democratization of data and for the strategic collaborations with the IDENA geoportal, the NASTAT statistics institute, the Public University of Navarra and the Navarre Federation of Municipalities and Provinces.
Open data portal of the University of Extremadura: Integrates more than 140 datasets with the highest level of reuse. In addition, it has developed a knowledge graph that connects information from multiple sources, allowing complex queries to be carried out and aggregated knowledge to be obtained automatically.
UniversiDATA: Collaborative portal that brings together six Spanish public universities under a common governance and publication model, awarded by ASEDIE in 2025 in the category "Promoting the Data Economy".
In conclusion, the Spanish infomediary sector is going through a stage of consolidation marked by sustained growth and greater specialization. This year's edition confirms the good trend in the data economy, with 796 active companies, more than 26,500 jobs and a turnover of 2,870 million euros. Although there are still regulatory challenges and differences in the degree of openness between administrations, the evolution of the sector points to a more mature ecosystem with the capacity to continue generating economic activity and progress from the reuse of information.
 28/05/2026

Other resources
Fuel price analysis with GenAI as co-pilot: from theory to practice
Introduction
In recent years, we have seen how generative artificial intelligence has ceased to be a technical curiosity and has become an everyday tool in the workflow of data professionals. However, an important question remains: how does this technology translate into a real process of open data analysis?What changes in practice when an analyst works "alongside" a language model rather than alone?
This post documents a practical exercise carried out with data published on the datos.gob.es portal: the price analysis of the more than 11,000 service stations in Spain. Unlike other exercises published in this space, the analysis has not been carried out manually line by line, but has been carried out in an agentic environment: a conversational interface supported by a large language model (LLM) and a coding system assisted by artificial intelligence. In practice, this means that instead of writing the analysis code ourselves, we describe to the system in natural language what we want to obtain, and it implements it.
The objective of this post is twofold. On the one hand, to explain the analysis itself: what questions we ask ourselves about the data, what technical problems we find and what conclusions we draw. On the other hand, to reflect on the method: how an analysis process is structured when working with an AI co-pilot, what interaction patterns work best, and where the limits of automated assistance are.
Methodological note: to carry out this exercise we have used a Spec Driven Development (SDD) methodology, which guides the AI through a structured process with the aim of preventing the conversation from losing the focus of the exercise. The detailed explanation of this methodology is beyond the scope of this post, but the reader will find in the repository specifications, technical plans and checklists that document it.
Accesses the GoogleColab notebook
Accesses the GoogleColab notebook
In this video, the author explains what you will find on both Github and Google Colab.
The process: a classic, AI-assisted flow
Before entering into each phase, it is useful to describe the general outline of the work. The analysis follows five common stages in data science—ingestion, cleansing, exploration, variable engineering, and impact analysis—but introducing a conversational pattern with AI in each of them.
That pattern can be summarized in five steps:
Describe the problem in natural language.
Propose a first solution (AI does it).
Question the assumptions of that proposal (the human analyst does it).
Refine the solution until it is robust.
Document the pattern for reuse in future projects.
Below, we will see, phase by phase, how this pattern materializes in the analysis of fuel prices. Each section begins by explaining the conceptual challenge, continues to describe how we approach the resolution with the assistance of AI, and ends by showing the resulting code and lessons learned.
Phase 1: Robust data ingestion from a public API
The challenge: public APIs that don't always respond as expected
Notice to reader: This phase goes into some technical detail about API integration, SSL errors, and backup strategies. If your profile is more analytical than developmental, you can skim through the code block and focus on the Approach and Reflection sections, where the underlying idea—how to design fault-tolerant ingestion—is explained without going into implementation details.
Downloading data from the API of the Ministry for Ecological Transition is conceptually simple: an HTTP GET request to a known endpoint should return a JSON file with approximately 11,000 service stations. In practice, however, public APIs present common difficulties that any analyst ends up encountering sooner or later:
Expired or misconfigured SSL certificates, which cause SSLError errors.
Blocking of IPs from cloud servers (Google Colab, AWS, etc.), interpreted as suspicious traffic.
Unstable servers, with variable response times and sporadic timeouts.
Inconsistencies in documentation, for example, when a JSON response is described but the server returns XML.
The key question is: how do we design an intake system that tolerates these problems rather than failing at the first hurdle?
The Approach: A Tiered Backup Architecture
In software engineering, critical systems don't depend on a single component. When one channel fails, there is a fallback channel. Applying this logic to data ingestion is especially useful when working with public sources over which we have no control.
For this exercise, we designed a three-pronged strategy:
First attempt — requests with permissive configuration: we make the HTTP request with the standard Python library, but configuring a User-Agent that simulates a real browser and disabling SSL verification. This solves a good part of the certificate problems.
Second attempt — curl from shell: If requests fails, we invoke curl as a thread. The reason is that curl uses a different TLS stack than Python and does not send the same certificates, which allows certain types of blocking to be circumvented.
Third attempt — demo data: if all else fails, we generate a synthetic set of 11,000 service stations with realistic distributions. This ensures that the notebook is always executable in an educational context, even if the API is down.
The basic reasoning is simple: each method circumvents a different type of network failure, and their combination provides robustness. Below, we show the code that implements this architecture.
The resulting code
The following excerpt illustrates how the three levels of support materialize into a single function. The try/except clauses allow the failure of each method to be detected and automatically moved to the next one:
def descargar_datos_api(url):
"""
Download data with triple backup:
1. requests with verify=False (circumvents SSL issues)
2. curl -k (alternate TLS stack)
3. Synthetic data (performance guarantee)
"""
# Attempt 1: Requests with browser headers
Try:
sesion = requests. Session()
sesion.headers.update({
"User-Agent": "Mozilla/5.0 (Windows NT 10.0; Win64; x64)"
})
response = sesion.get(url, timeout=45, verify=False)
return response.json()
except Exception as e_requests:
print(f"[Respaldo 1] requests ha fallado: {e_requests}")
# Attempt 2: curl as thread
Try:
resultado = subprocess.run(
["curl", "-s", "-k", url],
capture_output=True, timeout=45, text=True
)
return json.loads(resultado.stdout)
except Exception as e_curl:
print(f"[Backup 2] curl has failed: {e_curl}")
# Attempt 3: Demo Synthetic Data
print("[Backup 3] Using demo data")
return generar_datos_demo_gasolineras(11000)
Reflection: where AI adds value in this phase
Iteration with AI didn't produce the previous code in one attempt. The actual process was more interesting: we posed the problem ("the API sometimes rejects requests, I need backups"), the AI proposed an initial solution, and the breakthrough came from questioning that proposal. The question "why should curl work if requests has already failed?" forced the model to explain the differences between the two TLS stacks, which in turn allowed us to validate that the solution had real technical merit, it wasn't just "try the same thing twice".
A reasonable estimate: Solving this problem through pure trial and error would have taken about two to three hours of debugging. With assisted iteration, we tackle it in about thirty minutes.
Phase 2: Cleaning with domain knowledge
The challenge: real data is never perfect
Once the data is downloaded, the least visible but most decisive work of any analysis begins: cleaning and preparation. The quality of the final result depends to a large extent on the care put into this stage. In the case of fuels, the most common inconsistencies are:
Non-standard textual variants: The trademark "MOEVE" may appear as "MOEVE", "Moeve" or "moeve" in different registers. To a person they are obviously the same brand, but in an aggregation by groupby they appear as three separate categories.
Incorrect geographical coordinates: points located outside Spanish territory (remote islands, fragments of Morocco, capture errors).
Inconsistent decimal separators: Prices coded as "1.349" with a comma, which require explicit conversion before you can trade them.
Conversions that introduce null values: pd.to_numeric(..., errors='coerce') is very useful, but it generates silent NaN that can break subsequent analyses.
The central question of this phase is: how do we translate human domain knowledge into code rules?
The approach: validation organized in layers
Instead of cleaning up "as it happens," it's a good idea to organize validation rules into layers, each with a clear responsibility:
Layer
Liability
Example
Types
Conversion and coercion at appropriate rates
Price as float, date as datetime
Ranks
Values within reasonable limits
Price between €0.5 and €3.0 per litre
Semantics
Domain consistency
Coordinates within Spain, standardised marks
Figure 1. Validation table organised by layers. Source: own elaboration - datos.gob.es
The question that each layer must answer is always the same: does this value make sense in the context of Spanish service stations? The novelty compared to a manual flow is that here we describe the rules to the AI in natural language and let it translate them into panda code. We retain the responsibility of defining what is valid and what is not.
The resulting code
The next block implements the three validation layers sequentially. It should be noted that the list of brand aliases (CEPSA → MOEVE) reflects specific business knowledge – the rebranding of CEPSA to MOEVE in 2023 – that AI could not infer on its own; it is information provided by the analyst. This is a very clear example of the contribution of human knowledge that is difficult to achieve by AI:
def validar_y_limpiar_carburantes(df):
# Layer 1: Type Normalization
df['price'] = (
df['precio'].astype(str)
.str.replace(',', '.')
.astype(float)
)
df['March'] = df['March'].str.upper().str.strip()
# Layer 2: Rank Validation
df = df[(df['price'] >= 0.5) & (df['price'] <= 3.0)]
df = df[
(df['latitude'] >= 27.5) & (df['latitude'] <= 43.8) &
(df['longitude'] >= -18.2) & (df['longitude'] <= 4.4)
]
# Layer 3: Semantic coherence (business knowledge)
aliases = {'CEPSA': 'MOEVE'} # Rebranding 2023
df['tag'] = df['tag'].map(lambda x: aliases.get(x, x))
# Null audit
null = df[['price', 'latitude', 'longitude', 'mark']].isnull().sum()
if nulos.sum() > 0:
print(f"Attention: null values have been detected:\n{null}")
return df.dropna(subset=['price', 'latitude', 'longitude'])Reflection: the division of work between AI and the analyst
This phase is especially revealing of the type of collaboration that AI enables. The more technical rules (type conversion, null detection, capitalization normalization) are practically automatic: just describe the problem and the model proposes a correct implementation. On the other hand, the rules that depend on the domain (that the Canary Islands have a logistics cost overrun of 5%, that CEPSA and MOEVE are the same brand after the merger, that a price of less than €0.5 is probably a loading error) must be specified by the human analyst.
The lesson learned is important: the quality of cleanliness depends directly on the domain knowledge that the analyst provides. AI speeds up deployment, but it doesn't invent context. That's why the reusable pattern is the same in any project: describe your domain in detail, let the AI write the validations, and verify yourself that the results are consistent.
Phase 3: Visual Exploratory Analysis (EDA)
The challenge: turning numbers into intuitions
With 11,000 clean records already in memory, the next step is to answer the business questions that prompted the analysis. In this case, we ask four specific questions:
Which provinces have the most expensive fuels?
Is there a relationship between geographical location (latitude and longitude) and price?
Are there significant differences between brands?
How are prices distributed (mean, median, outliers)?
The technical challenge is not complex – pandas and matplotlib solve any of these questions – but the methodological challenge is: choosing the right visualization for each question. A poorly chosen chart can hide as much as an incorrect aggregation.
The approach: each question determines its graph
In exploratory analysis there is a natural correspondence between the type of question and the most appropriate visualization. It is worth keeping this in mind before writing a single line of code:
Question
Proper Visualization
Reason
Ranking?
Neat bar chart
Allows you to compare ordered values
Spatial relationship?
Scatter with color scale
Shows correlation in two dimensions
Distribution and atypical?
Box plot
Reveals median, quartiles and outliers
Differences between groups?
Box plot o violin plot
Compare distributions simultaneously
Figure 2. Table showing the natural correspondence between question type and the most appropriate visualisation. Source: own elaboration - datos.gob.es
The goal is not to produce flashy graphics, but graphics that answer specific questions. This is a seemingly obvious idea, but it's worth remembering: in practice, it's common for viewings to be generated by inertia, without being clear about what you want to show.
The resulting code
Below, we show one of the graphs as an example, the price ranking by province. The structure is always the same: statement of the graphic, aesthetic configuration, and a brief comment interpreting the result:
# Question 1: Which provinces are the most expensive?
top_provincias = (
df.groupby('province')['price']
.mean()
.sort_values(ascending=False)
.head(12)
)
fig, ax = plt.subplots(figsize=(12, 6))
top_provincias.plot(kind='bar', ax=ax, color='steelblue')
ax.set_title('Average fuel price by province (Top 12)',
fontsize=14, fontweight='bold')
ax.set_ylabel('Price (€/litre)')
ax.set_xlabel('Province')
plt.xticks(rotation=45, ha='right')
plt.tight_layout()
plt.show()
# Finding: the three most expensive provinces are island or coastal
# (Balearic Islands, Canary Islands, Tarragona). Hypothesis: the logistics cost
# and the distance from distribution hubs raise the price.In the case of the geographic scatter, we apply additional segmentation – mainland, Balearic and Canary Islands – to simultaneously visualize location and insularity. This segmentation revealed a pattern that no numerical aggregation had clearly shown: island stations have systematically higher prices, a finding probably attributable to shipping costs. Insight did not emerge from a calculation, but from visualization.
Reflection: The AI blind spot
This phase highlights an important limitation of the model: the AI does not see the graphical result. You can suggest the right type of visualization, write the code correctly, and propose a color palette, but you can't judge whether the axis scale is appropriate, whether the dot density saturates the graphic, or whether the labels overlap. All these validations remain the responsibility of humans.
In practice, this means that the EDA phase is the one that requires the most iteration between person and machine: the AI writes, the analyst observes, identifies a visual problem ("this axis does not show the variation well"), and describes the correction ("sets the Y-axis to [precio_min0.95, precio_max1.05]"). The reusable pattern is clear: a clear question, a suitable chart type, and human visual validation.
Phase 4: Feature engineering
The challenge: capturing variation with new variables
Exploratory analysis identifies patterns, but rarely explains them. To understand what factors influence the price , it is necessary to construct new variables (features) that capture specific hypotheses about market dynamics. In this exercise we formulate three hypotheses:
Temporary: Does the day of the week influence the price? Is it more expensive to refuel at the weekend?
Geographical: Does the distance to an economic hub (in this case, Madrid) have an influence?
Regional: Are there structural differences between the north, centre and south of Spain?
Variable engineering consists precisely of translating these hypotheses into calculated columns that the rest of the analysis can use.
The approach: every variable, a testable story
A good variable should tell a clear story. It is not enough to calculate a number: you have to be able to explain what question you are trying to answer. In our case:
es_fin_semana (0/1): Does the price change on Saturday and Sunday?
distancia_a_madrid (km): Does fuel become more expensive when moving away from the logistics hub?
Region (North/Central/South): Are there structural gaps between regions?
Each of these three variables is, in reality, an empirical question disguised as a column. If the variable does not explain anything when we cross it with the price, we simply discard it.
The resulting code
We implemented all three variables into a single function. The most technically interesting is the distance to Madrid, which requires Haversine's formula to calculate distances on the Earth's surface taking into account the curvature of the planet:
from math import radians, cos, sin, asin, sqrt
def crear_features_carburantes(df):
# Temporal variable
df['es_fin_semana'] = (
df['fecha'].dt.dayofweek.isin([5, 6]).astype(int)
)
# Geographic variable: distance haversine to Madrid
madrid_lat, madrid_lon = 40.4168, -3.7038
def haversine(lat, lon):
lat, lon = radians(lat), radians(lon)
m_lat, m_lon = radians(madrid_lat), radians(madrid_lon)
chisel = years - m_lat
dlon = lon - m_lon
a = sin(dlat/2)**2 + cos(m_lat) * cos(lat) * sin(dlon/2)**2
return 6371 * 2 * asin(sqrt(a)) # radius of the Earth in km
df['distancia_a_madrid'] = df.apply(
Lambda R: haversine(r['latitude'], r['longitude']), axis=1
)
# Variable regional
def region(lat):
if lat >= 42: return 'Norte'
if lat >= 39: return 'Centro'
return 'On'
df['region'] = df['latitud'].apply(region)
return dfReflection: proposing variables with argument, not just code
At this stage, AI provides particularly high value, but not in what you might think at first glance. What is really useful is not that he writes Haversine's formula – any technical reference contains it – but that he proposes candidate variables with argumentation behind them. When we asked "what features could capture the price variation?", the proposal was accompanied by reasoning: Madrid was suggested as a hub because it is the most efficient and stable market, and therefore deviations from its price work as an approximation to logistical friction.
That reasoning is what is valuable: not the formula, but the justification. Pure trial-and-error would have taken three or four hours exploring variables to find the useful ones; With assisted iteration, we arrive at a reasoned set in about forty-five minutes.
Phase 5: Analysis of the impact of the variables
The challenge: quantifying the real contribution
Building variables is one thing; Showing that they really explain something is another. In this last phase of the analysis, we evaluated the effective impact of each of the three variables created, combining two approaches: a numerical measure (correlation or difference in means) and a visual representation that allows us to interpret the result at a glance.
The approach: two complementary approaches
For each variable, we calculate:
A numerical measure that quantifies the effect (Pearson correlation for continuous variables; mean difference for categorical variables).
A visual representation that allows the magnitude of the effect to be interpreted and non-linear relationships to be detected.
The crossing of both approaches is what gives reliability to the result. A high correlation without a visualization to support it can be misleading (e.g., if it is dominated by outliers); A suggestive visualization without metrics can lead to overinterpretation.
The resulting code
As an example, we show the impact analysis of the distance to Madrid. First we calculate the correlation, then we segment it into quartiles to make the relationship visually interpretable:
# Numerical Measurement
correlation = df['distancia_a_madrid'].corr(df['price'])
print(f"Correlation (distance to Madrid → price): {correlation:.3f}")
# Visual representation by distance quartiles
df['cuartil_distancia'] = pd.qcut(
df['distancia_a_madrid'], q=4,
labels=['Q1 (near)', 'Q2', 'Q3', 'Q4 (far)']
)
precio_por_cuartil = df.groupby('cuartil_distancia')['precio'].mean()
fig, ax = plt.subplots(figsize=(10, 5))
precio_por_cuartil.plot(kind='bar', ax=ax, color='#2ecc71')
ax.set_title ('Geographical impact: average price per quartile distance to Madrid')
ax.set_ylabel('Average price (€/litre)')
plt.xticks(rotation=0)
plt.tight_layout()
plt.show()The emerging pattern of the complete analysis – comparing the three variables – is that the distance to Madrid is the most explanatory, followed by the region, and finally by the weekend effect, which in our study period turns out to be marginal. Together, the three variables explain approximately 60-70% of the price variation; The rest depends on factors such as the specific brand, the type of season (highway, urban, rural) and specific market events.
Reflection: not all variables have the same impact
One of the virtues of this structured analysis is that it reveals which of our initial hypotheses hold and which do not. In this case, the temporal (weekend) hypothesis turned out to be much weaker than expected, while the geographical hypothesis was clearly confirmed. Without this quantification step, we would have been able to continue assuming that all variables provide valuable information.
Synthesis: the technical lessons we take away
Throughout the five previous phases we have been accumulating solutions to specific problems. The following table summarizes the most reusable; Each is documented in greater detail in the repository's Prompts directory:
Phase
Problem
Solution
Reusable in
Intake
SSL or IP blocks in APIs
Triple respaldo: requests → curl → demo
Any public API
Intake
Inconsistent documentation
Structure validation + error handling
Government APIs
Cleaning
Textual variants in trademarks
.str.upper().str.strip() before grouping
Any categorical aggregation
Cleaning
Coordinates outside Spain
Bounding box [27.5–43.8, −18.2–4.4]
Geographical analyses in Spain
Cleaning
Compressed ranges in graphs
ax.set_xlim(min*0.95, max*1.05)
Viewing with narrow ranges
EDA
Choosing a chart type
Explicit Mapping Question → Graph
Any EDA
Features
Unjustified variables
Each feature responds to a testable hypothesis
Feature engineering in general
Analysis
Unquantified impact
Metric + side-by-side display
Any impact analysis
Figure 3. Summary table of solutions to specific problems. Source: own elaboration - datos.gob.es
Final Thought: What Makes AI a Good Co-Pilot
At the end of the exercise, we can draw some general conclusions about the use of generative AI to support data analysis. We divide them into two levels: where it adds value, and where it should not replace human judgment.
Where AI clearly adds value:
Rapid iteration. The cycle "describe problem – get solution – validate" is reduced from hours to minutes. This qualitatively changes the work dynamic: it allows us to test ideas that we would otherwise discard because of cost.
Lateral thinking. AI proposes alternatives that an analyst might overlook, such as the idea of using curl when requests fail. It does not always get it right, but it does expand the space of solutions considered.
Articulated documentation. AI is especially good at explaining the why of a technical decision, not just the what. This makes it easier for the resulting code to be readable by non-technical people.
Where human judgment is still essential:
Domain knowledge. The AI does not know that CEPSA and MOEVE are the same brand, nor that the Canary Islands have a structural logistical cost overrun. That information must be provided by the analyst.
Statistical validation. AI can suggest models, but the statistical validity of the analysis is a human responsibility.
Reading graphs. The AI doesn't see its own visualizations. The judgment on whether a graphic is legible, communicates what is intended and respects good visual practices is still human.
Business decisions. What to ask of the data, what to consider relevant, how to communicate the results to the organization: these are decisions that AI can support, but not replace.
In short, the idea that best sums up our experience is this: generative AI works better when it thinks with us than when it thinks for us. The exercise we present here was not to "ask Claude to do the analysis", but to have a structured conversation in which the AI proposed, the analyst questioned, the AI refined, and the analyst validated. The result of that conversation is a more robust, better documented, and more reusable analysis than we would have produced alone.
How to take advantage of this repository
The full code, prompts, and documentation are available in the project's public repository. Different profiles can take advantage of it in different ways:
If you study data analysis: open the notebook directly in Google Colab and go through each cell in order. For each visualization, please refer to the corresponding prompt in prompts/visualization/.
If you work as a data scientist: Check out specs/001-fuels-ia/plan.md, where architectural decisions and lessons learned are documented. Prompts/ snippets are reusable as is in other projects.
If you're interested in prompt engineering methodology: the "describe – question – refine – validate" pattern is documented on a case-by-case basis throughout the prompts. It is replicable in any domain: finance, health, marketing, or any open data analytics.
Conclusion
The exercise we have presented shows that generative AI, used judiciously, can significantly accelerate the analysis of open data without sacrificing methodological rigor. The five phases covered – ingestion, cleaning, exploration, variable engineering and impact analysis – remain the same as in a traditional flow, but the work dynamic changes: we go from writing code to describing intentions and validating results.
The total time spent was approximately forty hours, compared to the one hundred and twenty that would have required equivalent development without AI assistance. But more important than the time savings is the quality of the resulting product: a documented, reproducible analysis accompanied by a library of reusable prompts.
Generative AI doesn't relieve us of analytical responsibility, but it does allow us to spend more time on what really matters: asking the right questions, judiciously validating results, and communicating conclusions clearly. In short, to do better data science.
Content created by Alejandro Alija, an expert in digital transformation and innovation. The content and views expressed in this publication are the sole responsibility of the author.
18/05/2026